

The Balance Sheet answers one question:
Are you healthy?
Let’s dive in:
Are you healthy?
Let’s dive in:
All Balance Sheets are based on this formula;
Assets = Liabilities + Equity
The balance sheet communicates those values on a specific date (and any date you choose) and is always in balance.
Let’s discuss the components and how to analyze it:
Assets = Liabilities + Equity
The balance sheet communicates those values on a specific date (and any date you choose) and is always in balance.
Let’s discuss the components and how to analyze it:
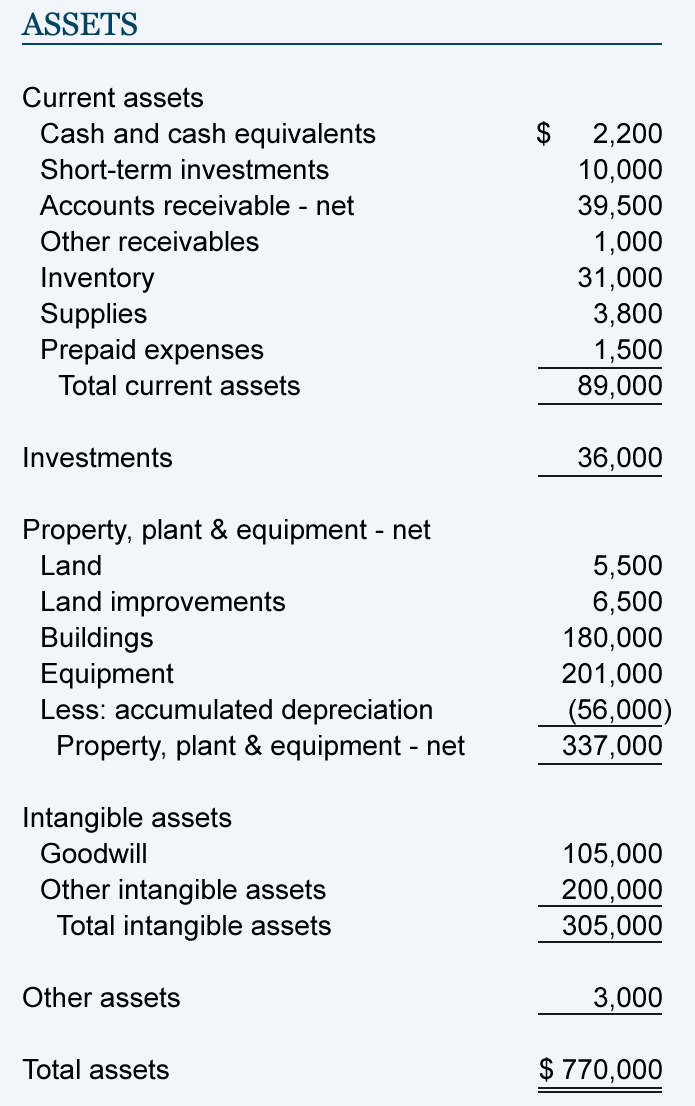
Assets are what you own:
• Cash
• Accounts Receivable (money owed to you)
• Inventory (product in your possession but not sold)
• Fixed Assets (property, equipment, machinery, or vehicles)
• Intangible Assets (software, licenses, trademarks, or goodwill)
• Cash
• Accounts Receivable (money owed to you)
• Inventory (product in your possession but not sold)
• Fixed Assets (property, equipment, machinery, or vehicles)
• Intangible Assets (software, licenses, trademarks, or goodwill)
Liabilities are what you owe.
They’re broken down into 2 categories:
• Current Liabilities (owed in less than a year)
• Long-term liabilities (owed in more than a year)
They’re broken down into 2 categories:
• Current Liabilities (owed in less than a year)
• Long-term liabilities (owed in more than a year)
Current Liabilities mature in less than one year:
• Accounts Payable (money owed to vendors)
• Credit Card Payables (just a different accounts payable)
• Short-term debt (obligations to pay)
• Current portion of long-term debt
• Accounts Payable (money owed to vendors)
• Credit Card Payables (just a different accounts payable)
• Short-term debt (obligations to pay)
• Current portion of long-term debt
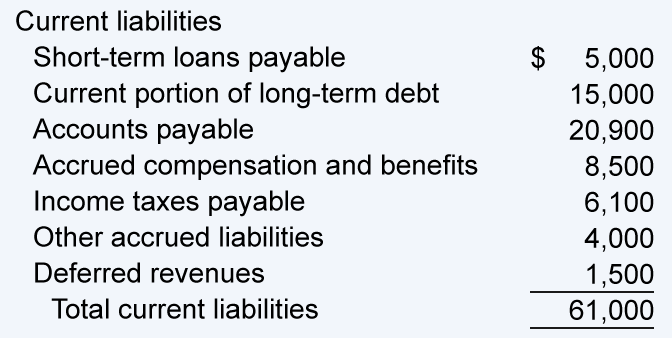
Long-term Liabilities can include:
• Car loans
• Equipment loans
• Long-term leases
• Deferred compensation
• Car loans
• Equipment loans
• Long-term leases
• Deferred compensation
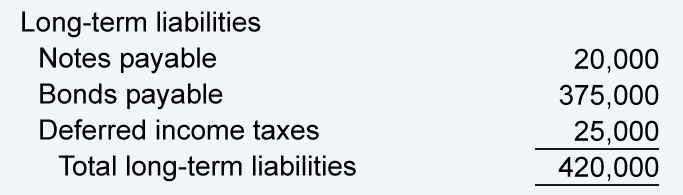
Equity is how much the company is worth on paper.
It can be labeled a lot of different ways, but the components are the same:
• Common stock (initial capital investment)
• Owner’s contributions
• Owner’s distributions
• Retained earnings
It can be labeled a lot of different ways, but the components are the same:
• Common stock (initial capital investment)
• Owner’s contributions
• Owner’s distributions
• Retained earnings
Net Profit from the Income Statement goes into Retained Earnings.
If you have multiple owners, that can be distributed out to owner’s equity positions, but the mechanics here can differ from company to company.
If you have multiple owners, that can be distributed out to owner’s equity positions, but the mechanics here can differ from company to company.
Now that we’ve set the foundation, we can analyze this statement with the following ratios:
• Accounts Payable Aging
• Accounts Receivable Aging
• Debt-to-equity Ratio
• Current Ratio
• Quick Ratio
• Accounts Payable Aging
• Accounts Receivable Aging
• Debt-to-equity Ratio
• Current Ratio
• Quick Ratio
• Accounts Payable Aging
This is an additional report that will show you the bills outstanding and how old they are.
This is an additional report that will show you the bills outstanding and how old they are.
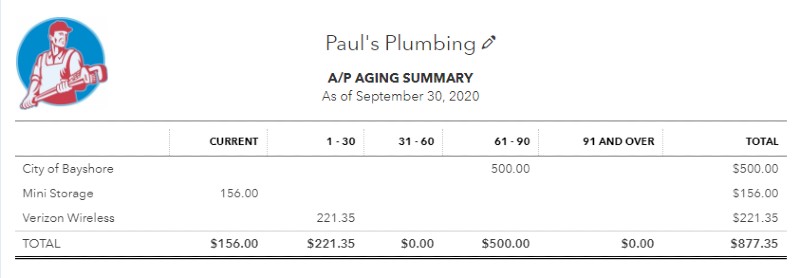
When struggling with cash flow, companies use this report to manage what’s outstanding and prioritize who to pay.
If Payables are high (compared historically) it can be a warning sign.
If Payables are high (compared historically) it can be a warning sign.
• Accounts Receivable Aging
This is an additional report that will show the invoices outstanding and how old they are.
This is an additional report that will show the invoices outstanding and how old they are.
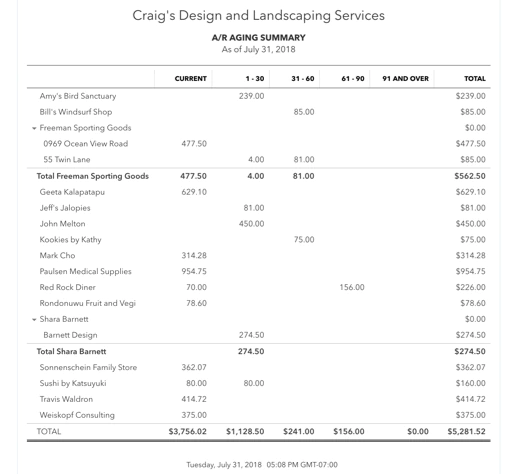
It’s important to watch this report like a hawk and make regular contact with customers who are past due.
This report is used to determine who to contact and make decisions about whether a customer needs to be “cut off” for failing to pay.
This report is used to determine who to contact and make decisions about whether a customer needs to be “cut off” for failing to pay.
• Debt-to-equity Ratio
Total Liabilities / Total Equity
This determines how leveraged the company is.
Total Liabilities / Total Equity
This determines how leveraged the company is.
The higher the number, the more risky the company is.
0.5 to 1.5 is usually considered to be a good range. As you get higher than 1.5, banks and lenders start to get nervous.
0.5 to 1.5 is usually considered to be a good range. As you get higher than 1.5, banks and lenders start to get nervous.
• Current Ratio
Current assets / Current liabilities
This determines your ability to meet your short-term ability to pay.
Current assets / Current liabilities
This determines your ability to meet your short-term ability to pay.
This ratio should remain above 1 to remain healthy.
A high ratio can signal an inefficient use of capital.
A ratio below 1 could signal you’re having trouble paying your bills.
A high ratio can signal an inefficient use of capital.
A ratio below 1 could signal you’re having trouble paying your bills.
• Quick Ratio
(Cash + Accounts Receivable) / Current Liabilities
This ratio shows how quickly companies could meet short-term obligations.
(Cash + Accounts Receivable) / Current Liabilities
This ratio shows how quickly companies could meet short-term obligations.
A result of greater than 1 indicates the company could quickly pay off their current liabilities.
If less than 1, it should be looked at with other data to determine the health of the company.
If less than 1, it should be looked at with other data to determine the health of the company.
There are other ratios out there that combine Balance Sheet and Income Statement numbers, such as:
• Days Payables Outstanding (DPO)
• Days Sales Outstanding (DSO)
• Inventory Turnover Ratio
We will get into these at a later date.
• Days Payables Outstanding (DPO)
• Days Sales Outstanding (DSO)
• Inventory Turnover Ratio
We will get into these at a later date.
Remember, the Balance Sheet shows you:
• How strong the business is financially
• Whether short-term obligations can be met
• The amount of debt a company has
• The book value of the company
• How strong the business is financially
• Whether short-term obligations can be met
• The amount of debt a company has
• The book value of the company
I hope this was helpful!
Tomorrow I’ll be diving into the Statement of Cash Flows, so follow me so you don’t miss it: @KurtisHanni
Tomorrow I’ll be diving into the Statement of Cash Flows, so follow me so you don’t miss it: @KurtisHanni
Also, myself & @IAmClintMurphy will be training business owners & leaders on these concepts May 25-27 in a 3 day cohort.
You’ll learn how to:
• make numbers-informed decisions
• communicate your numbers with clarity
Join now: maven.com
You’ll learn how to:
• make numbers-informed decisions
• communicate your numbers with clarity
Join now: maven.com

@IAmClintMurphy If you enjoyed this thread, retweeting the first tweet helps support me and spread the knowledge:
For those interested in the ratios I didn't break down (plus more), @itsnivt posted a great thread with 10 KPIs you must know:
@IAmClintMurphy I write a weekly newsletter where I talk about habits, frameworks, and anything else that I'm learning.
If that sounds interesting, you can subscribe here:
getrevue.co
If that sounds interesting, you can subscribe here:
getrevue.co
I talk about why you need to understand financials in my latest podcast.
You can check it out here: delveintomoney.com
You can check it out here: delveintomoney.com
Loading suggestions...