

What does today's report inflation report mean for households? Different ways to look at it depending on: (1) time period; (2) baseline; (3) what you're looking at; and (4) who you're looking at.
A 🧵
A 🧵
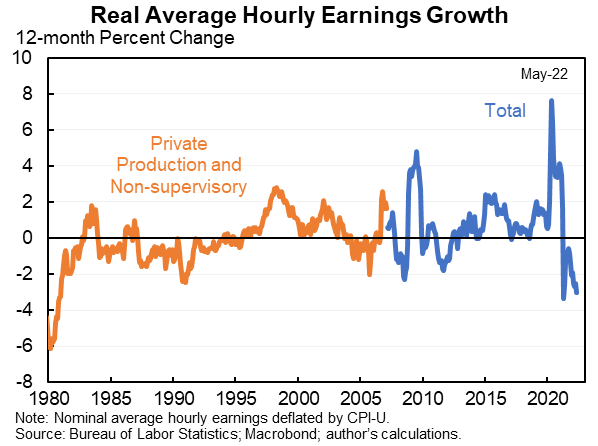
Over the last year real wages are falling at the fastest pace they have in forty years (excluding pandemic composition shifts last year).
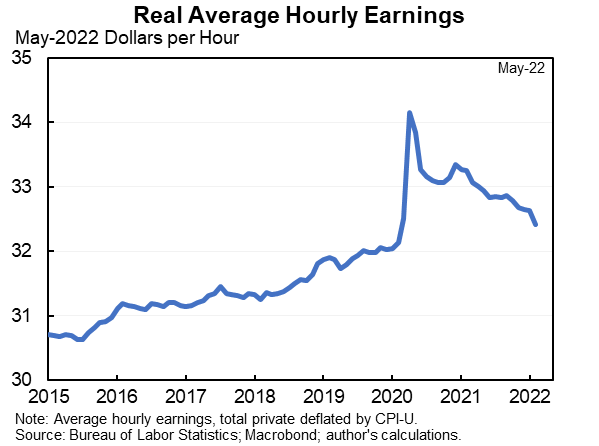
Real average hourly earnings in May were -0.6% below February 2020 (and likely further below adjusting for composition).
Real average hourly earnings in May were -0.6% below February 2020 (and likely further below adjusting for composition).
Running the Atlanta Fed's composition-adjusted model and smoothing over three months (h/t @IrvingSwisher who corrected my earlier errors here), real wages are up over the last three years for the bottom two quartiles--but less than their pre-pandemic trend.
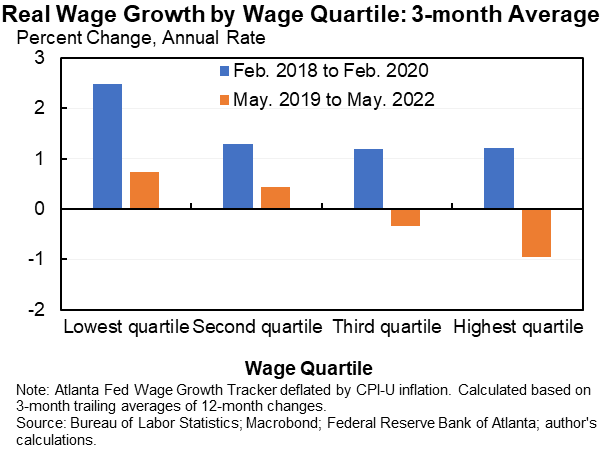
(Note, it would be better to look at February 2020 to May 2022 but can't given the way these data are constructed. It is likely that much but not all of the growth over the last three years happened pre-pandemic.)
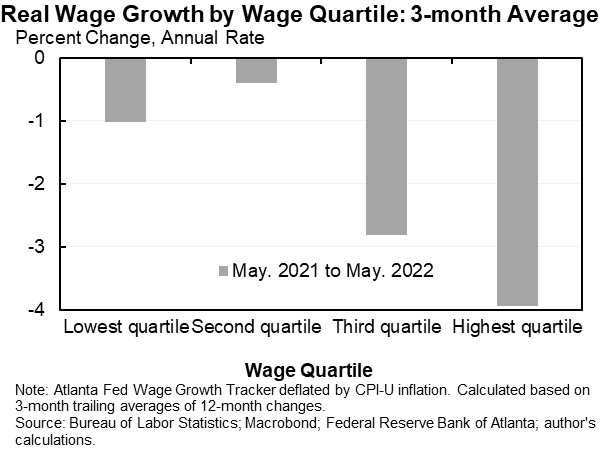
Over the last year real wages are down for all income groups, just down by less for lower-income ones.
All of the above is average hourly wages. Employment is up 4.5% in the last year so total wages paid are up. Although employment is down since February 2020 so that exacerbates the wage declines over that period.
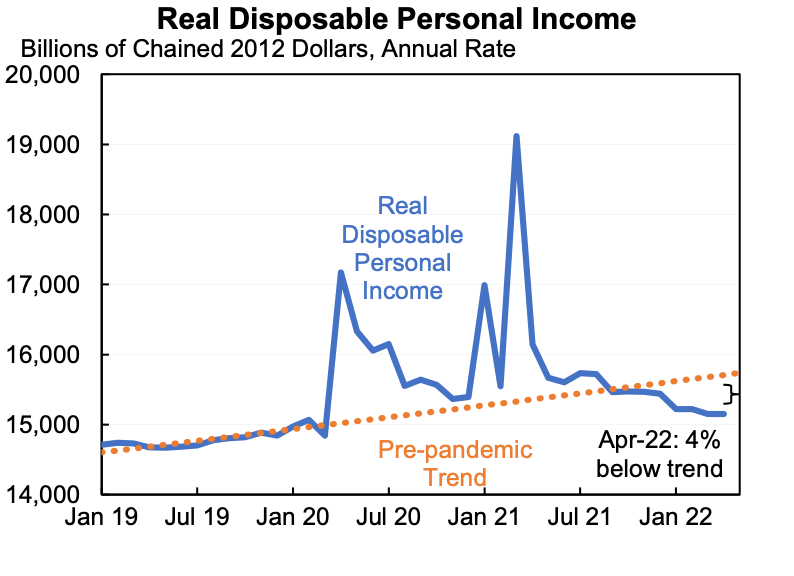
Finally, real disposable personal income--including transfers--also depends on the period. It is falling over the last year. But cumulatively since the pandemic people have gotten much more income than before. And balance sheets still healthier than before.
Loading suggestions...