

Wanna learn how to train better ML models, by finding and fixing issues in your data? At the speed of light?
Let's see how in this mega 🧵
#data
#machinelearning
Let's see how in this mega 🧵
#data
#machinelearning
The problem
You need to generate your training data at the beginning of every real-world ML project.
Typically, you access an SQL-type database and write a long query that pulls data from several tables, aggregates it, and merges it into the final training set.
You need to generate your training data at the beginning of every real-world ML project.
Typically, you access an SQL-type database and write a long query that pulls data from several tables, aggregates it, and merges it into the final training set.
The dataset contains a set of features and a target metric you want to predict.
Once you have this data, you are very tempted to train your first ML model.
And this is a BIG mistake.
Instead, you should put a few minutes aside to run a #data exploration
Once you have this data, you are very tempted to train your first ML model.
And this is a BIG mistake.
Instead, you should put a few minutes aside to run a #data exploration
but, why do I need data exploration?
Because, the best way to improve your results is NOT by trying more complex models, or by tunning hyper-parameters (real-world ML != Kaggle).
Instead, you should focus on increasing data quality. And you do this with data exploration.
Because, the best way to improve your results is NOT by trying more complex models, or by tunning hyper-parameters (real-world ML != Kaggle).
Instead, you should focus on increasing data quality. And you do this with data exploration.
When you explore a dataset, you pay attention to:
👉🏽Data bugs: Are there any weird things, that might show a bug in the data?
👉🏽Missing data: What is the percentage of missing observations for each feature?
👉🏽Data leakage: Are there features that look “too good to be true”?
👉🏽Data bugs: Are there any weird things, that might show a bug in the data?
👉🏽Missing data: What is the percentage of missing observations for each feature?
👉🏽Data leakage: Are there features that look “too good to be true”?
The question is then
> Is there a fast way to explore a dataset? 🤔
Yes, there is. 🙋🏽
Its name is Sweetviz, an open-source library you will fall in love with.
> Is there a fast way to explore a dataset? 🤔
Yes, there is. 🙋🏽
Its name is Sweetviz, an open-source library you will fall in love with.
Let’s go through a practical example and a Python script I use in my ML projects.
All the source code I present is publicly available in this GitHub repository
⭐ github.com
Feel free to use it in your next ML project 🤗
All the source code I present is publicly available in this GitHub repository
⭐ github.com
Feel free to use it in your next ML project 🤗
Example:
Let’s imagine you work as a data scientist in a Telecommunications company (aka Telco).
A common problem Telcos face is high customer churn. Due to high competition in this sector, customers often find more attractive deals from competitors, so they switch.
Let’s imagine you work as a data scientist in a Telecommunications company (aka Telco).
A common problem Telcos face is high customer churn. Due to high competition in this sector, customers often find more attractive deals from competitors, so they switch.
To mitigate this, the marketing team comes to you with an idea:
“Can you develop a model to predict customer churn?”
With that model, they could, for example, send special offers to customers who are about to churn and keep them on board.
That sounds like a plan
“Can you develop a model to predict customer churn?”
With that model, they could, for example, send special offers to customers who are about to churn and keep them on board.
That sounds like a plan
step 1. generate the training data
You go back to your laptop and do the first thing you need to do in every real-world ML project: you generate the training set.
You can find the exact dataset I am using for this example here
👉🏽 raw.githubusercontent.com
You go back to your laptop and do the first thing you need to do in every real-world ML project: you generate the training set.
You can find the exact dataset I am using for this example here
👉🏽 raw.githubusercontent.com
The dataset has one row per client, and each column is a feature, plus the binary target `Churn` you want to predict, that takes values:
• `Churn = "Yes"` meaning the customer churned.
• `Churn = "No"` meaning the customer did not churn.
• `Churn = "Yes"` meaning the customer churned.
• `Churn = "No"` meaning the customer did not churn.
The features you pulled out from the DB are these:
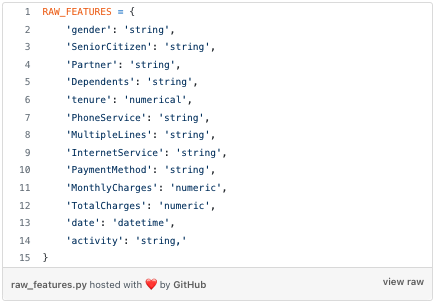
On top of these raw features, you engineer a few others, like `month`, `dayOfMonth`, `dayOfWeek` or `hour`, to capture temporal patterns in churn rates.
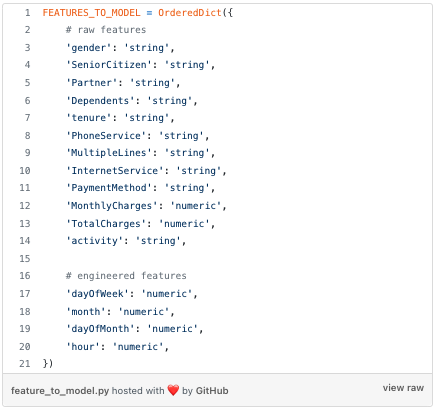
All in all, this is the complete set of features (raw + engineered) you end up having at your disposal:
All in all, this is the complete set of features (raw + engineered) you end up having at your disposal:
Tempted as you are to jump into the modeling part, you (wisely 😎) set some time apart to take a closer look at the dataset.
In a matter of seconds, Sweetviz generates a nice-looking HTML report for you like this
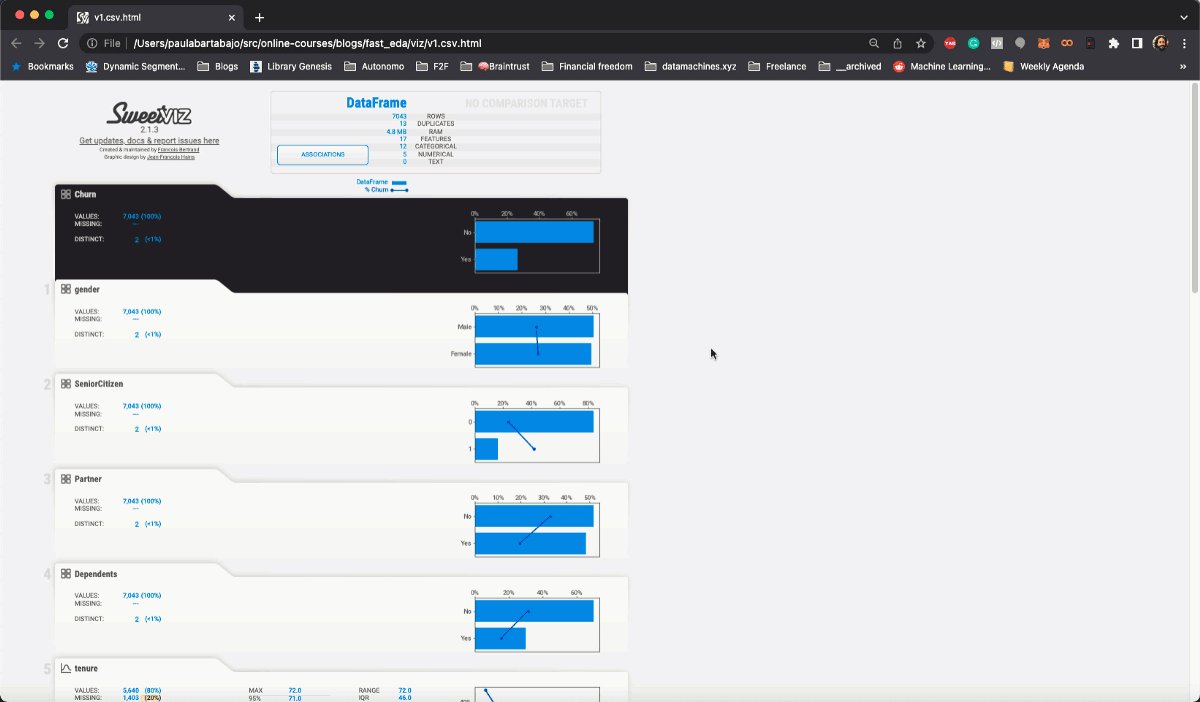
Let's take a look at it!
problem #1. data bugs
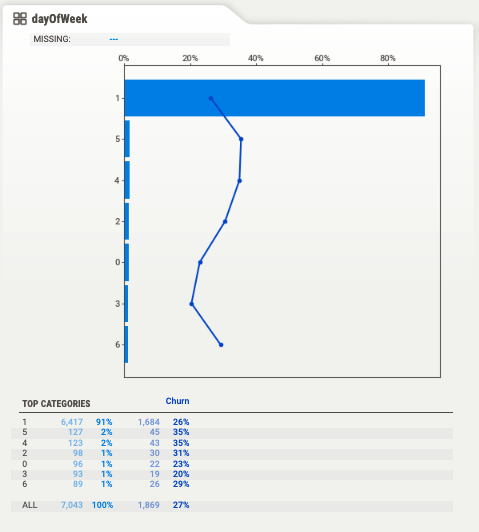
If you look at the temporal features `dayOfWeek`, `month`, `dayOfMonth` and `hour` you will see they have a very unbalanced distribution
For example, `dayOfWeek` is `1` (meaning Tuesday) for more than 90% of the observations.
If you look at the temporal features `dayOfWeek`, `month`, `dayOfMonth` and `hour` you will see they have a very unbalanced distribution
For example, `dayOfWeek` is `1` (meaning Tuesday) for more than 90% of the observations.
This looks weird to you 👦🏻, so you go and ask Mark 👴🏽, the data engineer on the team.
👦🏻: “Hey, Mark! How is it possible that almost 90% of our churn events happen on Tuesday?”
👴🏽: “That must be a bug in the `date` field. I had to reprocess the table a couple of weeks ago...
👦🏻: “Hey, Mark! How is it possible that almost 90% of our churn events happen on Tuesday?”
👴🏽: “That must be a bug in the `date` field. I had to reprocess the table a couple of weeks ago...
👴🏽 ... and I think I must have overwritten the actual churn date with the date I updated the records in the table.”
And this is exactly what is happening here.
If you look at the other temporal features you will quickly realize that Mark overwrote 90% of the `date` records on the 1st of February 2022.
If you look at the other temporal features you will quickly realize that Mark overwrote 90% of the `date` records on the 1st of February 2022.
You caught a data bug, that can be fixed and that will help you build a stronger model. Good job!
Dumb as it sounds, data bugs like these are the bread and butter of ML in the real-world.
Dumb as it sounds, data bugs like these are the bread and butter of ML in the real-world.
problem #2. missing data
Real-world datasets can be plagued with missing data. Sometimes, you cannot do much to remediate that.
However, oftentimes, missing data can be addressed upstream, by your data engineer friend Mark 👴🏽
Real-world datasets can be plagued with missing data. Sometimes, you cannot do much to remediate that.
However, oftentimes, missing data can be addressed upstream, by your data engineer friend Mark 👴🏽
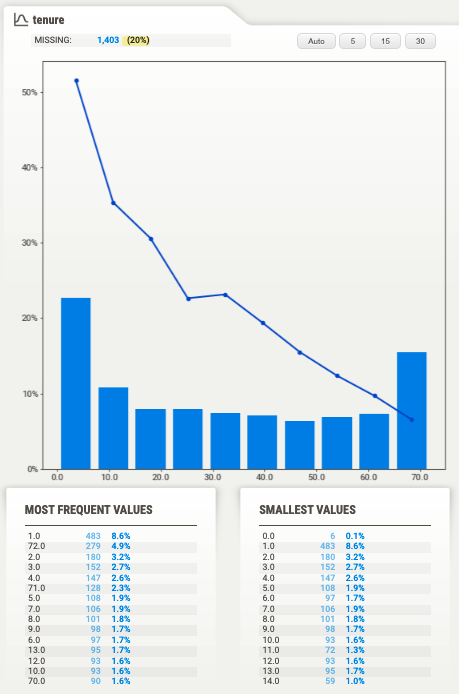
From the Sweetviz report, you clearly see that `tenure` has a strong negative correlation with `Churn`. Great, this means `tenure` is a predictive feature.
The only catch is that 20% of the samples do not have `tenure`, aka missing values.
The only catch is that 20% of the samples do not have `tenure`, aka missing values.
If you use the data as it is to train your model, you have to either:
• Impute these 20% missing values, using, for example, the sample median
• or simply drop this 20% of clients from our training data.
• Impute these 20% missing values, using, for example, the sample median
• or simply drop this 20% of clients from our training data.
Either way, your model results will be worse than if you tried to fix this data quality issue upstream. So you go to Mark and ask:
👦🏻: "Do we have `tenure` data from all our customers? I have lots of missing data in my training set for the churn prediction model"
👦🏻: "Do we have `tenure` data from all our customers? I have lots of missing data in my training set for the churn prediction model"
Mark looks at you, surprised, and says:
👴🏽: “We have `tenure` data for all our clients. I bet there is a bug in the SQL query you wrote to generate the training data”
👴🏽: “We have `tenure` data for all our clients. I bet there is a bug in the SQL query you wrote to generate the training data”
And it turns out that Mark is 100% right.
You fix the query and the percentage of missing `tenure` values goes to 0. Super.
You fix the query and the percentage of missing `tenure` values goes to 0. Super.
Bugs in SQL queries are common, so detecting potential issues and talking to the data engineer in the team is the best you can do to solve them.
problem #3. data leakage
You explore the data to understand what features show a high correlation with `Churn`. And sometimes, you happen to find features that look too good to be true.
You explore the data to understand what features show a high correlation with `Churn`. And sometimes, you happen to find features that look too good to be true.
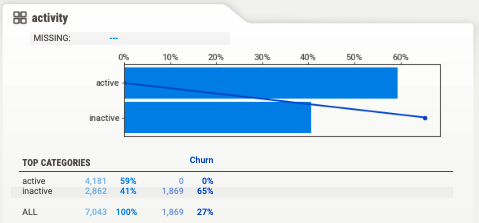
For example, `activity` is a categorical feature, with 2 possible values:
• `activity = "active"` meaning the customer used their phone 2 weeks prior to the churn rate.
• `activity = "inactive"` otherwise.
• `activity = "active"` meaning the customer used their phone 2 weeks prior to the churn rate.
• `activity = "inactive"` otherwise.
If you look at the Sweetviz report you will see it has an extreme correlation with `Churn`.
In particular, all users that were `active` did not churn… That seems too good to be true 🤨
In particular, all users that were `active` did not churn… That seems too good to be true 🤨
...so you ask Mark, how exactly is `activity` computed in the DB.
👴🏽: `activity` is a user-level feature that gets updated every day, so it reflects the state of the user at the time you generate the training data and not the time period before the churn event.
👴🏽: `activity` is a user-level feature that gets updated every day, so it reflects the state of the user at the time you generate the training data and not the time period before the churn event.
Hence, `activity` is not a feature you can use to train your model, because it uses information from the future.
This is what we call a data leakage, aka a piece of data that you think you can use to train your model, but you should not, because you will not have it at inference
This is what we call a data leakage, aka a piece of data that you think you can use to train your model, but you should not, because you will not have it at inference
Data leakages produce ML models that seem to work impressively well when you train them but fail miserably when you deploy them.
Wow, that was a very productive data exploration.
Wrapping it up
Data exploration is the only way to detect 3 big blockers for any ML project:
• Data bugs
• Missing data
• Data leakage
And Sweetviz is a very fast way to explore the data.
Data exploration is the only way to detect 3 big blockers for any ML project:
• Data bugs
• Missing data
• Data leakage
And Sweetviz is a very fast way to explore the data.
You can find all the code in this repo github.com
Please give it a star on GitHub if you find it useful.
Please give it a star on GitHub if you find it useful.
And if you want to learn more real-world #ML tricks and tips, subscribe to my newsletter
👉🏽 datamachines.xyz
and follow me on Twitter @paulabartabajo_
👉🏽 datamachines.xyz
and follow me on Twitter @paulabartabajo_
Loading suggestions...