

*RSI Mythbusting 🧵*
There's so much misinformation and general poor understanding about RSI. I'm going to go through some of the main misunderstandings to try and put you in the right frame of mind when looking at it.
(As a momentum trader)
There's so much misinformation and general poor understanding about RSI. I'm going to go through some of the main misunderstandings to try and put you in the right frame of mind when looking at it.
(As a momentum trader)
2. Oversold/Overbought regions
Absolutely unhelpful in any way shape or form. Markets remain oversold/overbought and still lose or gain huge %s of value
You NEVER expect a market top or bottom just because we reach an oversold/overbought region. You're a clown if you believe so
Absolutely unhelpful in any way shape or form. Markets remain oversold/overbought and still lose or gain huge %s of value
You NEVER expect a market top or bottom just because we reach an oversold/overbought region. You're a clown if you believe so
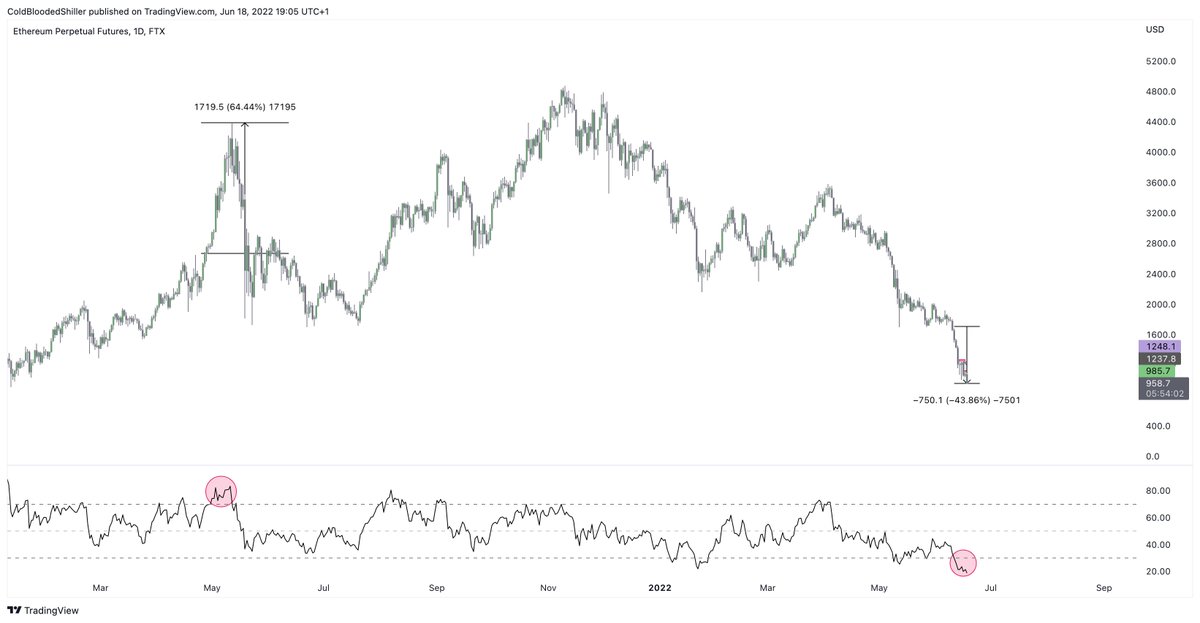
3. The most important level on the RSI is actually the 50 level
This is the mid point and trading above/below the 50 level represents continuation/break of the trend and therefore momentum in that market direction
ETH held above the 50 level for 2 years before losing it in '21
This is the mid point and trading above/below the 50 level represents continuation/break of the trend and therefore momentum in that market direction
ETH held above the 50 level for 2 years before losing it in '21

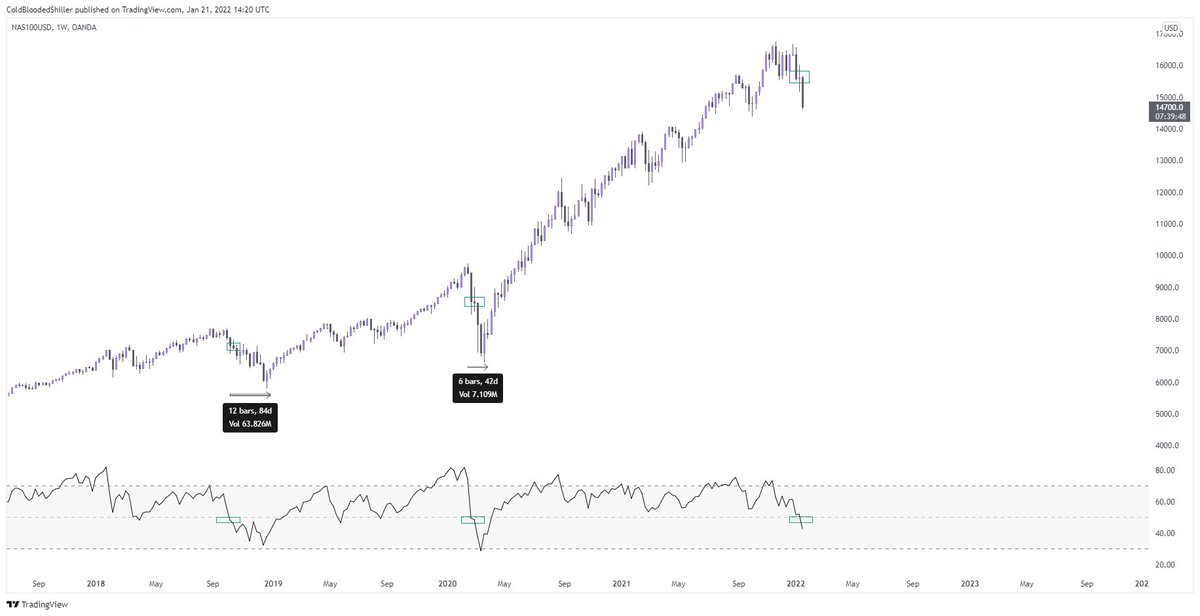
3a. You see a good example of this for identifying the top of the $NQ run (and crypto) back at the start of the year. It's a very significant marker, very simple, very easy to use to consider your risk on/off when it moves through it.

3b. The 50 level is our make or break for trends. When it's lost, especially on the HTFs it's SIGNIFICANT. It shows a clear change in the market momentum and should be appreciated as such. (See ETH above)
3c. You'll often see strong trends hit the 50 level (I call this a reset) it signifies one of the best entry points you can take into strong trends HTF.
If we hold the 50 level price continues with the trend and you have a very simply entry point. (Again see ETH 2021)
If we hold the 50 level price continues with the trend and you have a very simply entry point. (Again see ETH 2021)
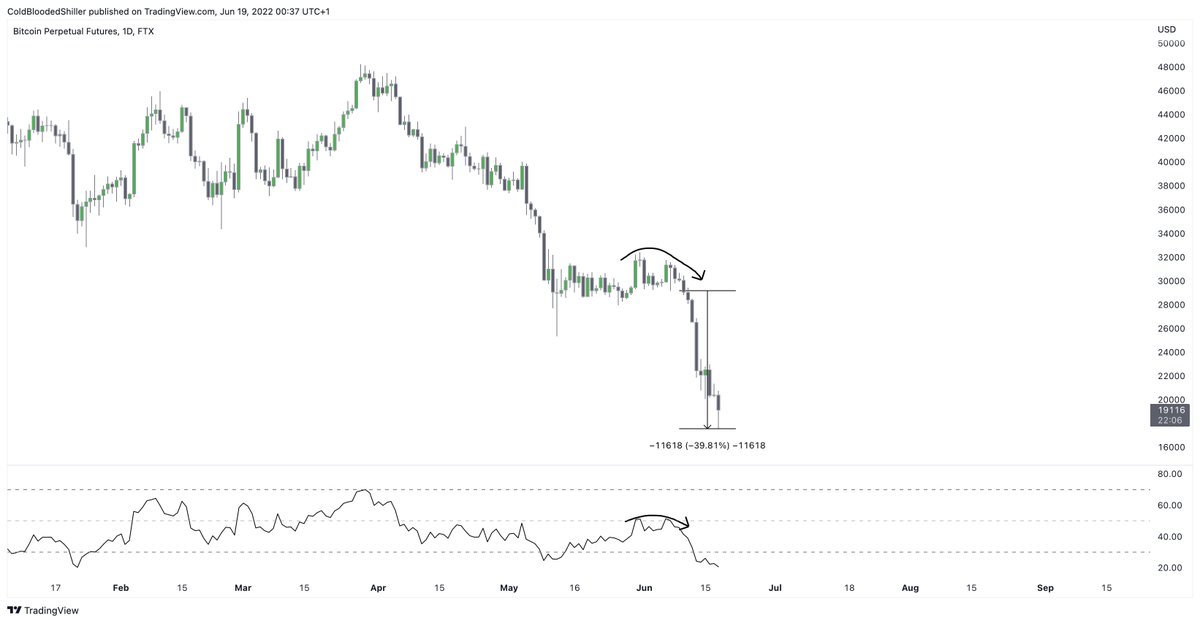
3d. The 50 level acts as a S/R for this momentum, we don't use 50 as an absolute and if it moves to 51 it's invalidated - we use some common sense around the 50 level.
Look at most markets with HTFs and note the interaction at 50. (Most recently BTC on the Daily chart)
ez huh?
Look at most markets with HTFs and note the interaction at 50. (Most recently BTC on the Daily chart)
ez huh?
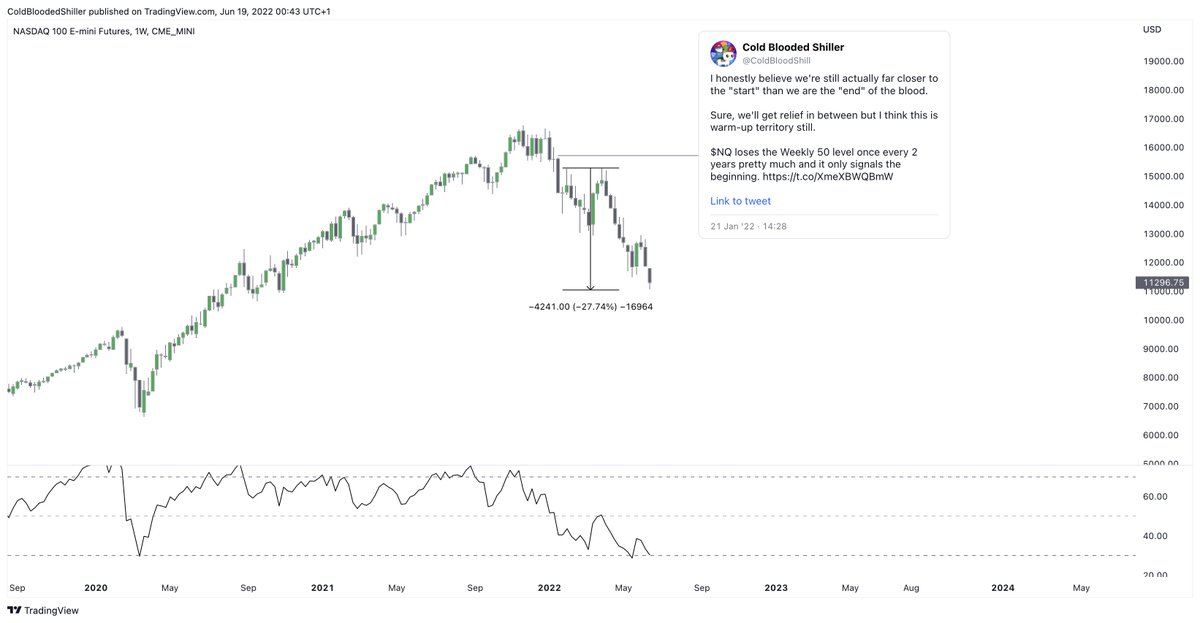
Oh and one more just for fun with the $NQ Weekly rejection at 50.
4. Divergences are strongest when they occur in the extremes and when they are <14 candles in length.
RSI by default has a 14 period lookback range which is why we use this data as a simple way to ensure we're not producing outrageous divergences that don't match the data.
RSI by default has a 14 period lookback range which is why we use this data as a simple way to ensure we're not producing outrageous divergences that don't match the data.
5. RSI is a supporting tool that can help you better time entries IN CONJUNCTION with basic TA practices such as support/resistance.
Our horizontal levels always take priority vs RSI.
Our horizontal levels always take priority vs RSI.
6. Always expect your divergences to fail. When using RSI you will be positioning counter-trend a lot. Assume your potential divergence will fail and let the market prove to you that it's doing it's best to stick it.
Enter when you have significant evidence of strength.
Enter when you have significant evidence of strength.
6b. HTF divergences take a long time to form and then to play out. Most traders will not survive this length of time or the volatility.
Manage your risk (especially as you'll be in the face of the prevailing macro trends)
Manage your risk (especially as you'll be in the face of the prevailing macro trends)
6c. HTF divergences (primarily the Weekly) have the ability to give indication of macro trend changes.
Divergences on the Daily are very good for a very strong bounce without changing macro direction.
Divergences on the Daily are very good for a very strong bounce without changing macro direction.
6d. You can use the domino effect to position into divergences early.
EG. Notice a Daily divergence forming. Check 4h chart, see a 4h divergence confirmed. Enter position from 4h with expectation the bounce confirms the Daily divergence and you can ride the trade longer.
EG. Notice a Daily divergence forming. Check 4h chart, see a 4h divergence confirmed. Enter position from 4h with expectation the bounce confirms the Daily divergence and you can ride the trade longer.
RSI is one of the indicators recommended to most new traders. It's so poorly used and gets an awful representation as a result.
The real lesson in this is to understand whatever indicator you are using inside and out, not just expecting it to provide miracle signals for you.
The real lesson in this is to understand whatever indicator you are using inside and out, not just expecting it to provide miracle signals for you.
RSI is one of the most simple, effective and useful indicators for telling you market momentum, "check your bias" points, swing positioning and when to join a trending market.
I hope this was helpful.
I hope this was helpful.
I provide all of my educational content, videos, livestreams and general chat @TheHavenCrypto along with 4 other wonderful analysts, if you'd like use these conditions to improve your trading, check it out.
Loading suggestions...