

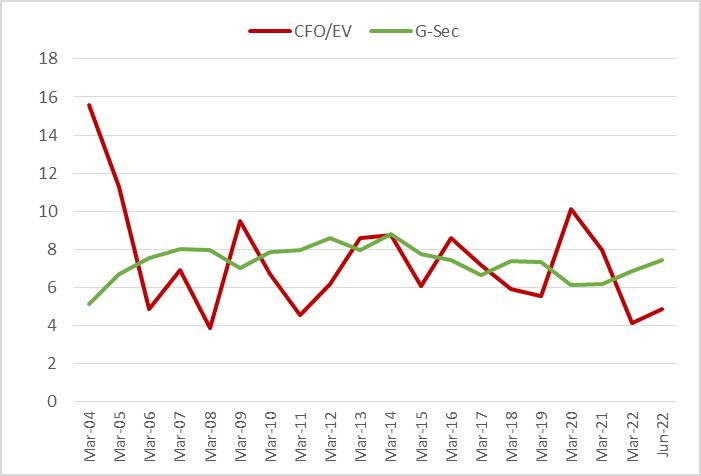
Table of small-cap earnings yield as measured by their cash flow from operations divided by enterprise value and g-sec below. The difference between earnings yields and g sec has been negative for 11 out of 19 observations. (1/9)

9 out of these 11 observations, the small-cap index has returned negative the following financial year. True to this, FY23 so far has been negative 17%. It is unlikely that we see a runaway rally in small-cap index with such a huge negative differential between earnings & gsec

Even if gsec yields were to come down to Mar 2004 levels of 5.1%, we will still have a negative differential with current small-cap earnings yield of 4.8%.
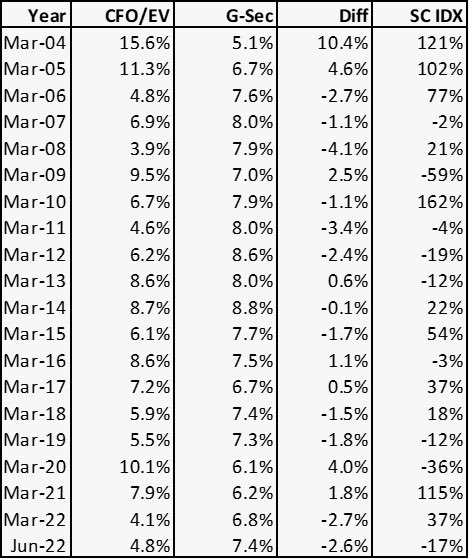
Notice the years in which small-cap index returned 100%+. It was always preceded by positive yield differential of at least 2%.

Sharp jump in yields have happened due to market crash. Notice yields of Mar 09 over Mar 08 and Mar 20 over Mar 19. Sometimes a big crash is more desirable as it is always followed by a bumper year while corrections such as the current one are more of a drag
As cliched as it may sound Fy23 and Fy24 could turn out to be great ‘years of stock picking’ but bad from optics point of view. ‘Arre yaar FD better than equity’ types
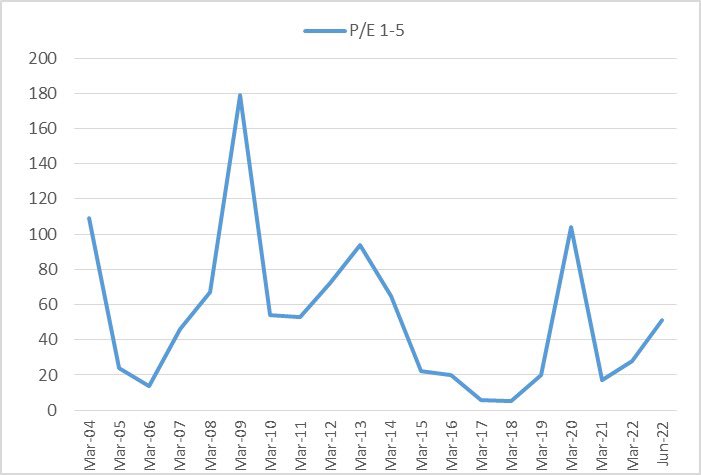
The number of stocks between 1 and 5 pe in the small-cap universe has definitely come off lows after the recent fall but nowhere close to say levels seen in 2012. Forget 2009 and 2020.
Current negative yield differential similar to Mar 11, Mar 12 period
The same set of charts as of June 2020 when small-caps looked like low full toss ball waiting to be hit for a six. (9/9)
Loading suggestions...