

How did the Fed fall behind the curve last year?
We interviewed current and former Fed officials and outside analysts and came up with four mistakes.
Each compounded on the others because they were wrong in the same direction.
A thread:
1/ wsj.com
We interviewed current and former Fed officials and outside analysts and came up with four mistakes.
Each compounded on the others because they were wrong in the same direction.
A thread:
1/ wsj.com
First, some context:
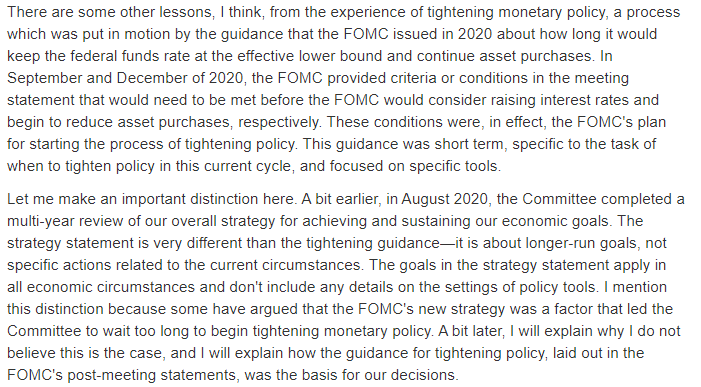
Officials had laid out a new, slightly more ambitious framework in August 2020 that would try to lessen the hazards of being out of ammo when rates were cut to zero. To do this, officials committed to keeping rates lower for longer after a downturn.
2/
Officials had laid out a new, slightly more ambitious framework in August 2020 that would try to lessen the hazards of being out of ammo when rates were cut to zero. To do this, officials committed to keeping rates lower for longer after a downturn.
2/
Fed governor Christopher Waller explained in two speeches recently that the strategy change wasn't the problem, per se, but rather what followed next
That is, the way the Fed operationalize it would cause headaches that seemed unlikely at the time federalreserve.gov
3/
That is, the way the Fed operationalize it would cause headaches that seemed unlikely at the time federalreserve.gov
3/
Specifically, the Fed committed to keep policy rates at zero until they achieved maximum employment
This caused problems because estimating that zone is difficult in normal times but especially last year. In June, the unemployment rate was 5.9%.
By December, it was 3.9%.
4/
This caused problems because estimating that zone is difficult in normal times but especially last year. In June, the unemployment rate was 5.9%.
By December, it was 3.9%.
4/
“That probably led to a little bit of delay” in raising rates, Chicago Fed President Charles Evans told reporters last month
In hindsight, it may have forced the Fed to tolerate more inflation risk to prove the new framework was credible
5/
In hindsight, it may have forced the Fed to tolerate more inflation risk to prove the new framework was credible
5/
Second, the Fed didn’t much react to the Biden administration’s $1.9 trillion in stimulus/relief spending in March 2021, even though this amount was well beyond what Fed staff economists had been anticipating that year, according to minutes of contemporaneous policy meetings
6/
6/
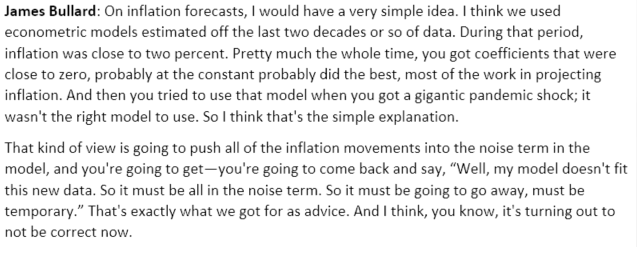
Third, the entire econ profession had a hard time forecasting inflation amid myriad supply and demand shocks in 2021
Many forecasters use some form of an “expectations-augmented Phillips curve,” which is calibrated to the past few decades' performance
7/
Many forecasters use some form of an “expectations-augmented Phillips curve,” which is calibrated to the past few decades' performance
7/
St. Louis Fed president James Bullard explained the challenges of inflation forecasting with these models at a recent conference.
In short, a lot of the initial increase in prices was dismissed as noise because it couldn't be explained by the model
8/
In short, a lot of the initial increase in prices was dismissed as noise because it couldn't be explained by the model
8/
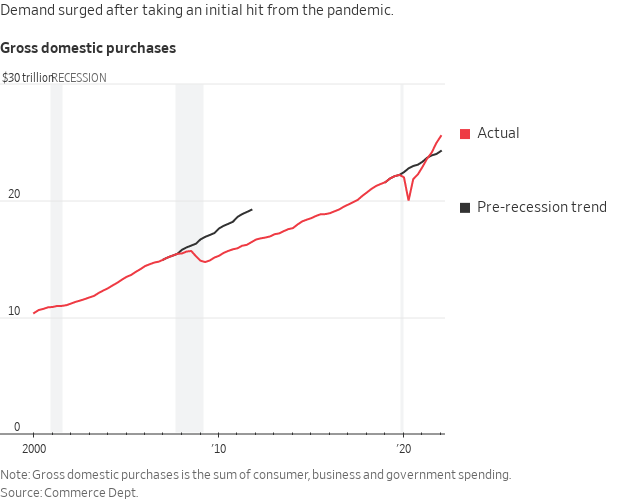
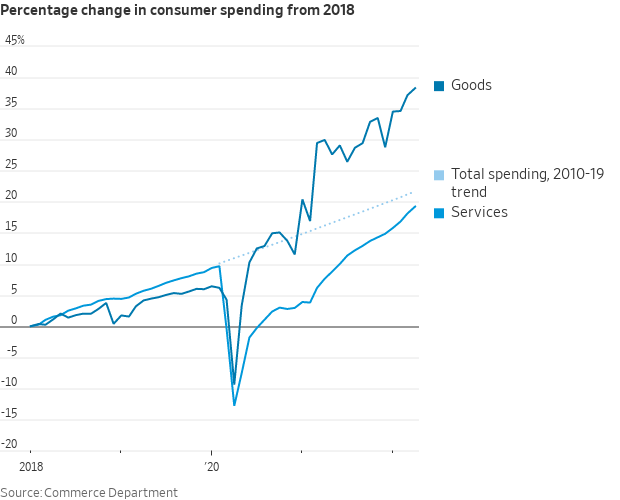
Moreover, there wasn’t just a big increase demand, but also a shift in the composition of spending, towards goods and away from services, that led to more extreme price increases
9/
9/
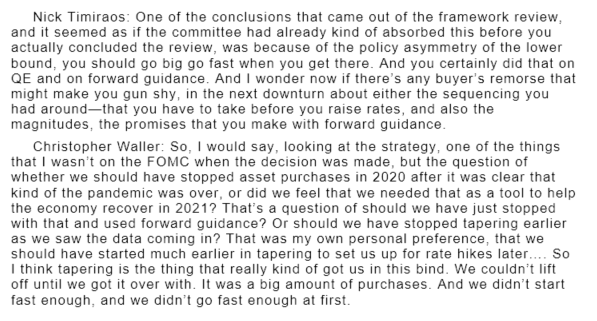
Fourth, officials were skittish about a re-run of the 2013 “taper tantrum,” which added more inertia.
There was the meeting to talk about talking about tapering, and then the one to have the discussion, and then the meeting to decide, then the meeting to announce, etc.
10/
There was the meeting to talk about talking about tapering, and then the one to have the discussion, and then the meeting to decide, then the meeting to announce, etc.
10/
Most central banks have faced similar challenges.
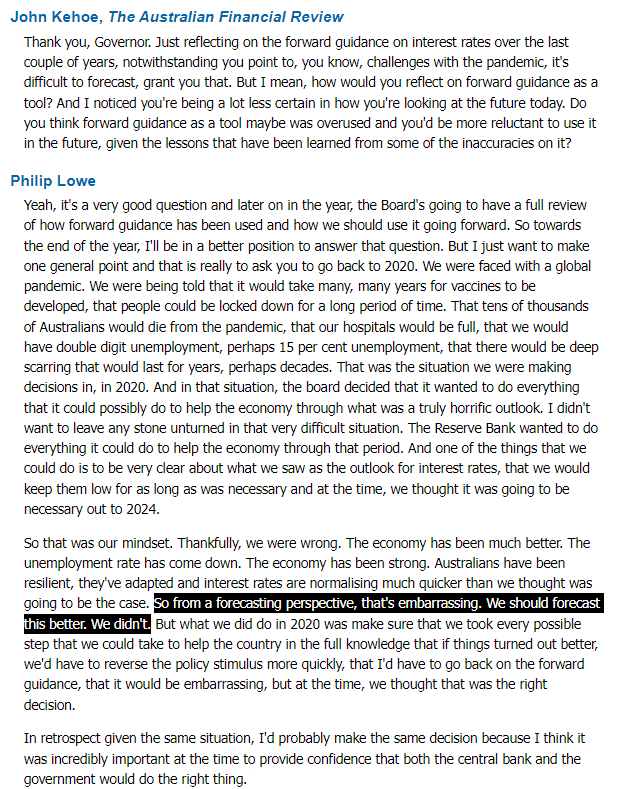
Australia's central bank, which until last fall planned to keep rates near zero until 2024 because it expected inflation to stay low, just raised them from zero last month
Consider this exchange from governor Philip Lowe
11/
Australia's central bank, which until last fall planned to keep rates near zero until 2024 because it expected inflation to stay low, just raised them from zero last month
Consider this exchange from governor Philip Lowe
11/
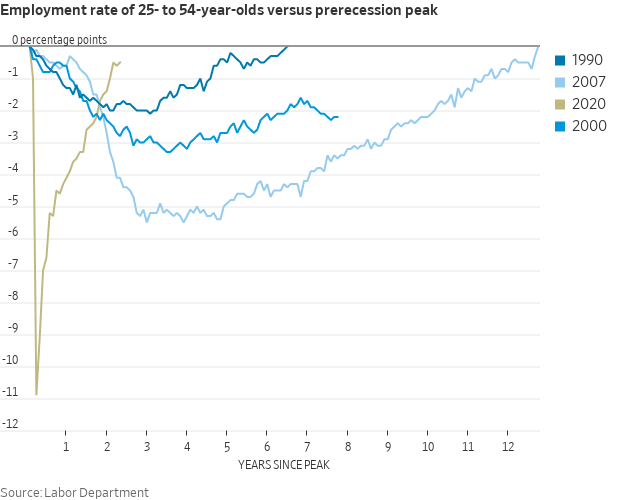
Finally, as our story notes, policymakers were largely focused on avoiding the mistakes and heeding the lessons of the recent past.
This chart, on the shortfall in employment rates for 25-to-54 year olds, tells much of the story wsj.com
12/
This chart, on the shortfall in employment rates for 25-to-54 year olds, tells much of the story wsj.com
12/
Loading suggestions...