

1/10
$BTC It's time for a "spot the bottom" tweet. 🧵
Technical Analysis means you can use historical data to extrapolate future price action and identify the current trend to a certain level of accuracy.
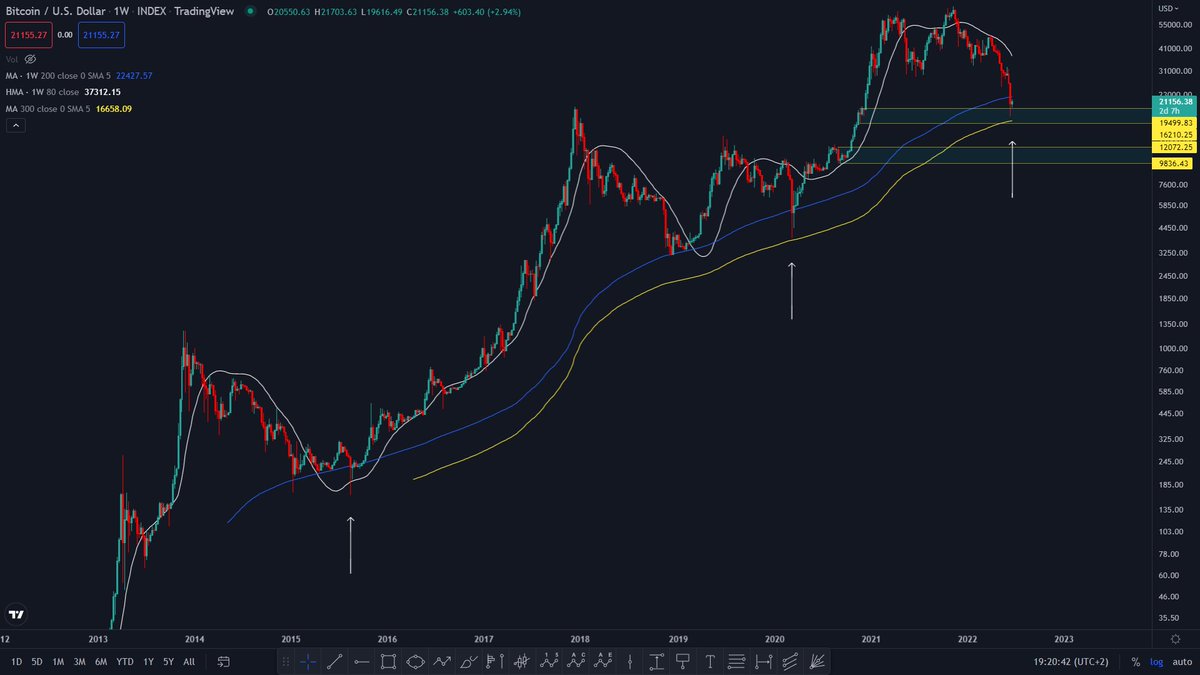
First chart is to show what price areas I primarily look at as a bottom.
$BTC It's time for a "spot the bottom" tweet. 🧵
Technical Analysis means you can use historical data to extrapolate future price action and identify the current trend to a certain level of accuracy.
First chart is to show what price areas I primarily look at as a bottom.

2/10
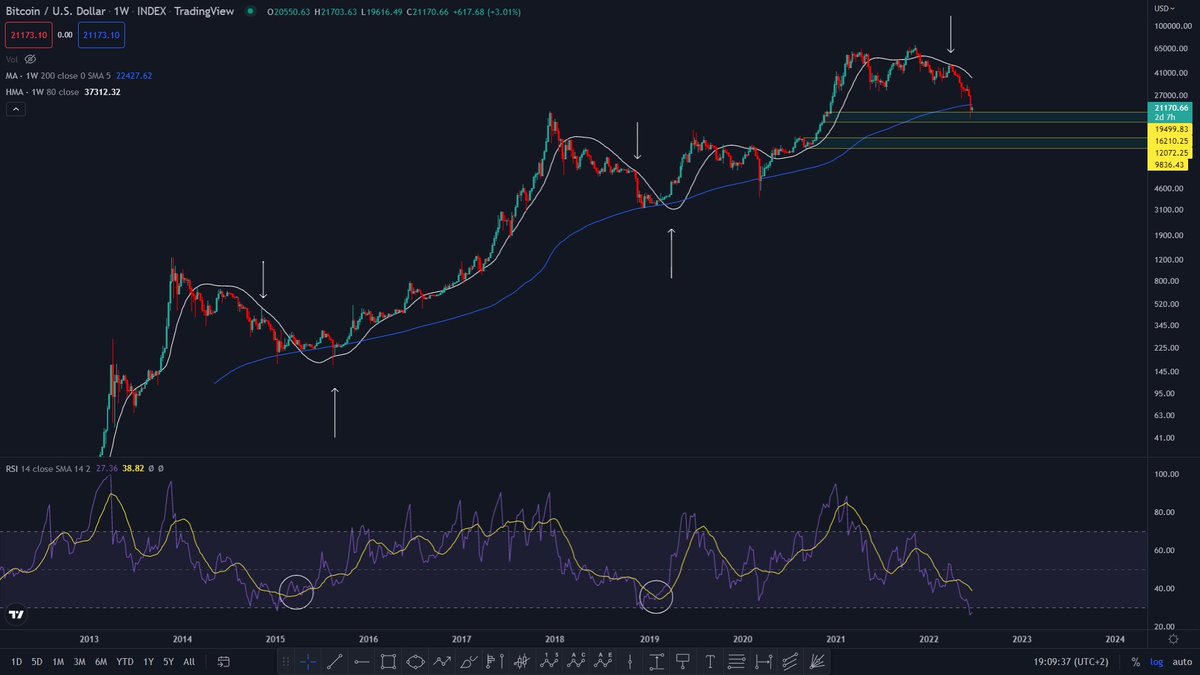
These are the Hull Moving Average (80) and the Regular Moving average (200). @FSgura taught me to use HMA to identify Bull and Bear markets quicker. Any price action above we consider bull and any price below we consider bear. Occasionally you will see some fake outs.
These are the Hull Moving Average (80) and the Regular Moving average (200). @FSgura taught me to use HMA to identify Bull and Bear markets quicker. Any price action above we consider bull and any price below we consider bear. Occasionally you will see some fake outs.

3/10
I'm looking at historical data to find similarities.
1. After a bulltrend BTC loses HMA and retests it. The second time it retests bearish BTC crashes.
2. BTC crashes towards the 200MA.
3. BTC consolidates on/near MA until HMA catches up.
4. HMA crosses below + above MA.
I'm looking at historical data to find similarities.
1. After a bulltrend BTC loses HMA and retests it. The second time it retests bearish BTC crashes.
2. BTC crashes towards the 200MA.
3. BTC consolidates on/near MA until HMA catches up.
4. HMA crosses below + above MA.

4/10
3/n are 'signals' we can look for using this method.
The moment BTC crosses back above the HMA we can consider the beartrend to be over based on the data from 2018 and 2015. @FSgura uses the 104 HMA, but I'm less conservative. However this means its a riskier play.
3/n are 'signals' we can look for using this method.
The moment BTC crosses back above the HMA we can consider the beartrend to be over based on the data from 2018 and 2015. @FSgura uses the 104 HMA, but I'm less conservative. However this means its a riskier play.
5/10
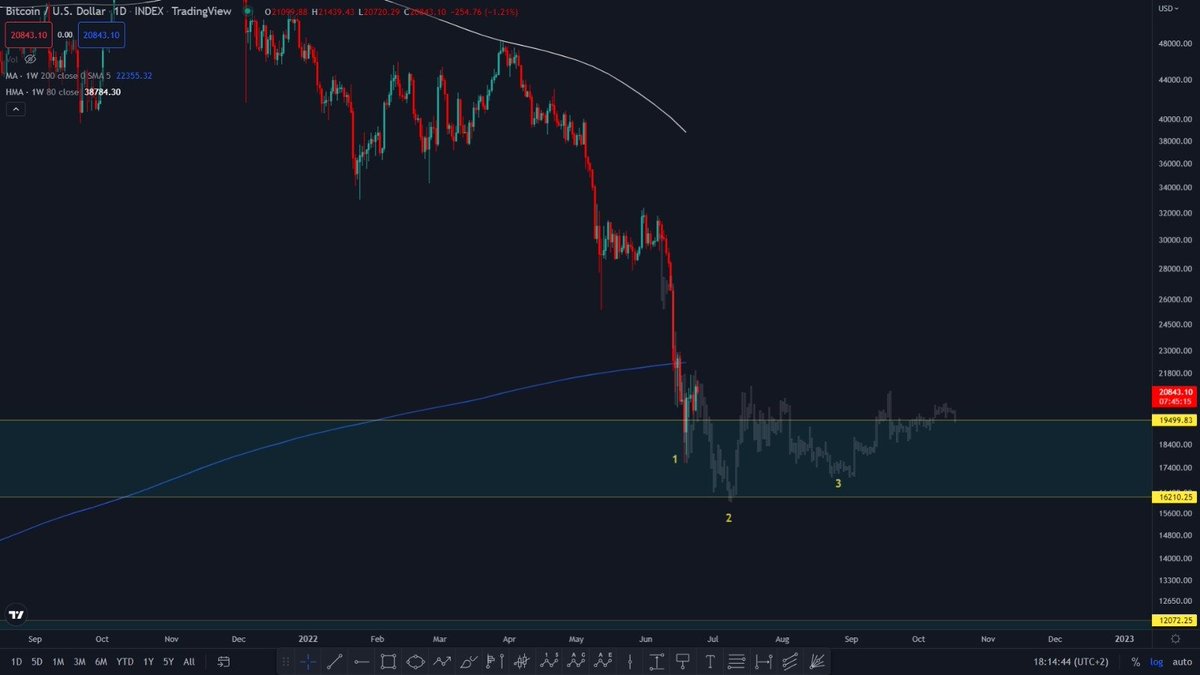
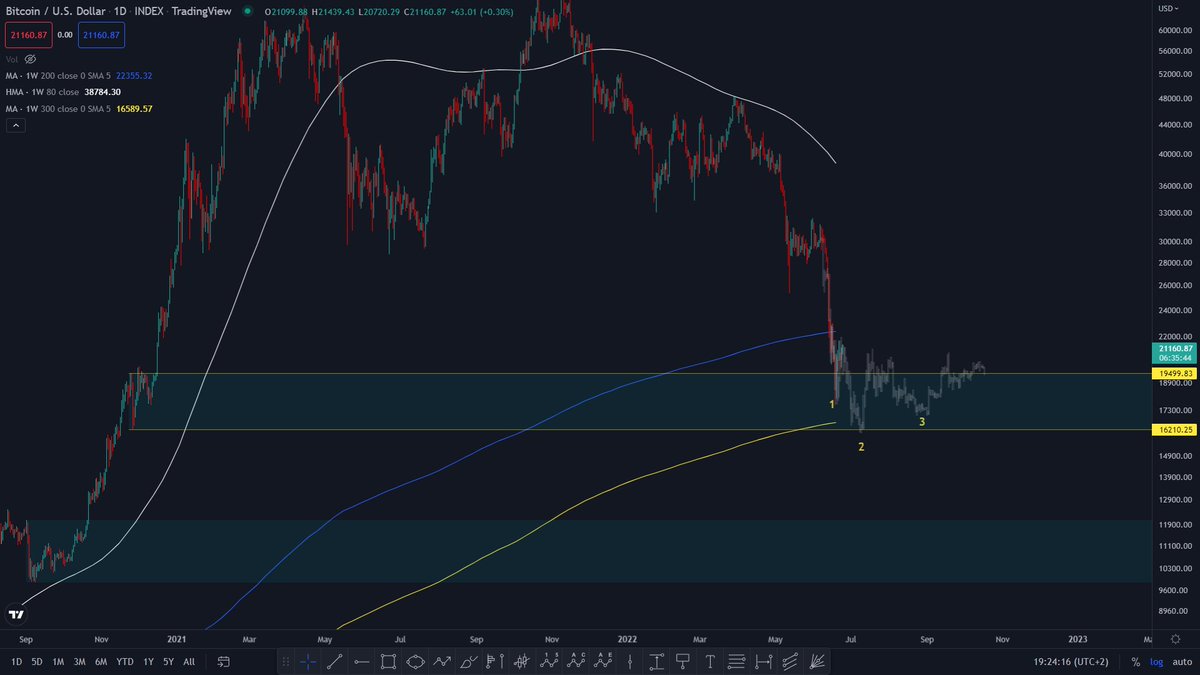
On the daily timeframe we also see similarities. I copied the 2018 price data to show we could be nearing the bottom. Datapoint 1 is so similar to what we see now. Reasons why this could be the bottom:
1. HMA catching up.
2. BTC on/near 200 MA.
3. BTC within demand zone.
On the daily timeframe we also see similarities. I copied the 2018 price data to show we could be nearing the bottom. Datapoint 1 is so similar to what we see now. Reasons why this could be the bottom:
1. HMA catching up.
2. BTC on/near 200 MA.
3. BTC within demand zone.

6.1/10
I use very little indicators, because you use them only to verify price action. Now we will look at RSI.
On the weekly chart you see BTC is 'oversold'. This is not yet a buy signal. It could be one when we cross back above 30. Also it hasn't crossed back above the RSI MA
I use very little indicators, because you use them only to verify price action. Now we will look at RSI.
On the weekly chart you see BTC is 'oversold'. This is not yet a buy signal. It could be one when we cross back above 30. Also it hasn't crossed back above the RSI MA
6.2/10
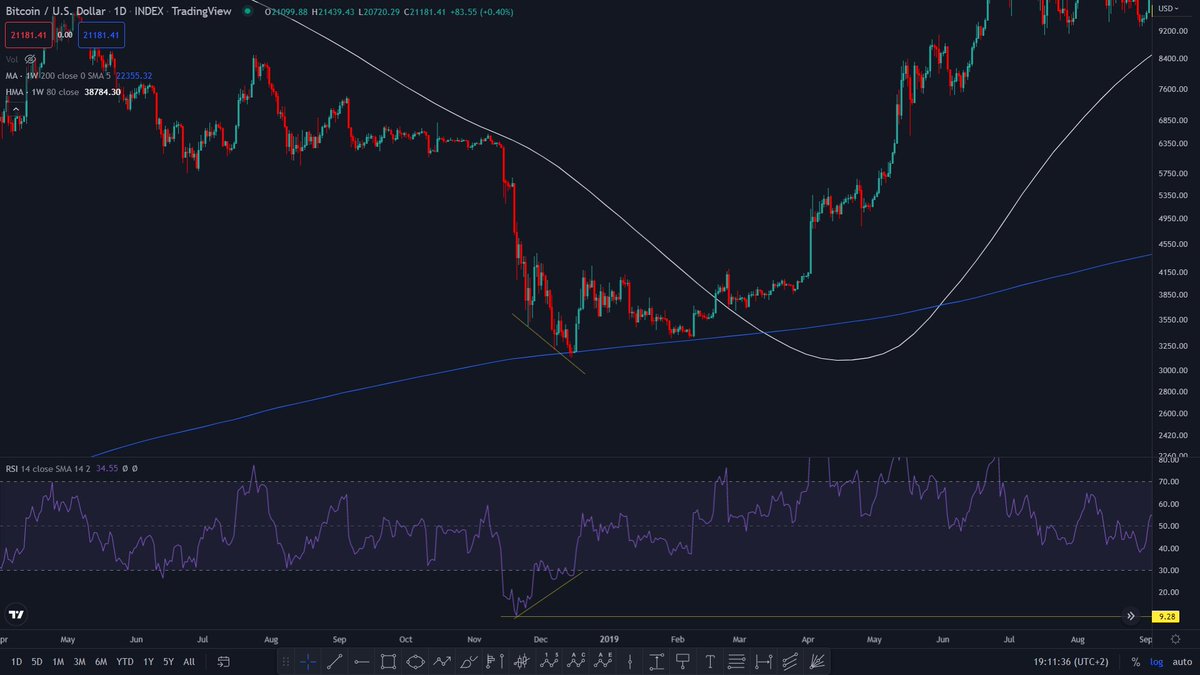
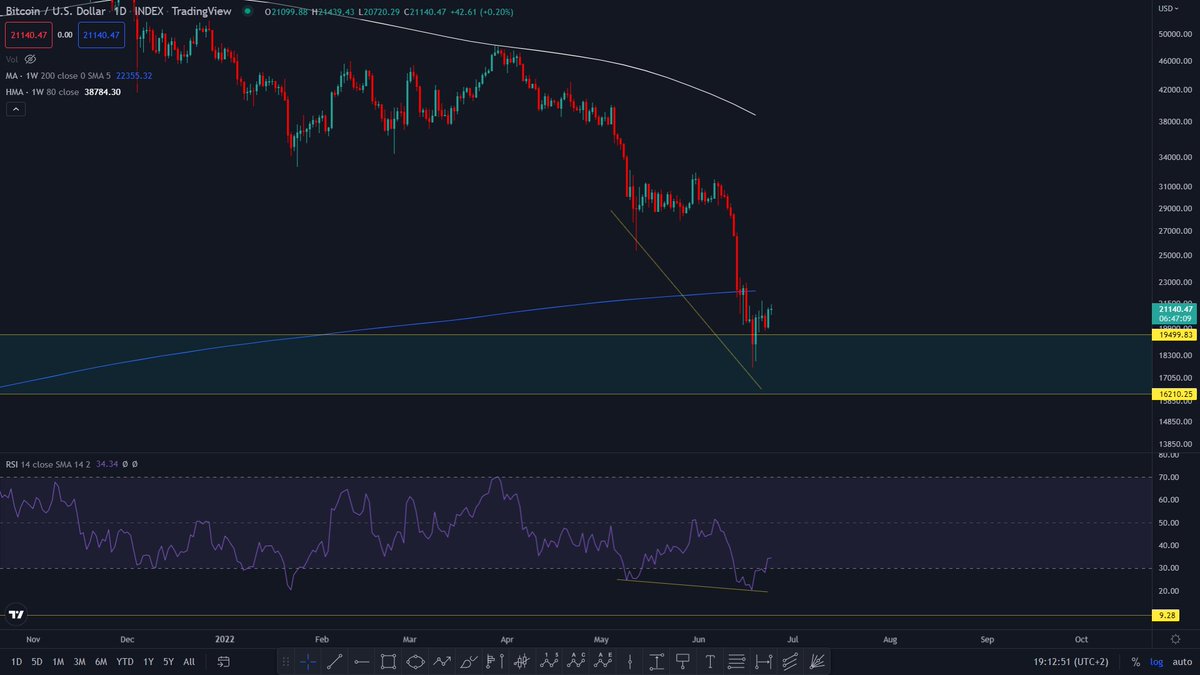
The current daily chart doesn't show any sign of reversal yet. What I'm looking for is a bullish reversal divergence on the RSI just like in 2018. I want RSI to dip sub30 make the divergence and come back above.
Also you see very clearly we are retesting 200 MA.
The current daily chart doesn't show any sign of reversal yet. What I'm looking for is a bullish reversal divergence on the RSI just like in 2018. I want RSI to dip sub30 make the divergence and come back above.
Also you see very clearly we are retesting 200 MA.
7/10
The 300 MA is rarely used but BTC has some history with it. In 2015 BTC had too little data for the 300 WMA. However extending that line would probably make it touch the second wick. The same applies to 2018. The difference now? The first low is now close to tapping 300WMA.
The 300 MA is rarely used but BTC has some history with it. In 2015 BTC had too little data for the 300 WMA. However extending that line would probably make it touch the second wick. The same applies to 2018. The difference now? The first low is now close to tapping 300WMA.
8/10
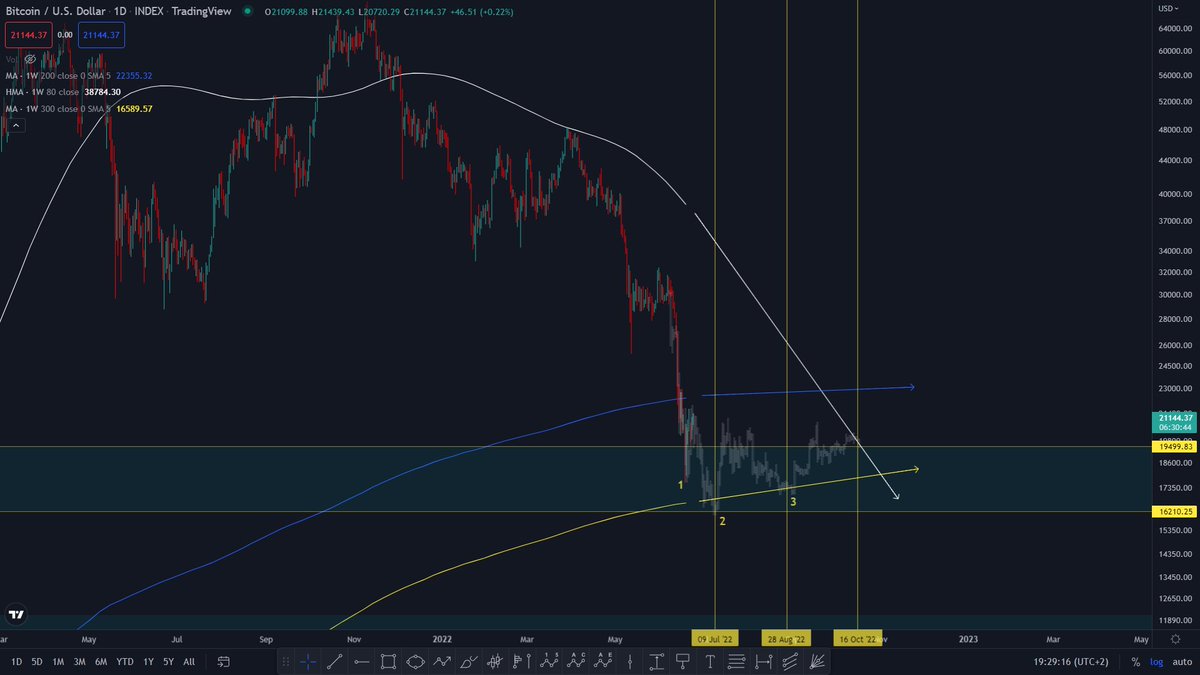
If we zoom in on the daily chart using the 2018 fractal and the 300 WMA we see this. It all comes together!
TA is more than looking at price. It's also looking at TIME! I added some 2018 fractal based timelines so we have a timeframe to (in)validate the theory.
If we zoom in on the daily chart using the 2018 fractal and the 300 WMA we see this. It all comes together!
TA is more than looking at price. It's also looking at TIME! I added some 2018 fractal based timelines so we have a timeframe to (in)validate the theory.
9/10 Conclusion
1. High probabilty we are close to bottoming out. Niagara fall seems to have stopped and is now turning into a river.
2.Historically speaking we never closed below 300WMA.
3. 1D and 1W RSI show no reversal signs yet.
4. BTC is in retest mode of 200WMA.
1. High probabilty we are close to bottoming out. Niagara fall seems to have stopped and is now turning into a river.
2.Historically speaking we never closed below 300WMA.
3. 1D and 1W RSI show no reversal signs yet.
4. BTC is in retest mode of 200WMA.
9.2/10 Conclusion
5. BTC is in demand zone. Failure to hold 16k-19k means we will likely drop down to 10k-12k.
Don't forget to like, retweet and follow!!
And do tell me:
Where do you think the bottom lies?
Did we already tapped the bottom?
Are we going lower or BULL?
👇👇
5. BTC is in demand zone. Failure to hold 16k-19k means we will likely drop down to 10k-12k.
Don't forget to like, retweet and follow!!
And do tell me:
Where do you think the bottom lies?
Did we already tapped the bottom?
Are we going lower or BULL?
👇👇
10/10 Disclaimer:
1. FA, Onchain and Macro Economic analysis were not included in this thread.
2. Not Financial advice. Rather Edutainment.
3. And yes, this time it could be different!
1. FA, Onchain and Macro Economic analysis were not included in this thread.
2. Not Financial advice. Rather Edutainment.
3. And yes, this time it could be different!
@UnrollHelper please unroll
Loading suggestions...