

The following thread will be an in-depth guide on Supply & Demand, what it is, and how to apply it to your trading: ⬇️

If you haven't seen my other Supply & Demand threads, here they are: Pt.1
Pt.2
Pt.3
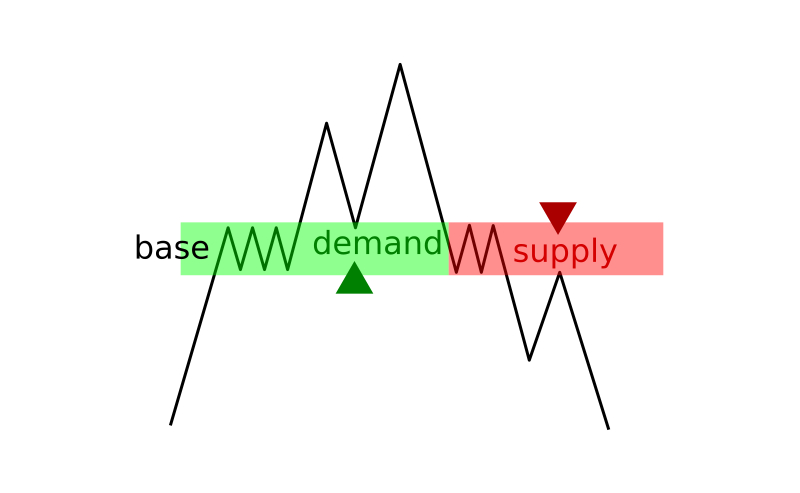
Supply & Demand Zones are areas within a chart, created by an imbalance between buyers and sellers, that create reversals in either direction. Below are a few examples of what they look like: ⬇️
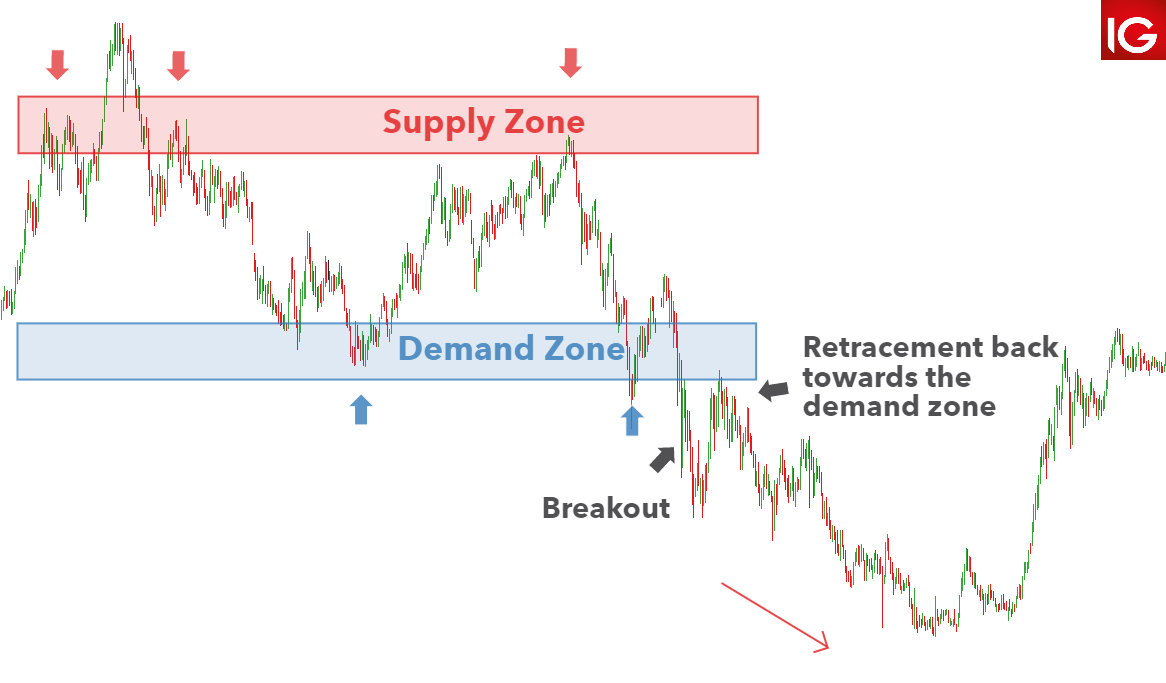

An imbalance between buyers and sellers simply means that they are going back and forth and fighting for control over the direction of the stock. These zones are created when buyers take control from sellers, or vice versa. This is how a change in trend occurs.
These zones are not created by retail traders, but rather from large institutions or big money market players who have the ability to affect the price of a stock. The imbalances created from big money leave unfilled orders within these S&D zones.
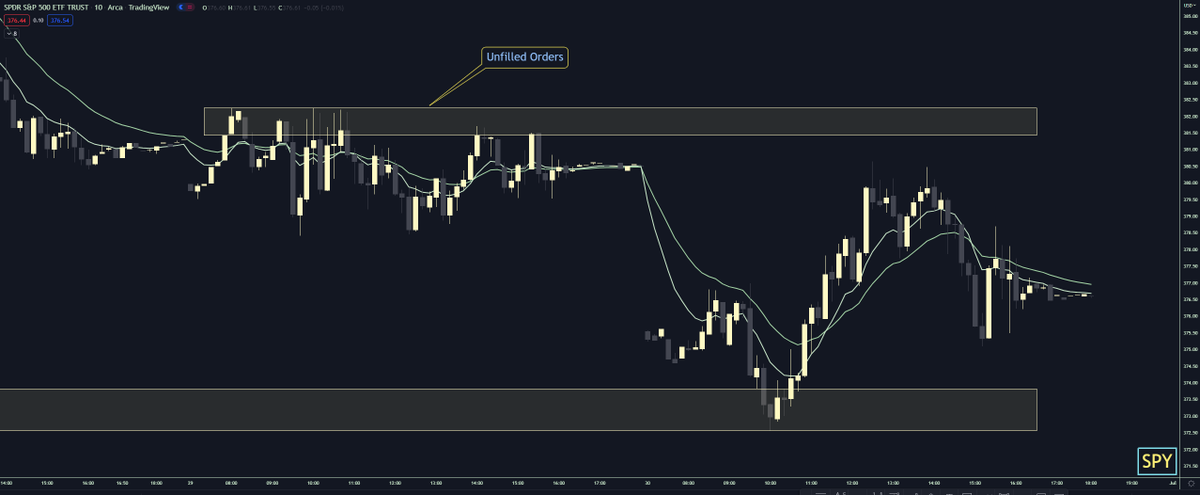
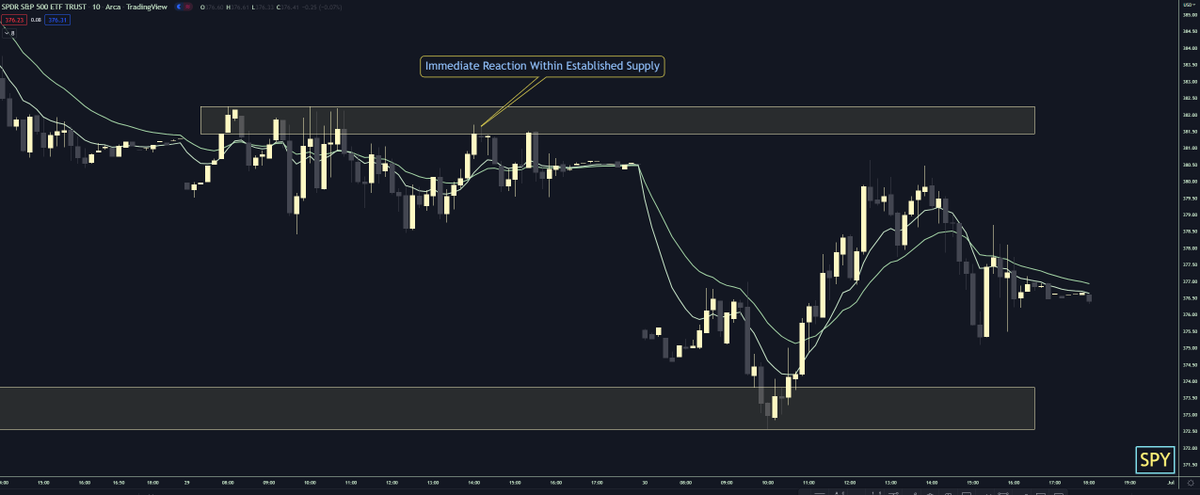
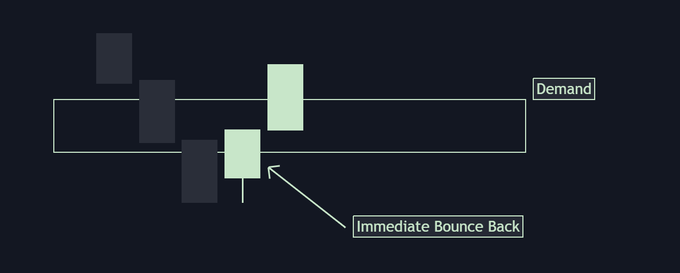
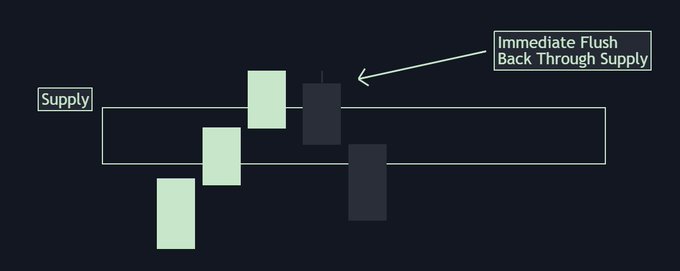
By having unfilled orders within these zones, this makes them extremely valuable when looking to go long or short at these levels. The reason being is that quite often you will have an immediate reaction when price enters either a Demand or Supply zone.
So, lets now go over how we draw these zones. Drawing these zones will differ from person to person, and they will never be exact. I personally use the 4hr, 30m, 10m, & 5m to draw zones, and am going from the start of the wick to the body of the initial move that created the zone
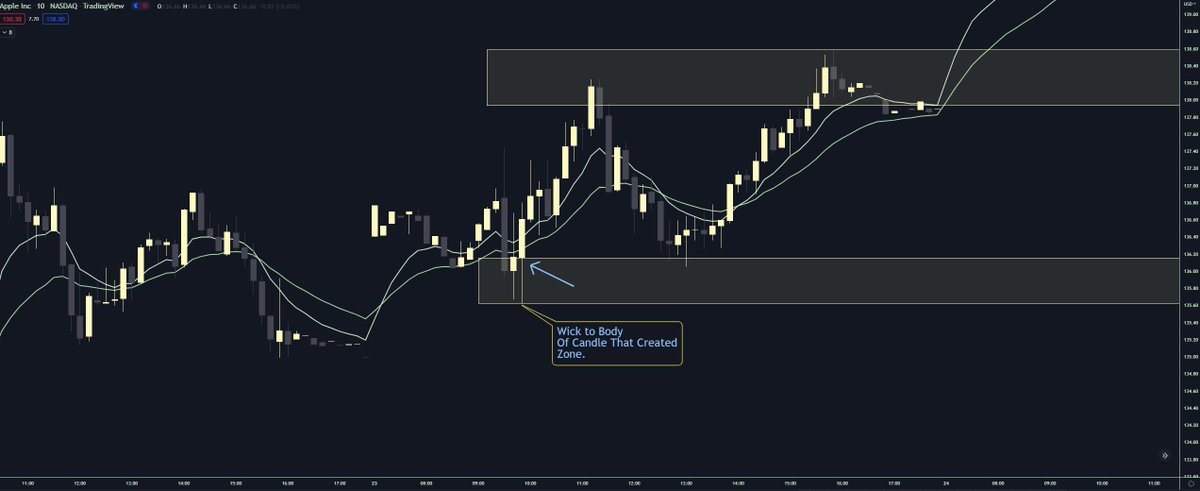
It is extremely important however our zones are not too big or too small. To find a relative range of your zones, i take 1/8th to 1/10th of what any given stocks daily ATR is. If $SPY moves $10 a day for example, your zone would want to be around 1-2$.
Sometimes there are exceptions where you have a zone that is bigger or smaller, but most of the time you should be able to get an accurate zone using the ATR, and going wick to start of body.
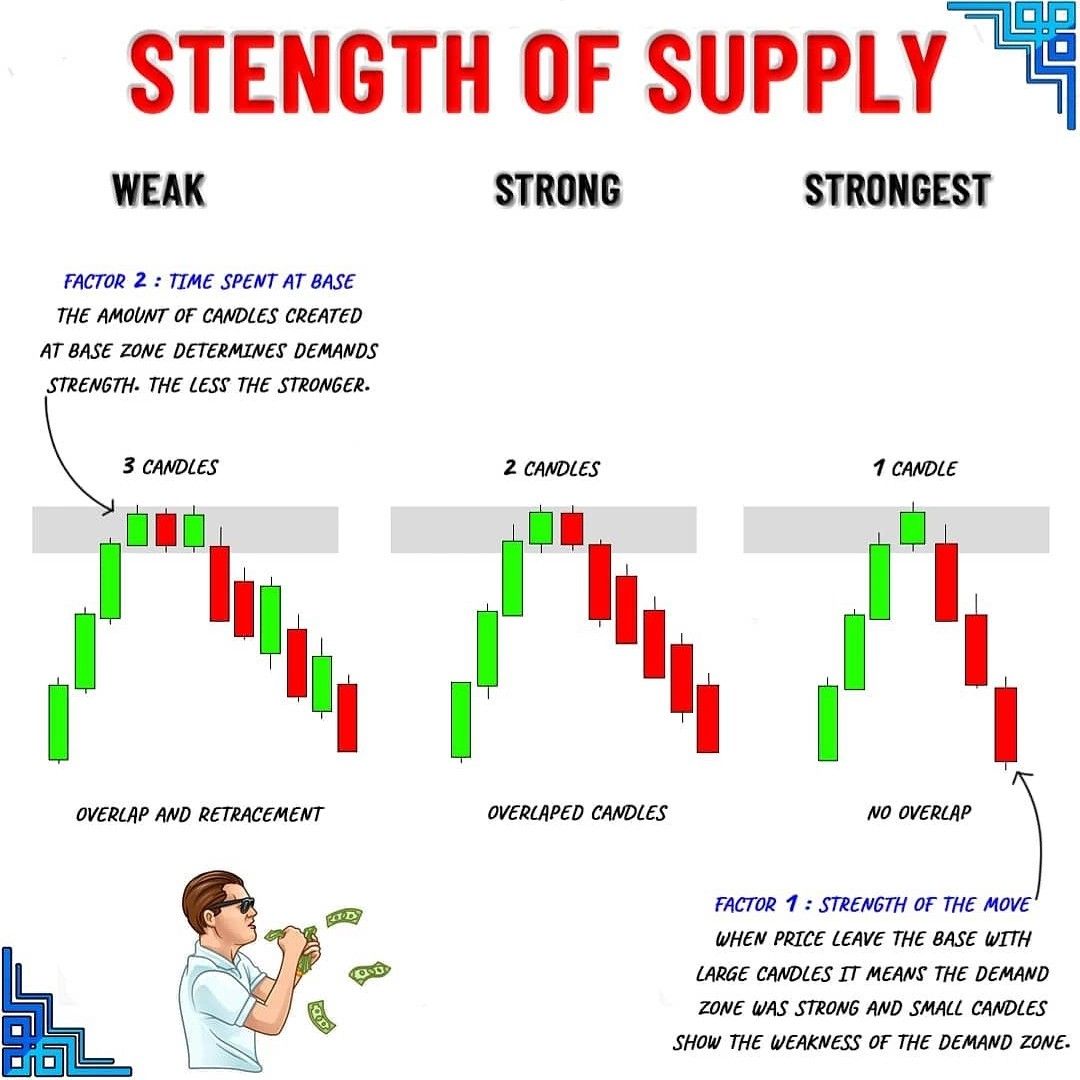
Now this brings us to Strength of Zones. Each zone is created different meaning that one may be much stronger than the other depending on Volatility of Creation, & Time Spent Within Zone during first few interactions.

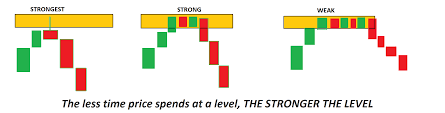
It is extremely important to know that the less amount of time spent within a zone, the stronger it is. The more time spent within a zone (consolidation) the weaker that zone is or has become. Also, the more interactions within a single zone, the weaker it will become.
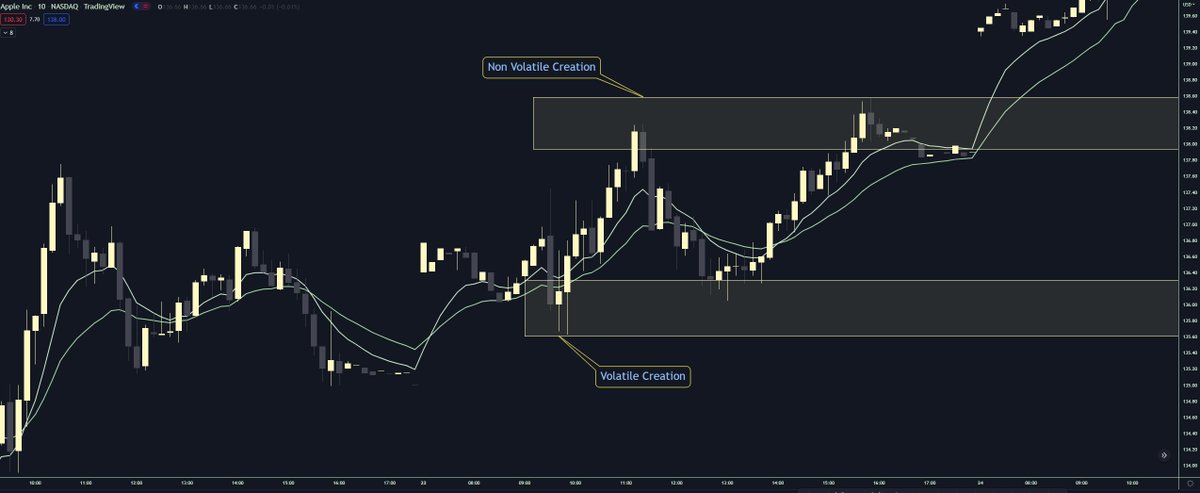
Volatility of Creation refers to the type of move that created any given Supply or Demand Zone. Some zones, like the one depicted below, are created from volatile movement within a chart. These have a higher probability of containing unfilled orders.

Other times zones will simply be created when something becomes exhausted and either buyers take control from sellers, or vice versa. These low volatility reversals will not hold as many unfilled orders.
Supply & Demand Zones are not the same as support and resistance levels. Yes they in theory are acting as areas of support and resistance, but these zones are a range not a finite number.

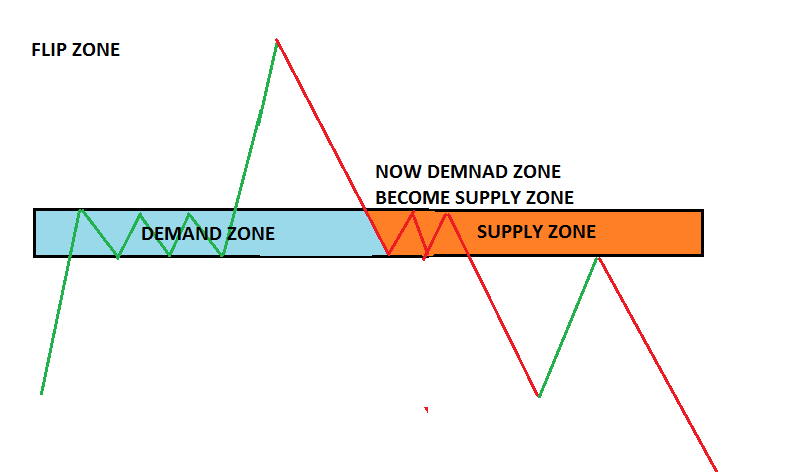
Supply & Demand Zones can also flip and become the other. When a Supply zone is broken through, it then has the chance to become Demand (Support). If a Demand zone is broken, it then has the chance to become Supply (Resistance).
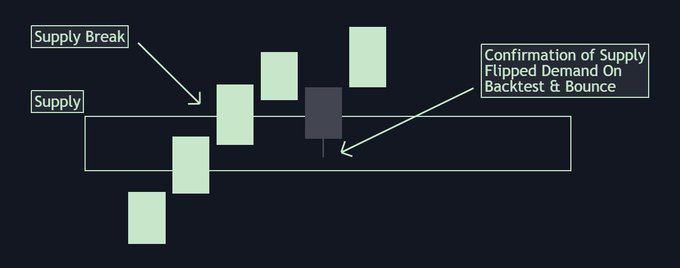
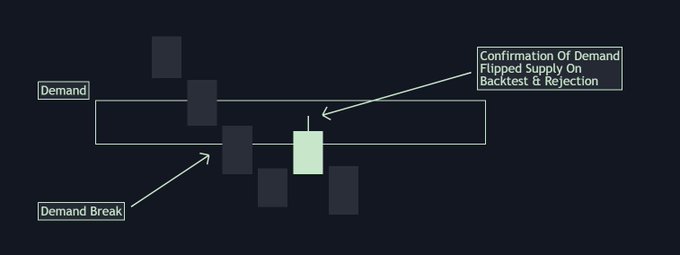
To confirm that a zone has flipped, we need to see a backtest interaction with that zone. Below are two examples, one of Supply flipping into Demand, the other is Demand flipping into Supply. These zone flips are great low risk short and long opportunities.
Sometimes when looking for zone flips, we may run into false breakouts. Below are what false breakouts of either level look like without a backtest confirming the zones have flipped. It is imperative when a zone is broken we look for backtest confirmation.
Okay so now how do we go about playing these zones? The most beginner friendly strategy of playing these zones is waiting for interaction with a zone, and waiting for a candle close out of that zone to either go long or short. Lets take a look at two examples below⬇️
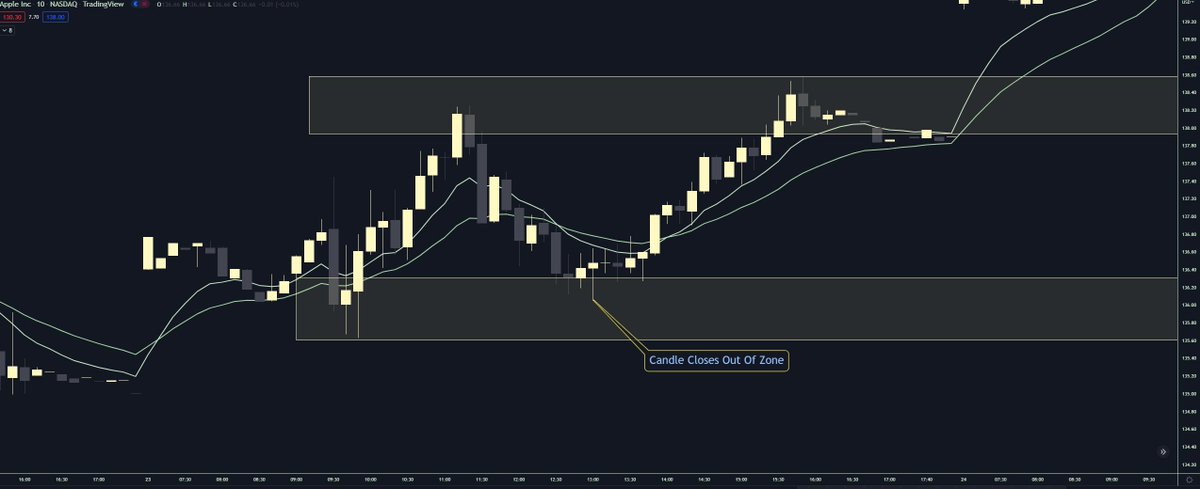
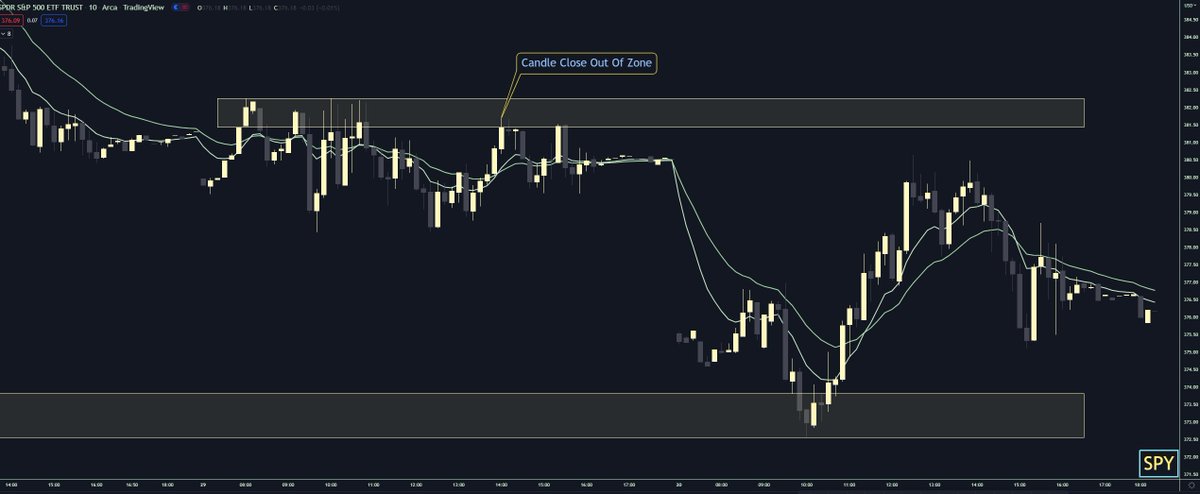
By waiting for a candle to close after interacting with a zone, it will allow us to minimize potential fakeouts. There are times when a candle may begin to move out of a zone, but either close back within the zone, or even break through the zone. We must be patient

Another strategy for playing zone interaction is bidding within the zone, or taking entry before candle closure. This is more advanced, and I would highly suggest staying away from this strategy until you are extremely confident in your own TA.
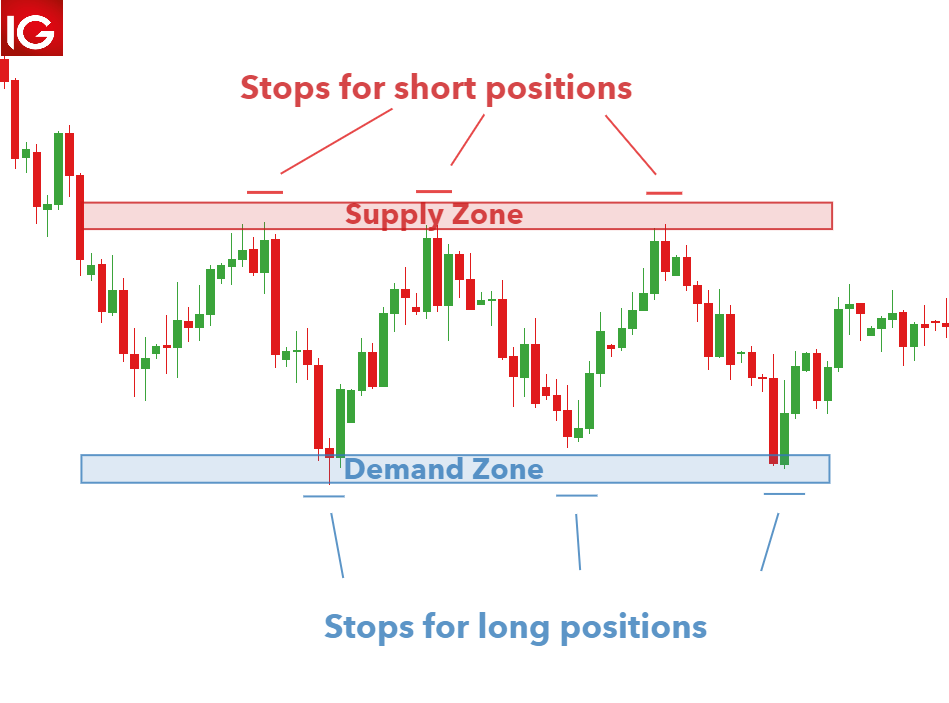
No matter what strategy you are playing, they both offer clearly defined risk. A break of either zone is where i personally place my stop loss.
As always I really hope this thread helps. I tried my best to include as much information as I could!

Loading suggestions...