

A few things will be looked back in the future when we think back on the 2020 mania.
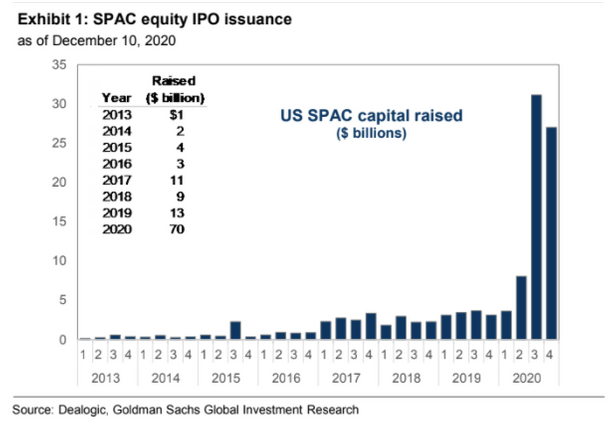
SPACS issuance:
SPACS issuance:

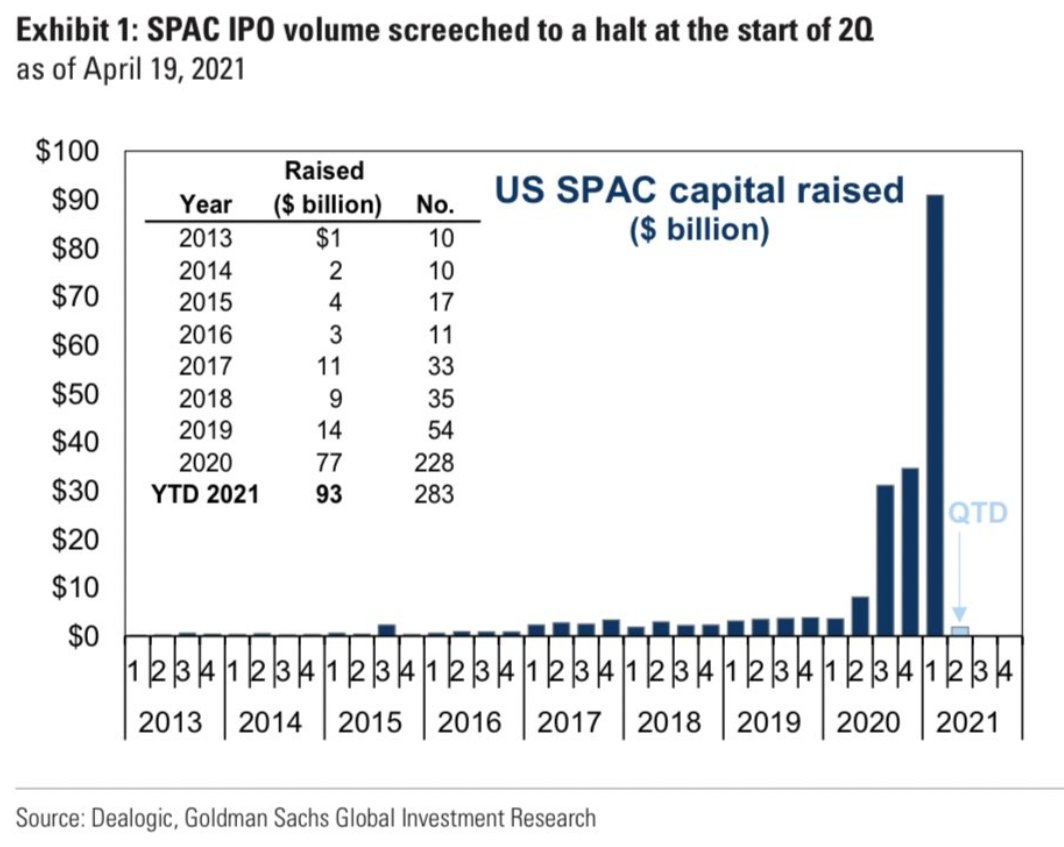
we saw a 5.5x increase in the amount raised from 2019 to 2020 but the peak got set a quarter later in q1 2021.
Q1 2021 set the top with an incredible 314 SPAC IPOs, more than in any previous annual volume.
Combined, these offerings raised a colossal US$100.3 billion, beating the entire 2020 year within a single quarter.
Combined, these offerings raised a colossal US$100.3 billion, beating the entire 2020 year within a single quarter.
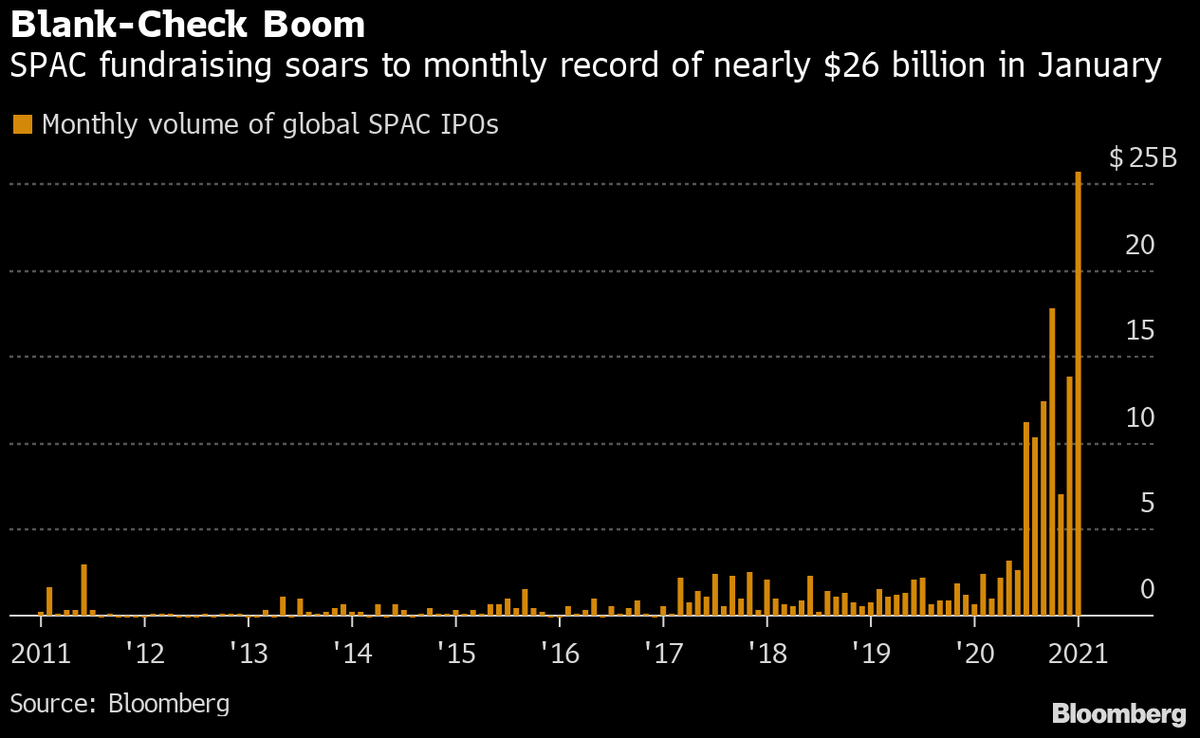
A month by month breakdown shows how quickly the QE reflected within the speculative asset class.
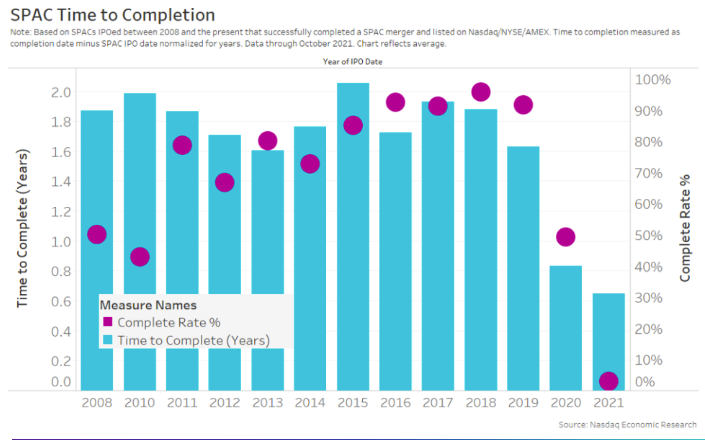
The signs were there, but how many actually managed to De-spac and become an actual company?
The signs were there, but how many actually managed to De-spac and become an actual company?
The further rates dropped, the quicker SPACs merged and got listed.
As QE kicked in first after the end of 2018 pivot but especially in march 2020, we saw an immense speculation bubble form.
40% and then 30% of SPACs managed to get listed in the end. The biggest drop ever.
As QE kicked in first after the end of 2018 pivot but especially in march 2020, we saw an immense speculation bubble form.
40% and then 30% of SPACs managed to get listed in the end. The biggest drop ever.
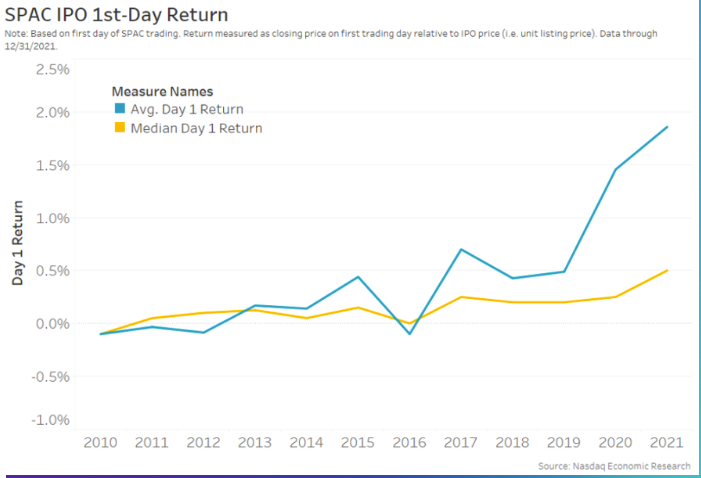
An interesting metric to reflect the speculation is the retail money that flooded the SPACs over the years.
Retail chased into the SPACs reflected by the average return on the IPO day.
SPACs were the way of the future and the bubble burst shortly after.
Retail chased into the SPACs reflected by the average return on the IPO day.
SPACs were the way of the future and the bubble burst shortly after.
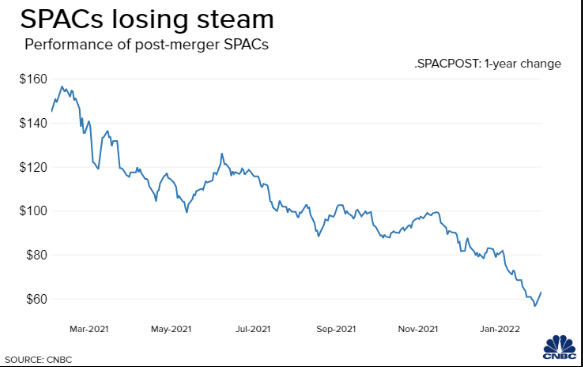
The bubble
Spaces imploded as soon as the FED stopped the flow of money, players readjusted to the new environment and speculation bubbles crashed.
Spaces imploded as soon as the FED stopped the flow of money, players readjusted to the new environment and speculation bubbles crashed.
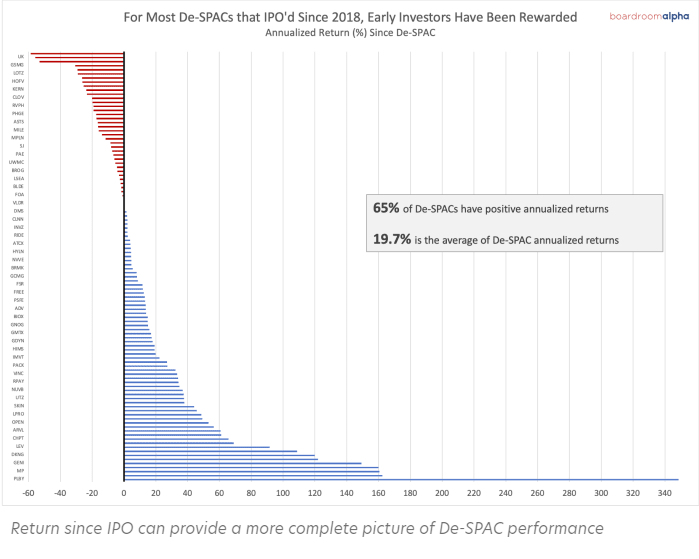
2018 vs 2021
In 2018, 65% of De-Spacs had a positive return, averaging a 19.7% return.
In 2020 70% of SPAC IPOs are trading below their offer price.
Of the SPACs that have completed mergers in 2021, 58% trade below their original offer price, according to Renaissance data.
In 2018, 65% of De-Spacs had a positive return, averaging a 19.7% return.
In 2020 70% of SPAC IPOs are trading below their offer price.
Of the SPACs that have completed mergers in 2021, 58% trade below their original offer price, according to Renaissance data.
Every bubble usually involves a general heightened speculative environment but also has its own asset type bubble.
The signs are usually there, but its easier to be naive than a bystander, when the music plays, you dance and the longer you dance, the bigger the hangover.
The signs are usually there, but its easier to be naive than a bystander, when the music plays, you dance and the longer you dance, the bigger the hangover.

Loading suggestions...