

The following thread will be on how I draw Supply & Demand Zones using multiple timeframes: ⬇️

First things first, it is important to note that there are no restrictions when it comes to which timeframe you draw zones on. Everyone uses different timeframes, these are just the ones that personally work best for me!

We know by now that Supply & Demand Zones are areas within a chart that help us gauge entries, exits, and where "big money" is located. But how do we go about drawing these zones, and what timeframe should we use?

Whenever I am looking to draw either zone, I am always starting with a longer timeframe. A longer timeframe is going to paint a clearer picture for you and help you in identifying zones easier. A longer timeframe will also help you not miss key information within a chart.
No matter which timeframe you are using, we are looking for reversal areas within a chart to create our zones. We are looking for points where a change in direction has occurred, and starting from the wick of the reversal to the body. Let's take a look at an example below.
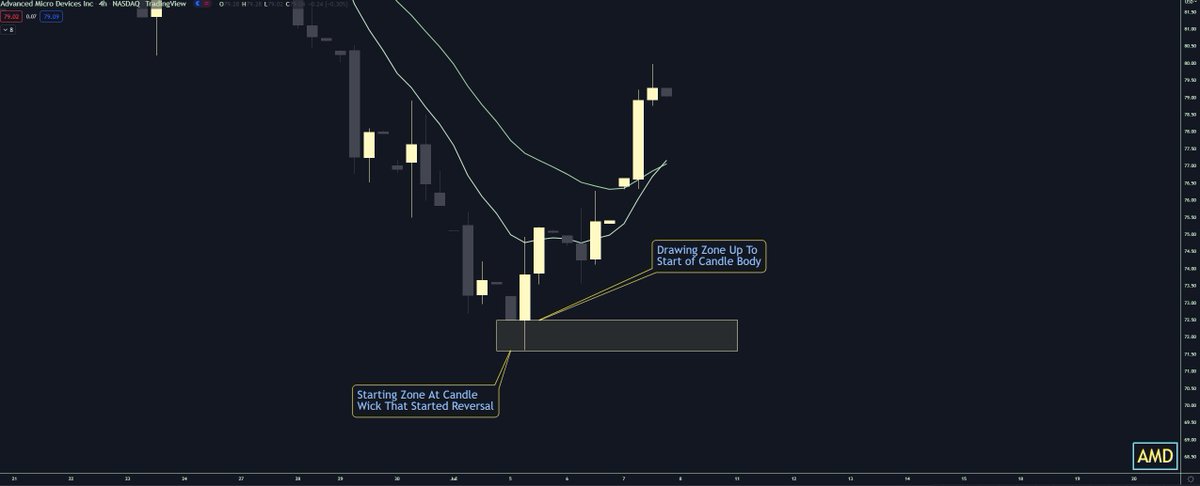
We can see from the example above using the 4 hour timeframe which I like to start with, we are manually drawing our zone that starts from the candle wick to the start of the candle body. After I draw a zone on the 4h, I will then drop down to the hourly timeframe.

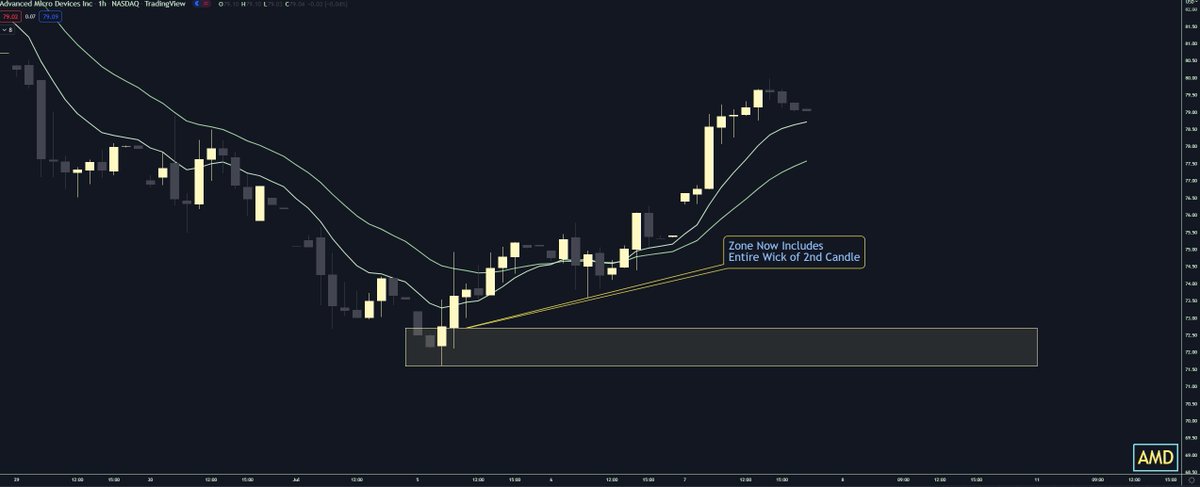
By dropping down to a shorter timeframe, it allows me to see any information I may have missed that I could include in my zones. As we can see by switching to the hourly, I most likely can bring my zone up to include the entire wick of this 2nd candle.

Now you are probably asking why would I bring my zone up to include that wick? Well, the reason for adjusting my zone, is to include the impulsive move from the 2nd candle. By doing this, I allow myself some leniency with my zone.
By allowing myself leniency with my Demand Zone, it will increase the likelihood price action reacts with my zone. It almost every scenario, it is better to have a bit bigger of a zone, than a zone that's too small. Now let's work our way down to the 10m chart.
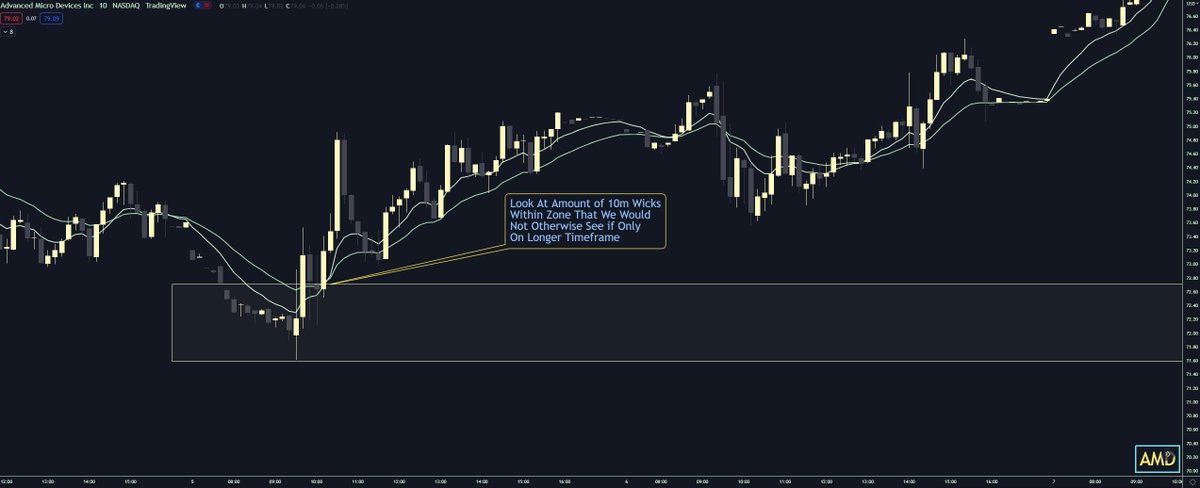
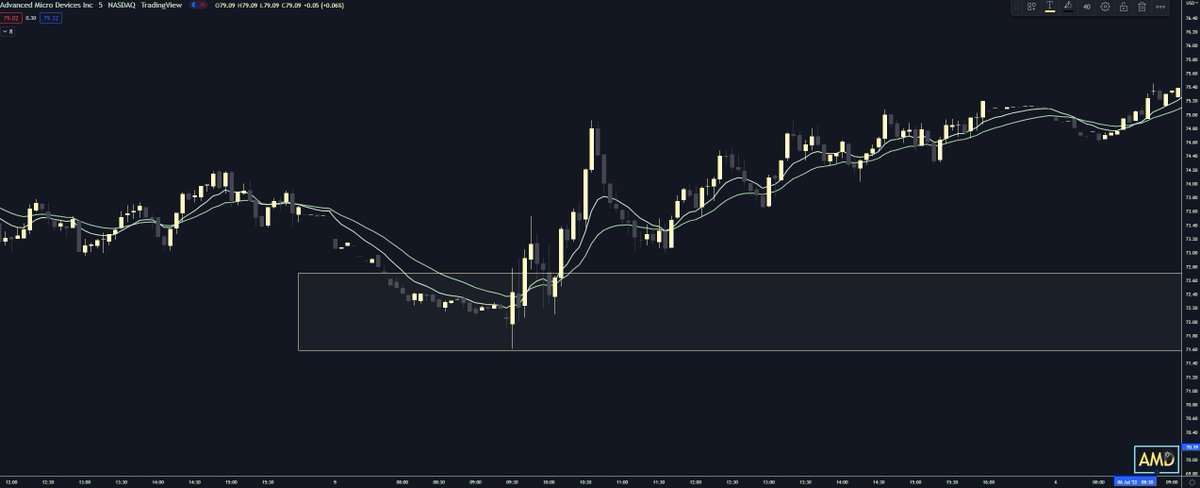
We can see when we drop down to the 10m chart, we have 4-5 10m candles that react within our zone. By only sticking with a longer timeframe, we would not be able to see and identify this interaction.

So far we have started with the 4h, and dropped down to the 10m timeframe. The 10m timeframe is the lowest I will go when drawing a zone. Whenever I am looking to enter in a zone however, I will use either the 3,5,10m timeframe to take an entry after I already have my zones set.
We can then see using the 5m timeframe, we have reaction with our zone, buyers' step in, and start a reversal.
Now, an important tool to use when knowing if a zone is too big or not is something called the ATR Indicator. The ATR (Average True Range) Indicator will show you on average how much a single stock moves during the course of a day.
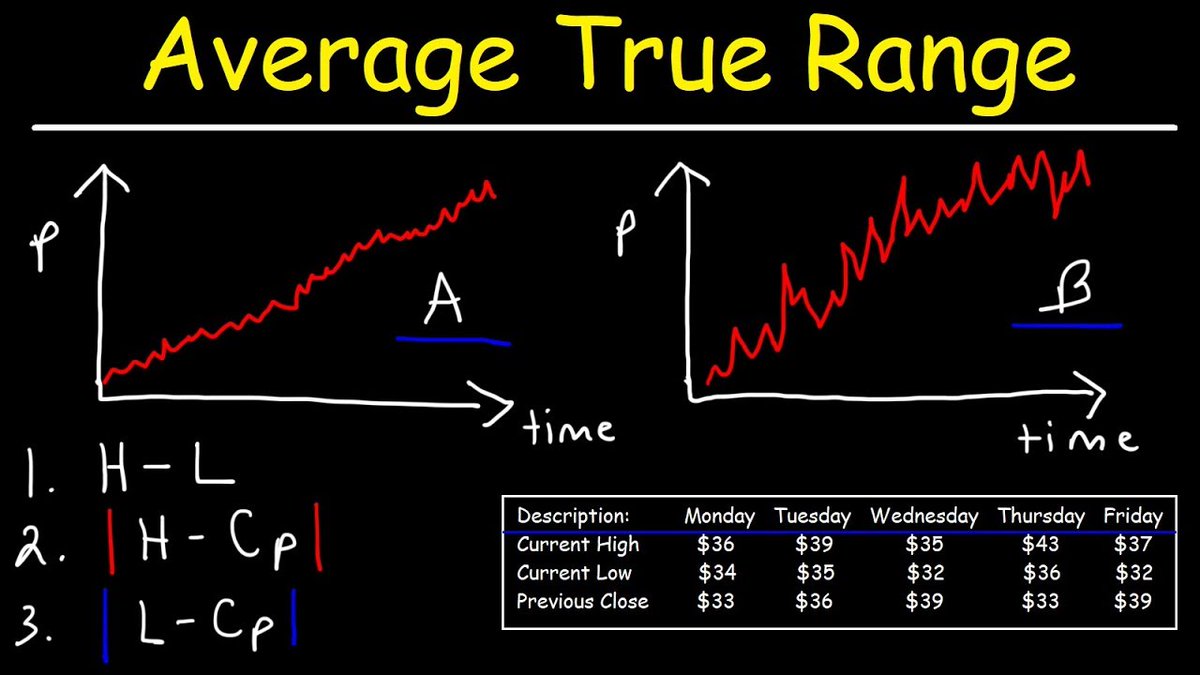
When using this indicator, you want to be using the Daily Timeframe, and hover over the most recent daily candle. This will show you on average how much that stock has moved within the last 14 trading days.
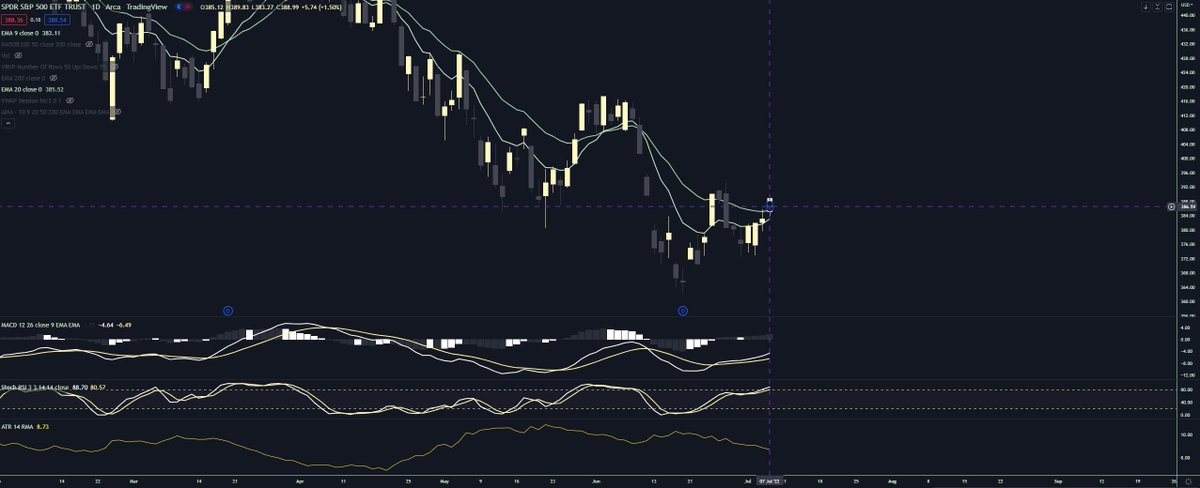
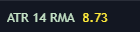
If we look in the bottom left-hand corner of the $SPY chart below, we can see on average $SPY has moved about $8.70 in the last 14 trading days. This is relevant information when drawing zones because we want to keep our zones within 1/8 - 1/10th of the Daily ATR.
For example, if $SPY moves on average around $10 a day, 1/8 - 1/10th of the daily ATR would be a zone around 1-2$. The daily ATR on each stock is going to be different. If you are playing a stock that has an ATR of $1, your zones will be much smaller.
NOW, with everything there are exceptions. Some days a zone for something like $SPY will be much bigger depending on volatility and volume. That is perfectly fine. The ATR indicator is just there to help guide you when first drawing zones.

To Recap:
-Start with 4h
-Drop Down to 1h
-Include Information Missed
-Drop Down to 10m
-Use ATR to Make Sure Zones Are Accurate
-Start with 4h
-Drop Down to 1h
-Include Information Missed
-Drop Down to 10m
-Use ATR to Make Sure Zones Are Accurate
As always, I really hope this thread helps. If anyone still has any further questions, please feel free to reach out to me! Thank you for your time.

Loading suggestions...