

Comparing 2018/2022 $BTC & $BTC.D Moves 📚
1/14
1/14
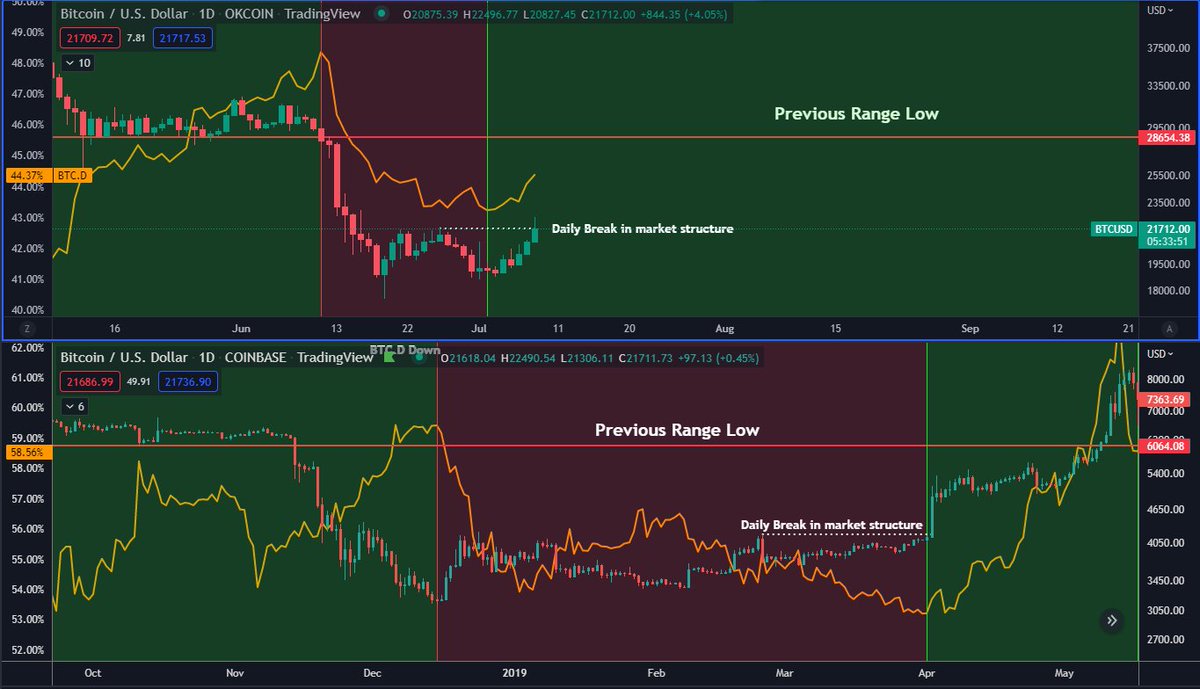
I thought it would be interesting to compare if we're showing similar movements in terms of BTC/BTC.D which could potentially help us figure out whether to expect a bottom or not.
Green area's is where $BTC.D goes up.
Red area's is where $BTC.D goes down.
2/14
Green area's is where $BTC.D goes up.
Red area's is where $BTC.D goes down.
2/14
The bottom chart, showing the 2018 bottom, shows BTC.D going up (green) after the range low break until the bottom was reached.
Then price went sideways and BTC.D went down (red).
3/14
Then price went sideways and BTC.D went down (red).
3/14

After that, BTC.D started going back up the moment Bitcoin saw it's first bullish market structure break on the daily (green). Which means we saw a higher low and higher high formed.
The sideways action before that wasn't able to close a daily candle above that.
4/14
The sideways action before that wasn't able to close a daily candle above that.
4/14
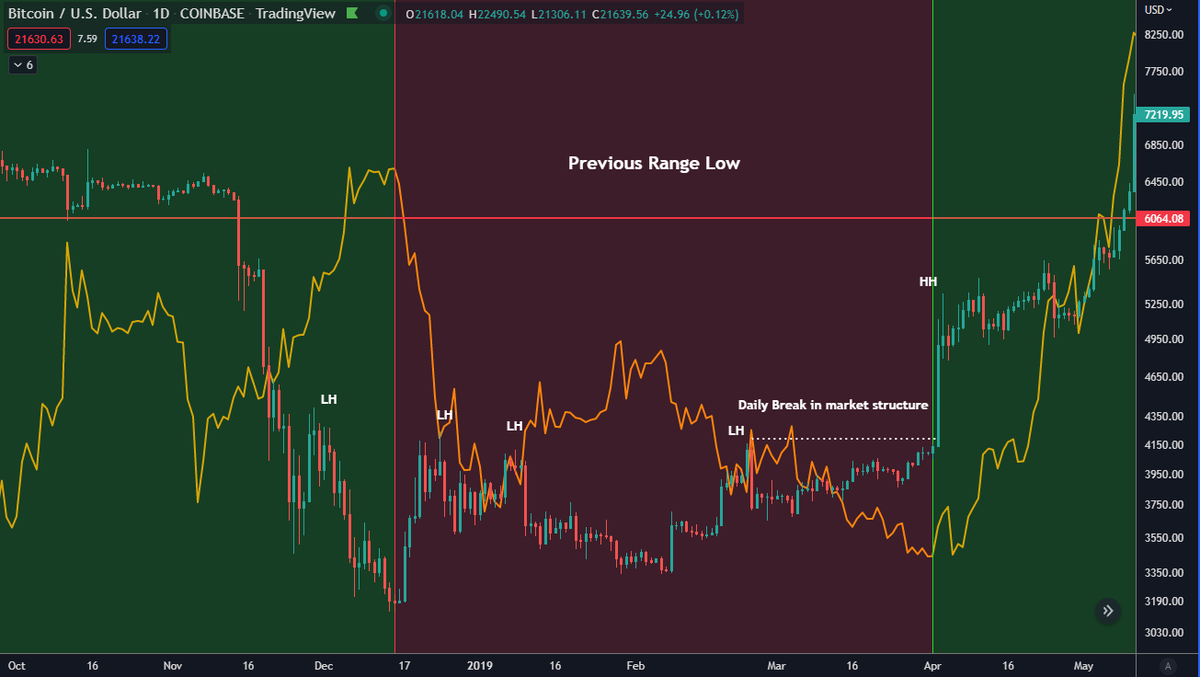
So to summarize: BTC.D climbed until a bottom was found and again when the daily market structure finally flipped into a bullish market structure (on daily candle close basis).
5/14
5/14
Now to our current situation:
This time $BTC also broke down from a similar range low but didn't sit on the range low for months on end like the 6K level in 2018.
This time it went quicker mainly caused by the forced selling of funds & macro fears.
6/14
This time $BTC also broke down from a similar range low but didn't sit on the range low for months on end like the 6K level in 2018.
This time it went quicker mainly caused by the forced selling of funds & macro fears.
6/14
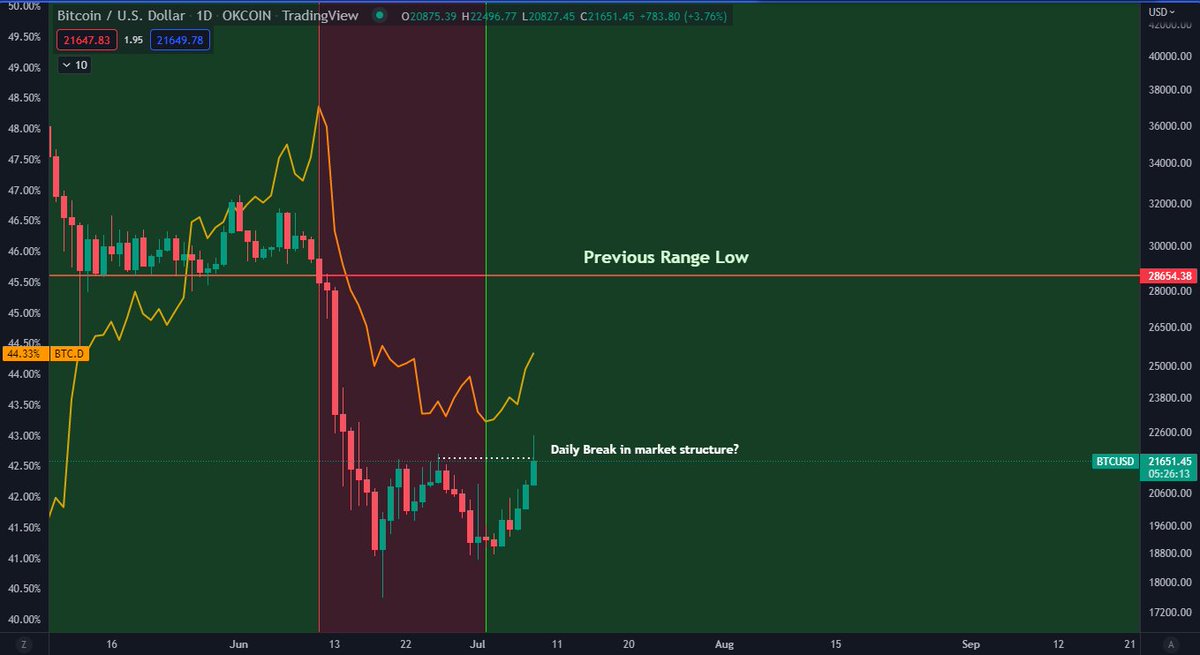
In terms of BTC.D we actually saw it go down the moment price broke down which is something that's not similar to 2018.
Now BTC.D started changing direction when price made a higher low.
7/14
Now BTC.D started changing direction when price made a higher low.
7/14
Price is attempting to close above the previous high which would confirm a daily break in market structure. We are indeed seeing BTC.D, similar to 2018, accelerate upwards as we're attempting this break.
8/14
8/14
To summarize:
1. Similar BTC break down of range low, just quicker this time.
2. This time BTC.D started falling prior to a "bottom" being reached and not after.
3. Similar BTC.D action on attempting a bullish market structure break by BTC.
9/14
1. Similar BTC break down of range low, just quicker this time.
2. This time BTC.D started falling prior to a "bottom" being reached and not after.
3. Similar BTC.D action on attempting a bullish market structure break by BTC.
9/14
So bottom or not? I'll let you decide.
A few things I can say:
What we usually seem to see is people buy back into alt coin positions as we reach the final stages of a down trend.
10/14
A few things I can say:
What we usually seem to see is people buy back into alt coin positions as we reach the final stages of a down trend.
10/14
This makes sense as these valuations are usually at very depressed levels so when a bear trend is seemingly losing steam, it makes sense these alts initially get a nice relief bounce as BTC tries to find a floor.
11/14
11/14
It's also likely that IF BTC finds a bottom and goes on a run, we likely see some of this liquidity and money from alts flow back into BTC. This is healthy for the market and something you actually want to see if you want this to bottom.
12/14
12/14
🔹What now?
Right now it's quite early to call any of this with certainty. A bullish break in market structure on the daily would surely be a good start for $BTC.
Keep your eyes peeled on BTC.D to see if this indeed goes up while BTC tries to form a new up trend.
13/14
Right now it's quite early to call any of this with certainty. A bullish break in market structure on the daily would surely be a good start for $BTC.
Keep your eyes peeled on BTC.D to see if this indeed goes up while BTC tries to form a new up trend.
13/14
If it does go up then that gives some nice confluence and would make for a healthier market than if it wouldn't in my opinion.
This also leaves more room later on for alts to run as BTC cools down.
That's all! Have a great day! ☀️
14/14
This also leaves more room later on for alts to run as BTC cools down.
That's all! Have a great day! ☀️
14/14
Loading suggestions...