

In the last two quarters:
GDP: -1% (assuming GDP Now is correct, a big assumption)
Employment: +2%
We have never seen a disconnect like that before in the data (available since 1948).
GDP: -1% (assuming GDP Now is correct, a big assumption)
Employment: +2%
We have never seen a disconnect like that before in the data (available since 1948).
You can see the magnitude of the disconnect in the productivity data. We'll get the real data in a month, based on my estimate for Q2 this is what output-per-hour (aka productivity) looks like. (Note this adjusts for nonfarm business and changes in hours.)
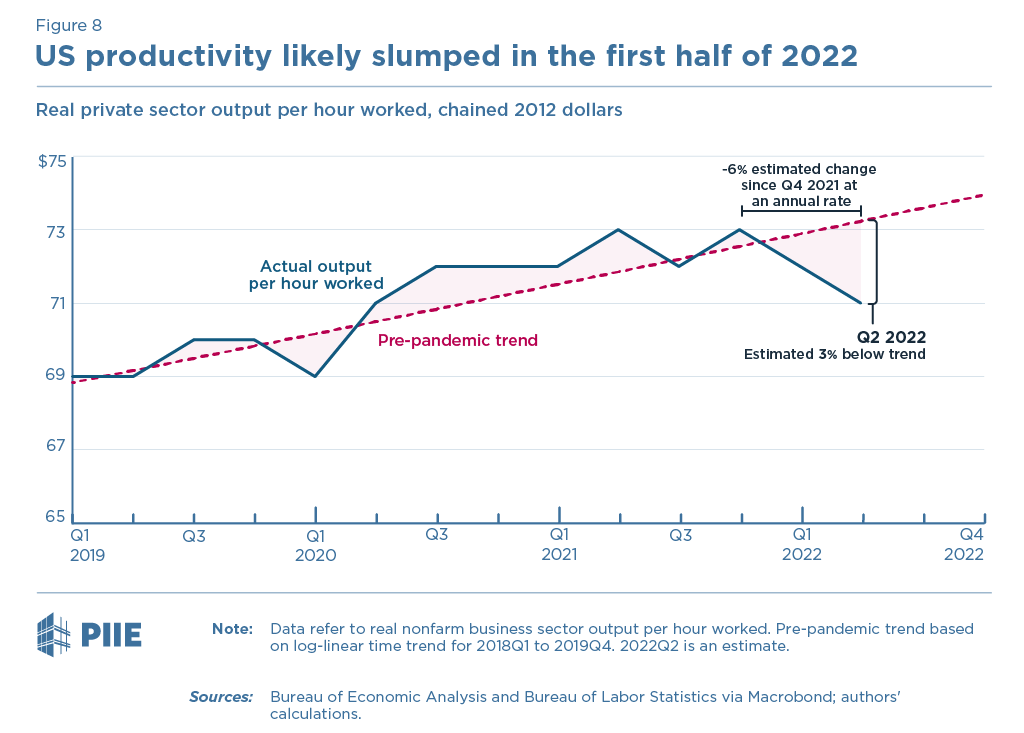
The 6% annual rate decline in nonfarm business output-per-hour over the last two quarters is twice as large as the largest reduction ever recorded.
Some possible interpretations:
Some possible interpretations:
1. Demand is slowing rapidly but employers still want to hire/hold onto workers. Either because they view demand reductions as temporary (e.g., inventories), are worried about ability to hire so labor hoarding, or moving towards more normal staffing.
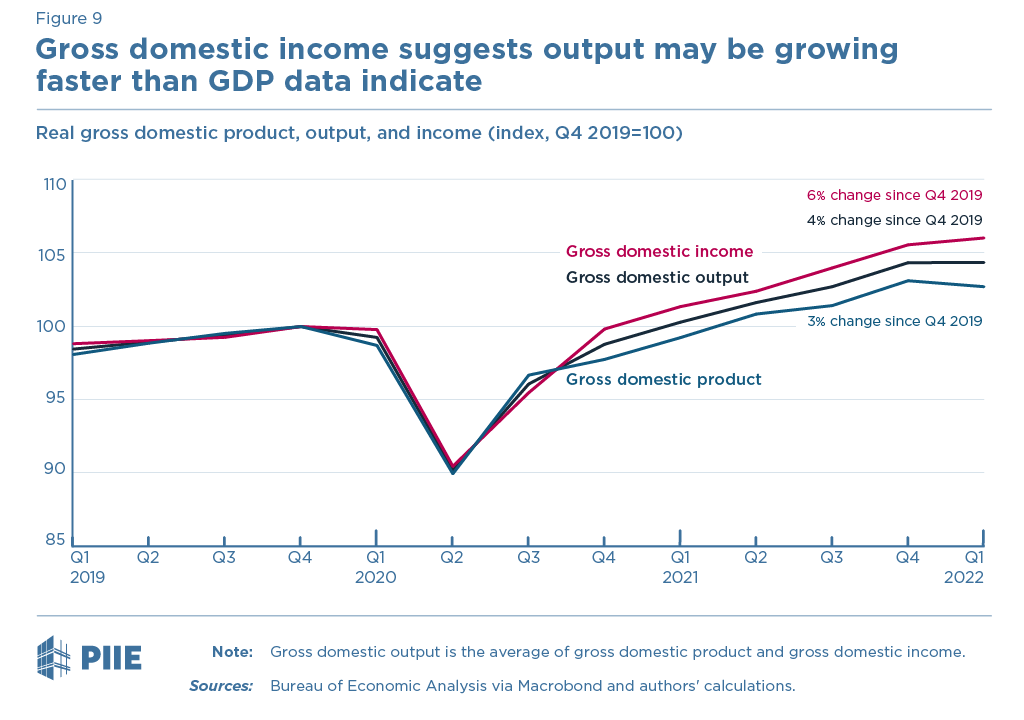
2. The data is wrong. Output was higher than reported in Q1 (some evidence for that in GDI > GDP) and ends up rising in Q2 (contrary to current trackers).
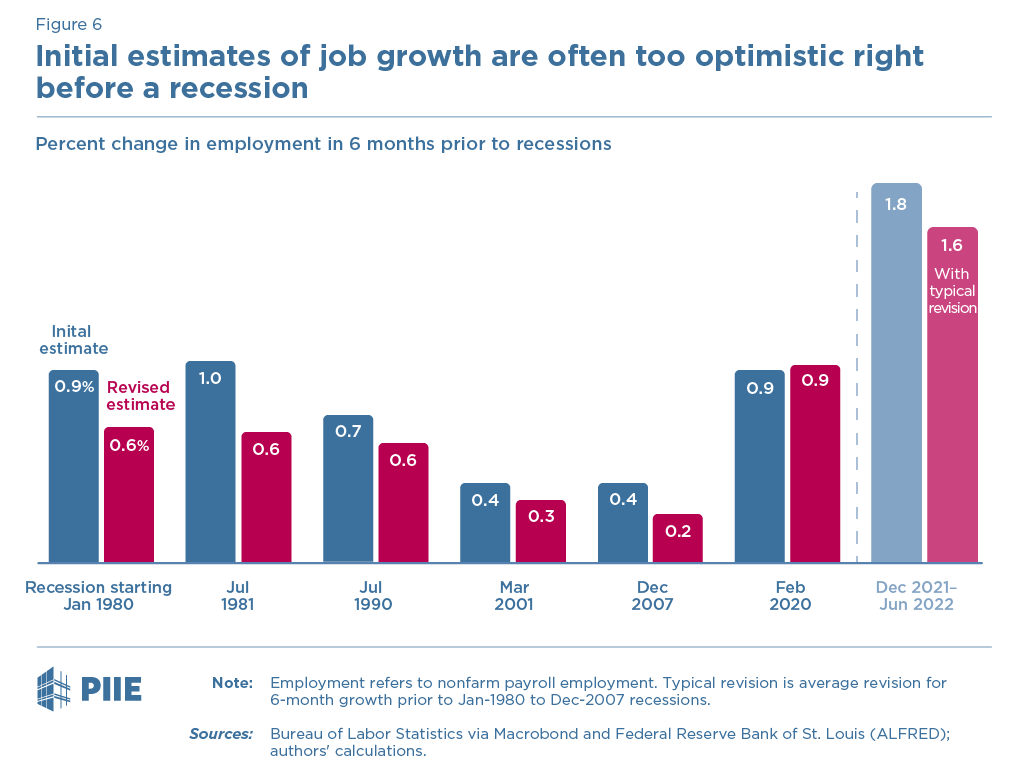
And employment growth was worse than reported and is revised down (as it generally is when the economy turns down).
And employment growth was worse than reported and is revised down (as it generally is when the economy turns down).
3. Least likely but a possible contributor: actual productivity growth has deteriorated markedly because, for example, work from home is less productive, investment was missing over the last few years, toll taken by COVID-related hardening, etc.
4. A good suggestion for one more possibility: composition as the economy shifts to lower productivity services. I tried to back-of-the-envelope quantify this last year and seemed more like 1 point than 6 points—but a good part of the story.
Loading suggestions...