

Headline jobs number was 372,000 in June based on employer survey.
But a survey of households showed 315,000 fewer people employed in June.
How should a Bayesian combine these data? Pretty much 100% weight on the payroll number.
But a survey of households showed 315,000 fewer people employed in June.
How should a Bayesian combine these data? Pretty much 100% weight on the payroll number.
.@JustinWolfers
used to have a 80-20 rule which would have said that we should infer jobs up ~200K in June.
We studied this systematically at CEA & came up w/ something more like a 92-8 rule. With a trivial loss from following a 100-0 rule. obamawhitehouse.archives.gov
used to have a 80-20 rule which would have said that we should infer jobs up ~200K in June.
We studied this systematically at CEA & came up w/ something more like a 92-8 rule. With a trivial loss from following a 100-0 rule. obamawhitehouse.archives.gov
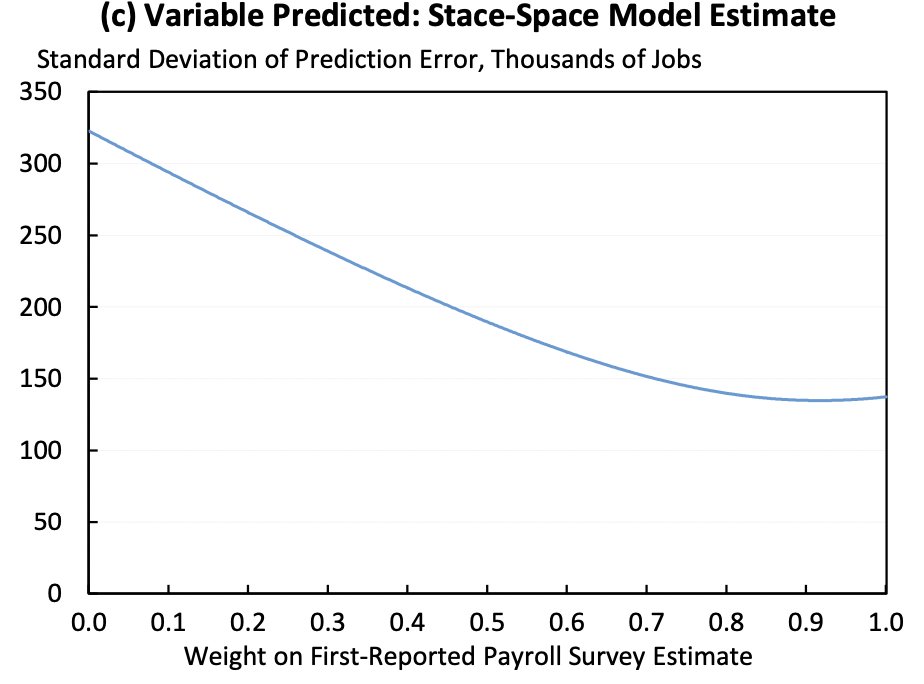
This shouldn't be surprising given that the payroll survey is drawing on a much larger sample size. And the household survey was really designed to measure ratios (like the unemployment rate) not changes in monthly levels.
PS deleted the previous thread after @ObsoleteDogma pointed out I misremembered the @JustinWolfers rule.
Loading suggestions...