

1. The Double Bottom:
A trend reversal pattern.
Two lows of similar levels are formed.
ENTRY:
BO of the Neckline shows trend reversal by forming a Higher swing high which is also the entry point.
SL: LOD or swing low at a lower TF
TARGET:
Height of the NL to B1
Eg: #GRANULES
A trend reversal pattern.
Two lows of similar levels are formed.
ENTRY:
BO of the Neckline shows trend reversal by forming a Higher swing high which is also the entry point.
SL: LOD or swing low at a lower TF
TARGET:
Height of the NL to B1
Eg: #GRANULES

2. The Volatility contraction pattern, VCP by Mark Minervini
After a prior uptrend, a stock digests its gains, and profit taking happens. It then bases and gets ready for the next uptrend. VCP is a characteristic of a constructive base. It has the following characteristics:
1/n
After a prior uptrend, a stock digests its gains, and profit taking happens. It then bases and gets ready for the next uptrend. VCP is a characteristic of a constructive base. It has the following characteristics:
1/n
VCP cont..
Contraction in:
1. price range of successive swing high lows from left to right.
2. time-taken for each contractions from left to right.
3. Volumes from left to right.
Price breaks out with an explosion in volatility with volumes post 3/4 contractions.
2/n
Contraction in:
1. price range of successive swing high lows from left to right.
2. time-taken for each contractions from left to right.
3. Volumes from left to right.
Price breaks out with an explosion in volatility with volumes post 3/4 contractions.
2/n
All Triangles post an uptrend are VCPs,
eg, #TATAELXSI building a SYMMETRICAL TRIANGLE PATTERN and showing VCP.
Note: Symm. T can break out on either side.
Buy above PIVOT point, above the DTL = 8336
SL Swing low = 7590 (or entry days low)
3/3
eg, #TATAELXSI building a SYMMETRICAL TRIANGLE PATTERN and showing VCP.
Note: Symm. T can break out on either side.
Buy above PIVOT point, above the DTL = 8336
SL Swing low = 7590 (or entry days low)
3/3

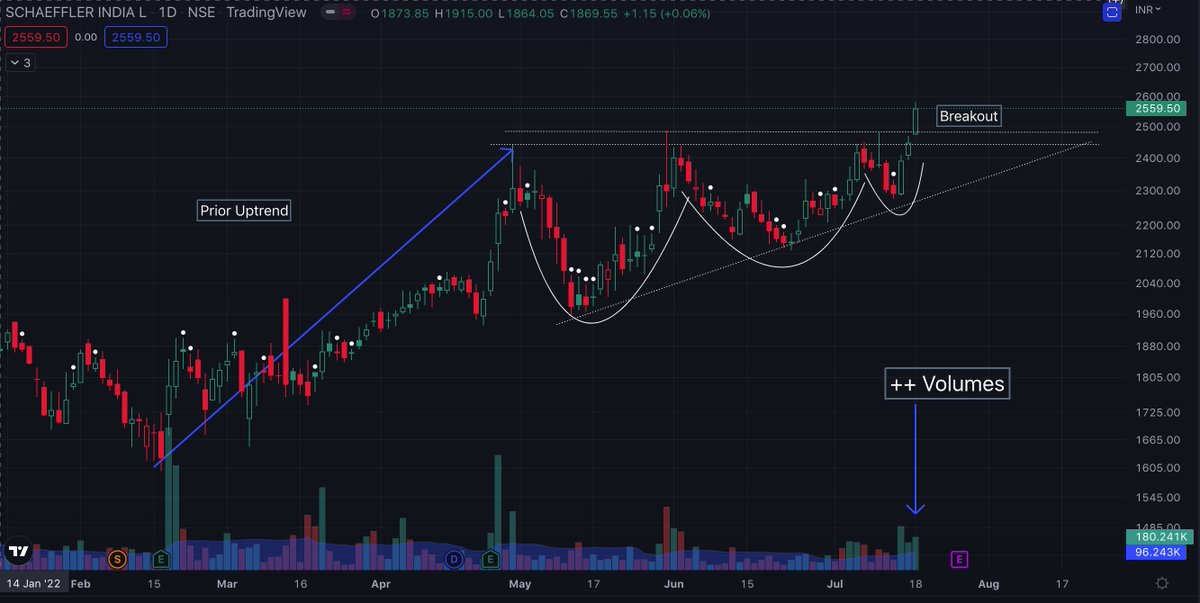
3. Ascending Triangle pattern.
Resistance is a horizontal line.
Support is an up-trending line.
Note the VCP inside the pattern.
Entry at Breakout above the Resistance.
BO with Volumes tends to be more successful.
SL = LOD or swing low.
eg: #SCHAEFFLER
Resistance is a horizontal line.
Support is an up-trending line.
Note the VCP inside the pattern.
Entry at Breakout above the Resistance.
BO with Volumes tends to be more successful.
SL = LOD or swing low.
eg: #SCHAEFFLER
4. Flag Pattern.
Pattern looks like a flag.
Has a pole (prior uptrend) and a Mast (retracement due to profit taking).
Constructive Flags must have a volume dry-up during the mast formation.
Entry = Break of DTL (volume on BO is necessary).
SL = Swing low or LOD
#SCHEFFLER
Pattern looks like a flag.
Has a pole (prior uptrend) and a Mast (retracement due to profit taking).
Constructive Flags must have a volume dry-up during the mast formation.
Entry = Break of DTL (volume on BO is necessary).
SL = Swing low or LOD
#SCHEFFLER

5. A Falling Wedge.
Price bounces between two downward sloping trendlines which are converging.
They have a Bullish bias post an uptrend (but can break either side).
Entry = Break of Resistance line (+ Volumes better).
SL = LOD or below Support line.
#Caplinpoint
Price bounces between two downward sloping trendlines which are converging.
They have a Bullish bias post an uptrend (but can break either side).
Entry = Break of Resistance line (+ Volumes better).
SL = LOD or below Support line.
#Caplinpoint

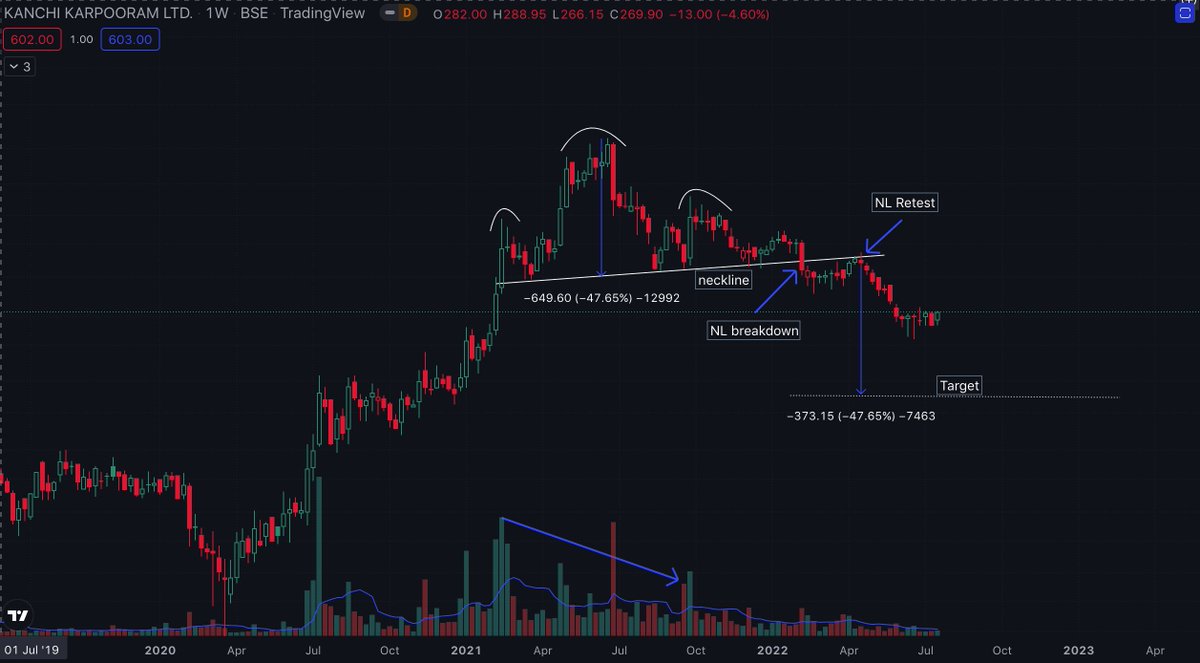
6. The Head and Shoulder Pattern.
1 of the most reliable reversal patterns.
A trend change from HL-HH to LH-LL (marked on chart).
Line joining 2 lows forms the neckline.
Trade entry = breakdown of NL
Target = (HH-NL) subtended downwards from breakdown.
1/n
1 of the most reliable reversal patterns.
A trend change from HL-HH to LH-LL (marked on chart).
Line joining 2 lows forms the neckline.
Trade entry = breakdown of NL
Target = (HH-NL) subtended downwards from breakdown.
1/n

Volume profile of a good HnS.
1. Head has lower volume than LS
2. RS has an even lower volume than Head
eg: #KANCHI
2/2
1. Head has lower volume than LS
2. RS has an even lower volume than Head
eg: #KANCHI
2/2
7. Cup and Handle pattern. 2T
8. Inverse Triangles/ Broadening wedges/ Megaphones
They generally have a bearish bias long-term.
Form consecutive Higher High and higher lows.
swing traders can initiate trades at the reversal points on either side.
eg: #INDIAGLYCOL
has a 20% upside after the flag breakout
They generally have a bearish bias long-term.
Form consecutive Higher High and higher lows.
swing traders can initiate trades at the reversal points on either side.
eg: #INDIAGLYCOL
has a 20% upside after the flag breakout

beautiful HnS
Another HnS with a downsloping Neckline.
They are more bearish than usual.
Beautiful, Target met.
#JUBLPHARMA
They are more bearish than usual.
Beautiful, Target met.
#JUBLPHARMA

9. The Flat Base Pattern.
Reliable, easier to spot, and easiest to manage risk.
Prices bounces between a rectangle for weeks before Breaking out above (or below, in a downtrend).
Entry: At the BO.
SL: below the BO candle.
target: height of the rectangle.
eg: #Wonderla
Reliable, easier to spot, and easiest to manage risk.
Prices bounces between a rectangle for weeks before Breaking out above (or below, in a downtrend).
Entry: At the BO.
SL: below the BO candle.
target: height of the rectangle.
eg: #Wonderla

Example: Kennamet
Cup and Handle with a Double bottom.
Beautiful.
Cup and Handle with a Double bottom.
Beautiful.

10. The High Tight Flag/ The powerplay set-up.
one of my fav. as a swing trader.
A Flag with:
=>100% move in <8 weeks
correction of =<25% from the top.
Entry: Break of Flag DTL or flag top
SL: low of the swing low/mast low
Target: same as flag
Eg: SRHHPOLTD (not completed)
one of my fav. as a swing trader.
A Flag with:
=>100% move in <8 weeks
correction of =<25% from the top.
Entry: Break of Flag DTL or flag top
SL: low of the swing low/mast low
Target: same as flag
Eg: SRHHPOLTD (not completed)

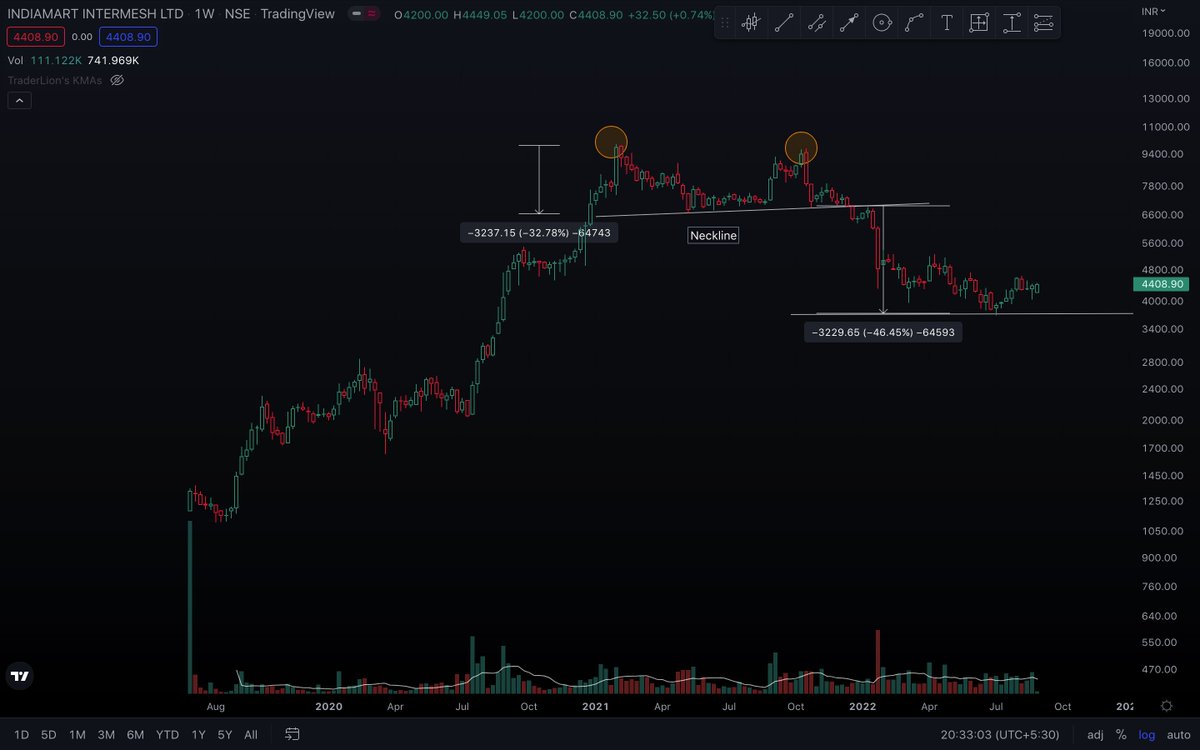
11. Double Top.
A reversal pattern, and the reverse of a double bottom
Price makes a high around the same level as previous high.
Short at the break of previous swing low.
Target is the distance from the lower top to the neckline downwards.
Eg: Indiamart: beautiful
A reversal pattern, and the reverse of a double bottom
Price makes a high around the same level as previous high.
Short at the break of previous swing low.
Target is the distance from the lower top to the neckline downwards.
Eg: Indiamart: beautiful
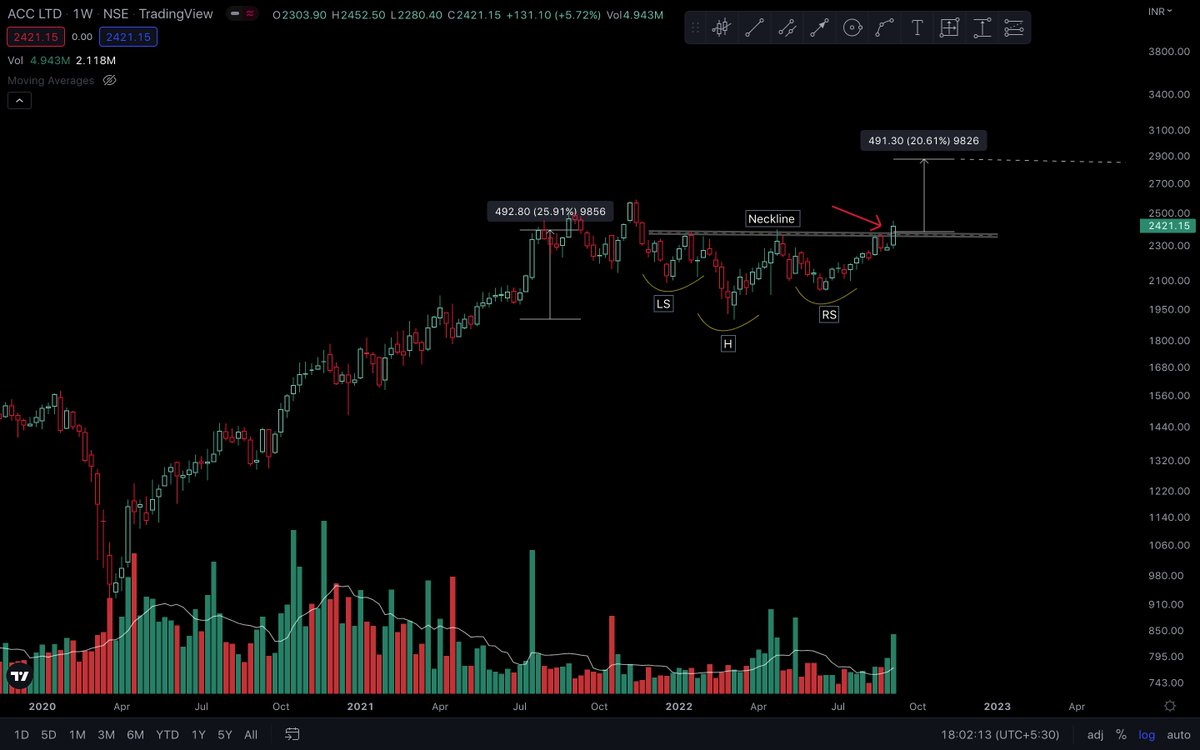
12. Inverse Head and Shoulder.
A reversal pattern, opposite to the H&S.
Entry at the break of Neckline.
Target = distance from NL to head, extended upwards
Eg: ACC ltd
A reversal pattern, opposite to the H&S.
Entry at the break of Neckline.
Target = distance from NL to head, extended upwards
Eg: ACC ltd
If you liked this thread, follow @SakatasHomma for more of such educational threads and tweets about Trading
I am a technical analyst, and I mentor beginners in the stock market.
Subscribe to my Blog sakatas.substack.com
Checkout my Youtube channel
@sakatashomma" target="_blank" rel="noopener" onclick="event.stopPropagation()">youtube.com
I am a technical analyst, and I mentor beginners in the stock market.
Subscribe to my Blog sakatas.substack.com
Checkout my Youtube channel
@sakatashomma" target="_blank" rel="noopener" onclick="event.stopPropagation()">youtube.com
Loading suggestions...