

Directional Traders are good at spotting patterns.
But 98.8% of the new traders, don't know how to spot patterns.
I analyzed
@niki_poojary 's account, to learn the most important patterns to master.
Here are the 8 of the most important patterns: 🧵
But 98.8% of the new traders, don't know how to spot patterns.
I analyzed
@niki_poojary 's account, to learn the most important patterns to master.
Here are the 8 of the most important patterns: 🧵
@niki_poojary 1/ Cup and handle Pattern
Happens during an uptrend.
The cup portion has a U-shaped appearance.
The bears are getting weaker as they are unable to drive the prices below the last low.
Subhasish Pani uses this a lot in stocks to spot bullish trades.
Happens during an uptrend.
The cup portion has a U-shaped appearance.
The bears are getting weaker as they are unable to drive the prices below the last low.
Subhasish Pani uses this a lot in stocks to spot bullish trades.

@niki_poojary 2/ Inverse Cup and Handle Pattern
Happens during a downtrend.
The cup portion has a reverse U-shaped appearance.
The bulls are getting weaker as they are unable to drive the prices above the last high.
Subhasish Pani uses this a lot in stocks to spot bearish trades.
Happens during a downtrend.
The cup portion has a reverse U-shaped appearance.
The bulls are getting weaker as they are unable to drive the prices above the last high.
Subhasish Pani uses this a lot in stocks to spot bearish trades.

@niki_poojary 3/ Double Bottom Pattern
It is a bullish pattern that has the shape of a "W".
The market tries twice to break the lows but is unsuccessful.
This is a reversal pattern to observe during a downtrend for a bullish trade.
It is a bullish pattern that has the shape of a "W".
The market tries twice to break the lows but is unsuccessful.
This is a reversal pattern to observe during a downtrend for a bullish trade.

@niki_poojary 4/ Double Top Pattern
It is a bearish pattern that has the shape of an "M".
The market tries twice to break the highs but is unsuccessful.
This is a reversal pattern to observe during an uptrend for a bearish trade.
It is a bearish pattern that has the shape of an "M".
The market tries twice to break the highs but is unsuccessful.
This is a reversal pattern to observe during an uptrend for a bearish trade.

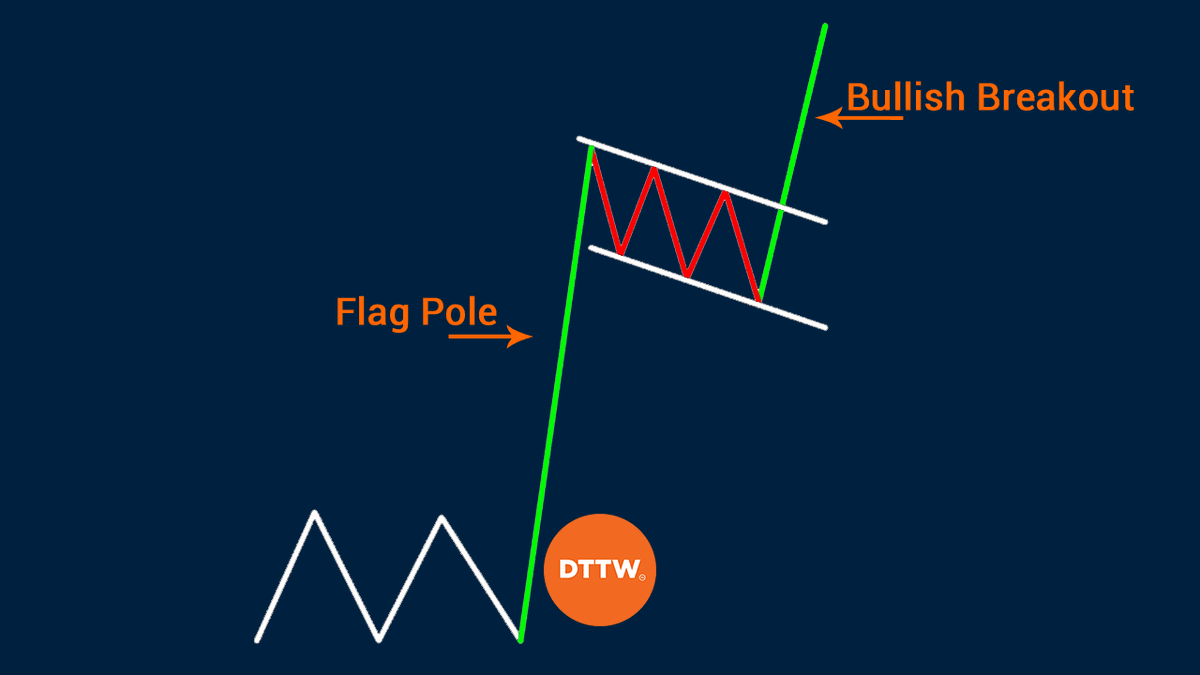
@niki_poojary 5/ Bullish Flag Pattern
Happens after a trending move.
After constant lower lows in a downward sloping rectangle, the market breaks out.
These patterns are very powerful if the down move is still higher than 50% of the distance of the up move.
Happens after a trending move.
After constant lower lows in a downward sloping rectangle, the market breaks out.
These patterns are very powerful if the down move is still higher than 50% of the distance of the up move.
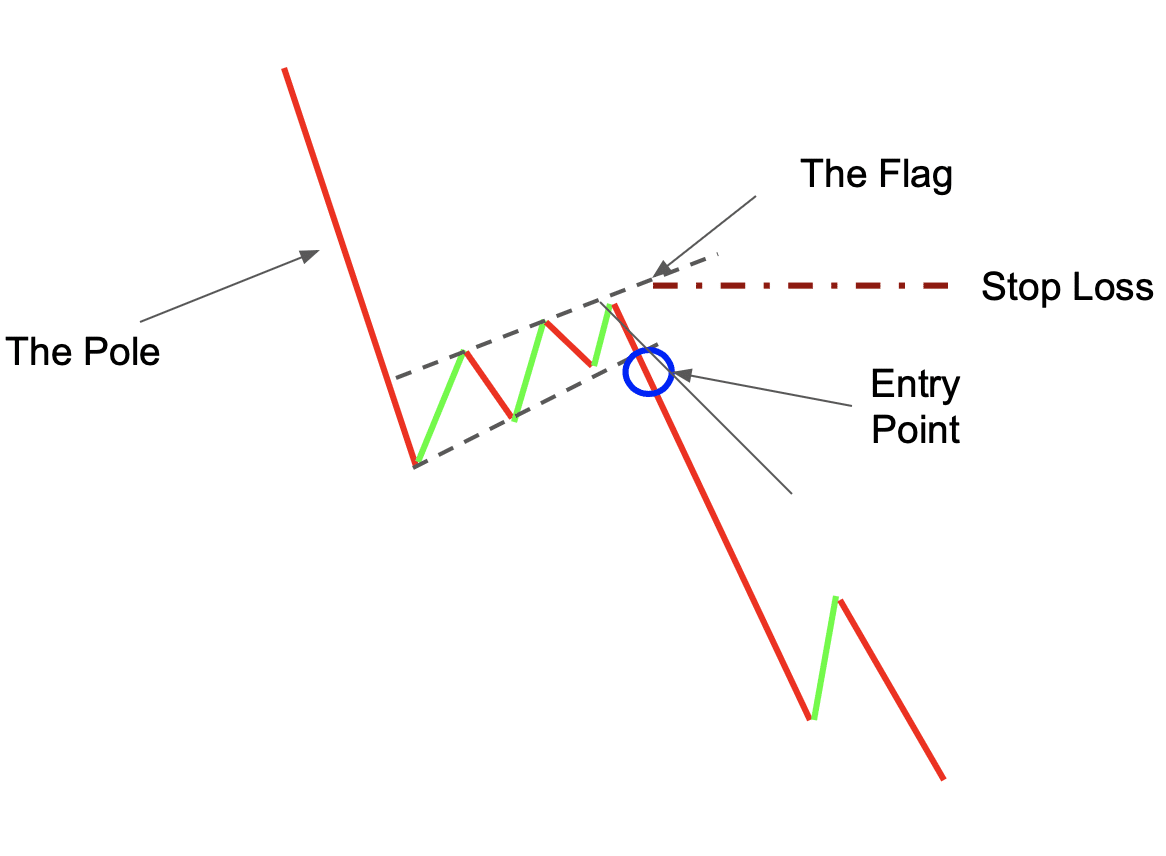
@niki_poojary 6/ Bearish Flag Pattern
Happens after a trending move.
After constant higher highs in an uptrend-sloping rectangle, the market breaks down.
These patterns are very powerful if the up move is still lower than 50% of the distance of the down move.
Happens after a trending move.
After constant higher highs in an uptrend-sloping rectangle, the market breaks down.
These patterns are very powerful if the up move is still lower than 50% of the distance of the down move.
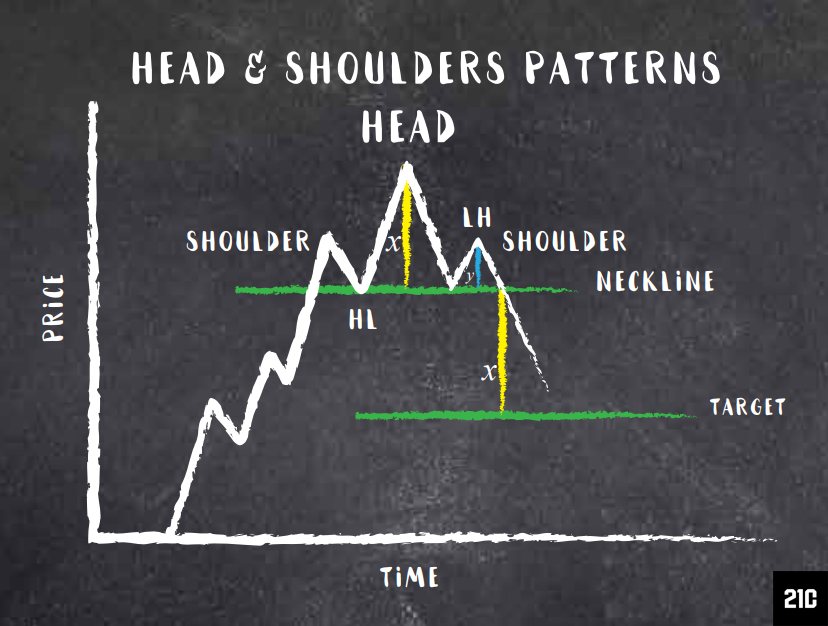
@niki_poojary 7/ Head and Shoulders Pattern
Signifies a change from a bullish to a bearish trend.
The bullish momentum is reducing as bulls are not able to take out their highs with force.
Bears are fully in control.
We look for a trade below the breakdown of a support in such patterns.
Signifies a change from a bullish to a bearish trend.
The bullish momentum is reducing as bulls are not able to take out their highs with force.
Bears are fully in control.
We look for a trade below the breakdown of a support in such patterns.
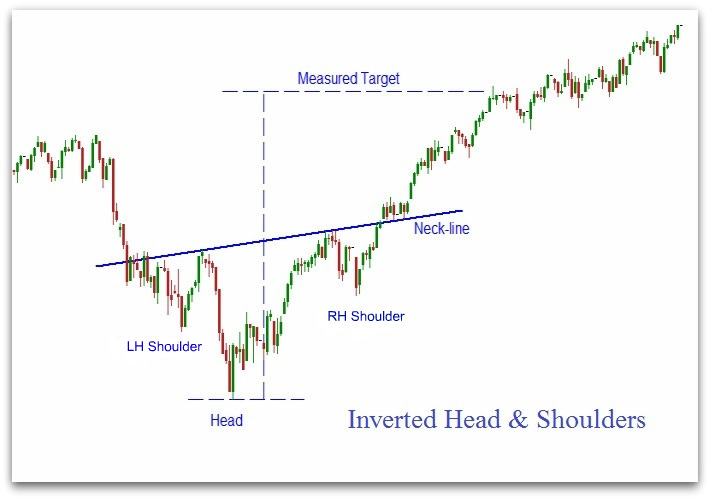
@niki_poojary 8/ Inverse Head and Shoulders Pattern
Signifies a change from a bearish to a bullish trend.
The bearish momentum is reducing as bears are not able to take out the lows with force.
Bulls are fully in control.
We trade above the breakout of a resistance in such patterns.
Signifies a change from a bearish to a bullish trend.
The bearish momentum is reducing as bears are not able to take out the lows with force.
Bulls are fully in control.
We trade above the breakout of a resistance in such patterns.
@niki_poojary If you really liked this thread
Here's another we think you'd love:
Here's another we think you'd love:
Loading suggestions...