

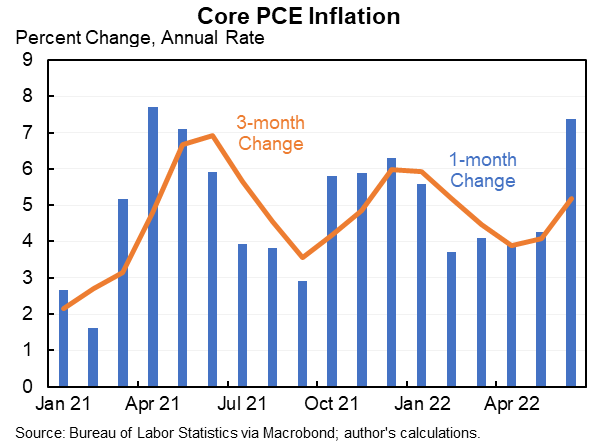
Core PCE inflation at an annual rate:
12 months: 4.8%
6 months: 4.8%
3 months: 5.2%
1 month: 7.4%
Only a little of that is passthrough from the Russian invasion.
More soon.
12 months: 4.8%
6 months: 4.8%
3 months: 5.2%
1 month: 7.4%
Only a little of that is passthrough from the Russian invasion.
More soon.
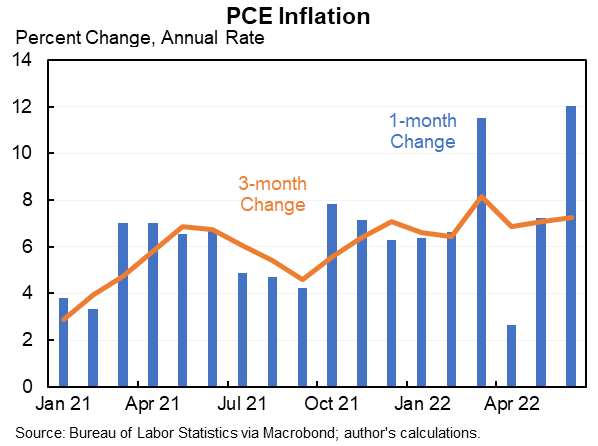
Here is monthly and three month headline and core inflation. The headline is volatile due to food and energy (and will be coming way down in July). Core inflation much less volatile.
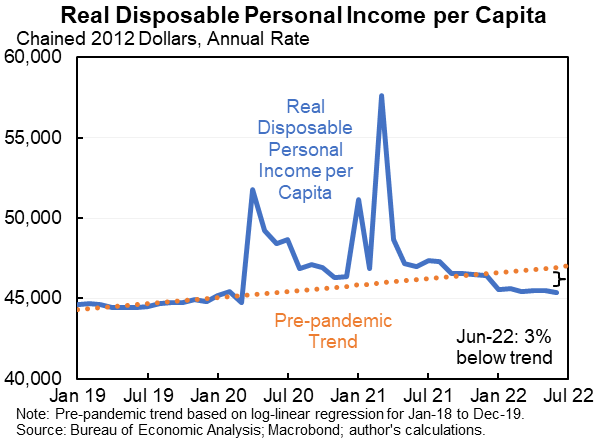
Inflation has driven real disposable income per capita down in most of the months over the last 15 months.
Note real DPI/capita well below trend in June but still cumulative big gain in last two years.
Note real DPI/capita well below trend in June but still cumulative big gain in last two years.
Despite the dramatic decline in incomes real personal consumption expenditures are slowing--but still roughly holding their own.
Even with huge inflation in June consumers still managed to spend 0.1% more in real terms.
Even with huge inflation in June consumers still managed to spend 0.1% more in real terms.
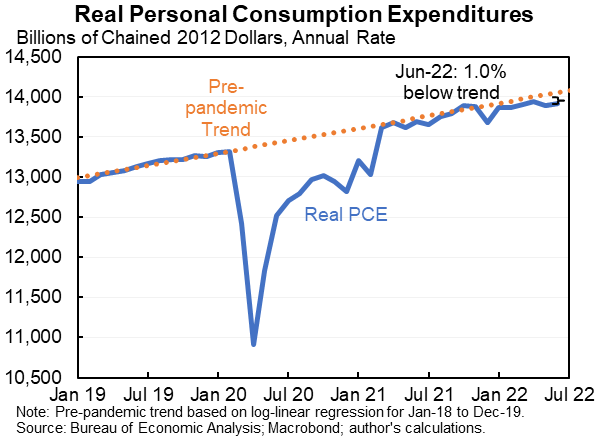
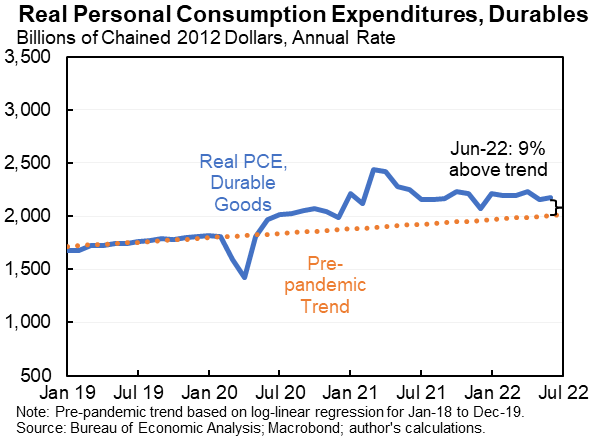
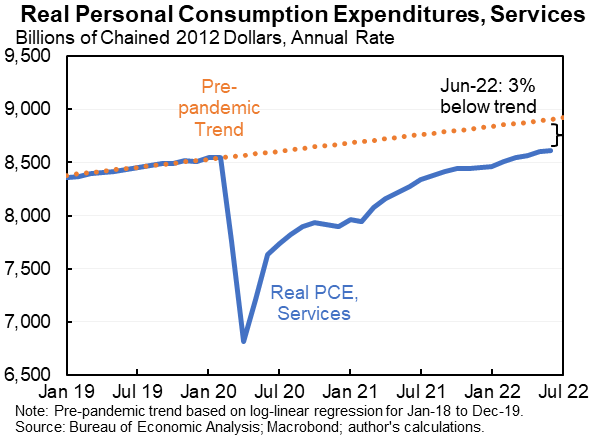
Durables continue to be above trend and services below. But at this point attributing this to the pandemic seems increasingly shaky--much of the services shortfall is health and many pandemic-sensitive categories have roughly returned to normal.
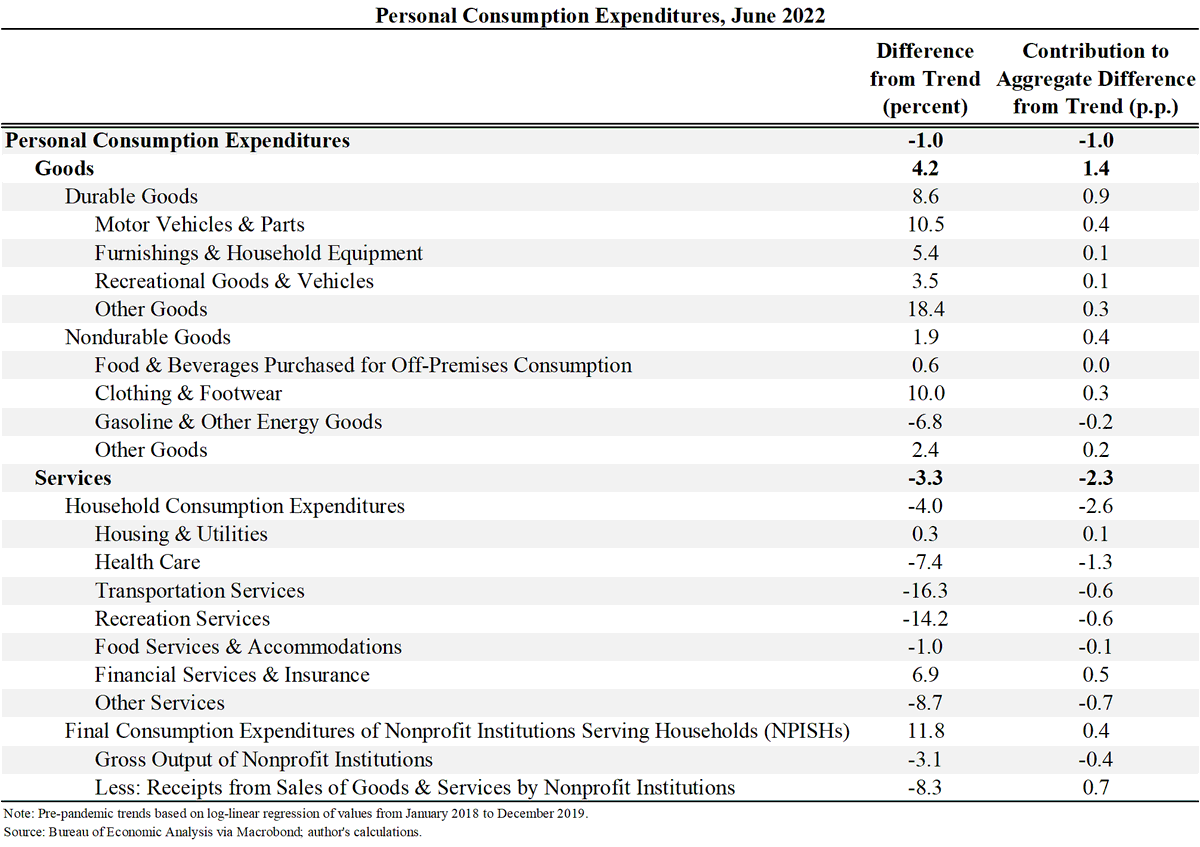
If you're interested here are lots of different categories of consumption and how they compare to pre-pandemic trends. Health care far and away the biggest consumption shortfall.
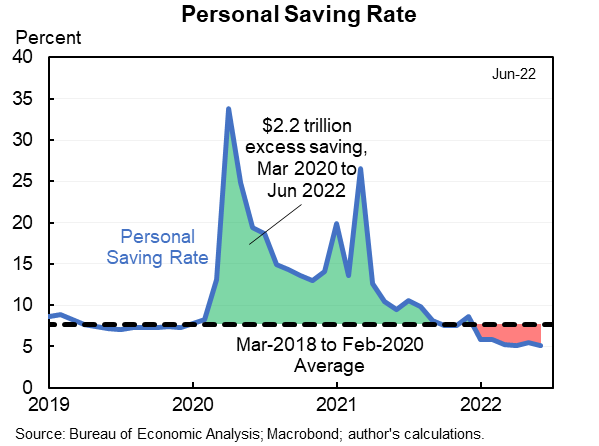
Falling incomes but stable consumption are being supported by a lower-than-normal personal saving rate. It fell to a cycle low of 5.1% in June--well below the 7.5% before. (Note, this is a residual and poorly measured--but the story seems reasonably clear.)
Overall this makes me a tiny bit less nervous about recession and a tiny bit more worried about inflation. June had positive consumption growth after the May decline. Nominal growth was extremely strong. But all of this is a tiny feeling.
If all you had was the price data you would think underlying PCE inflation was something like 5% or possibly higher.
You get a slightly lower read from the wage data.
This may turn in a better direction soon but no evidence of it in the data yet.
You get a slightly lower read from the wage data.
This may turn in a better direction soon but no evidence of it in the data yet.
Loading suggestions...