

An exercise for any investors who want to get started adding technical analysis to their toolkit.
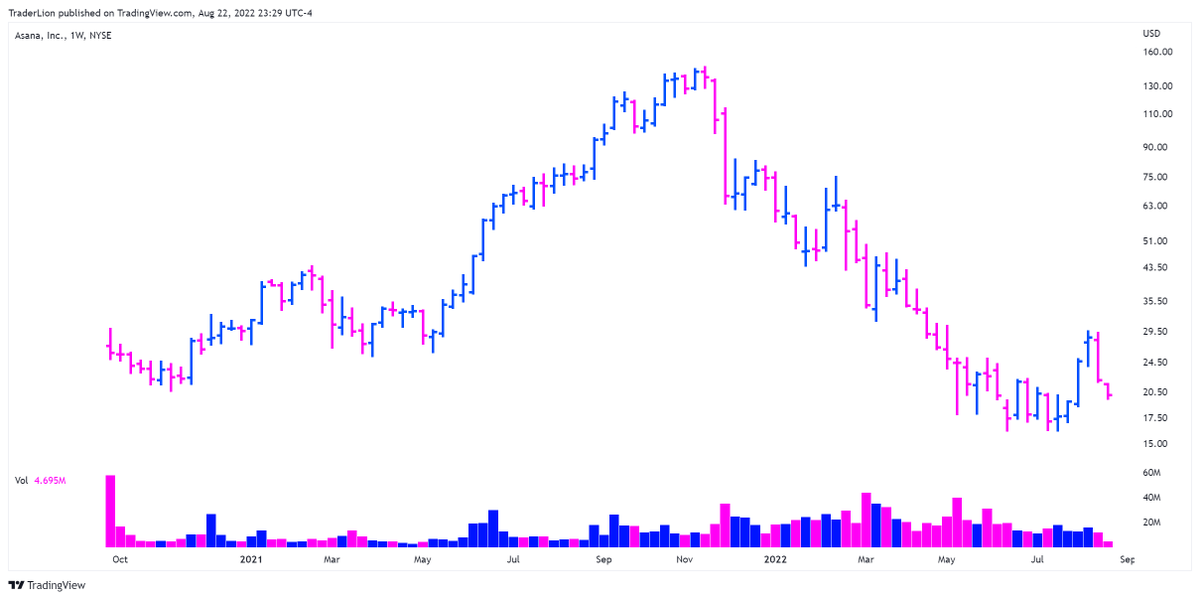
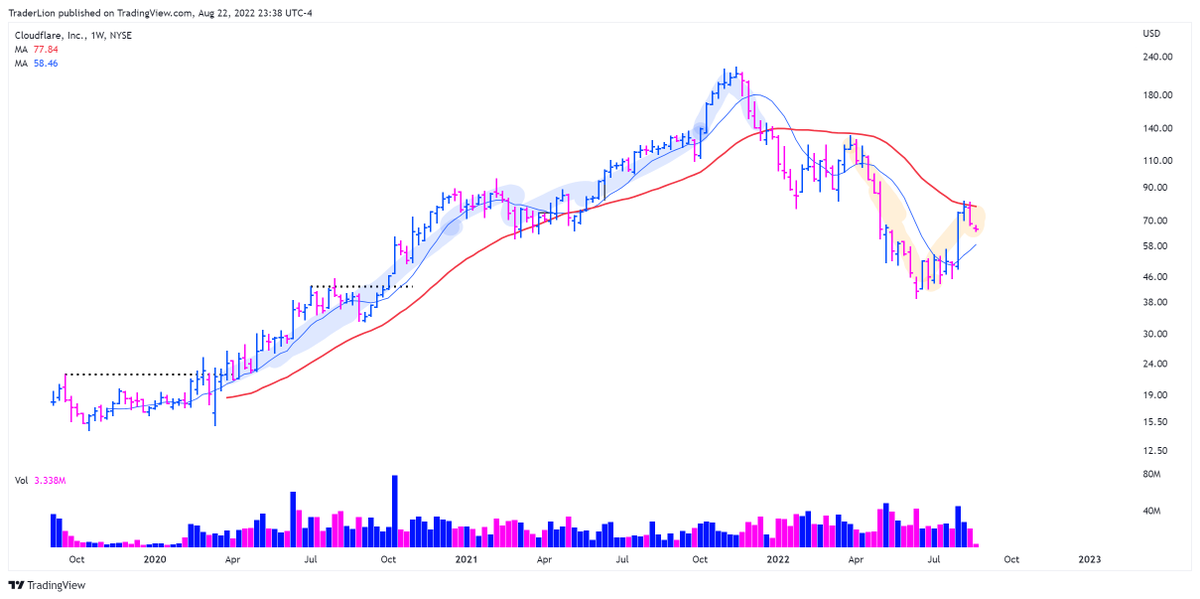
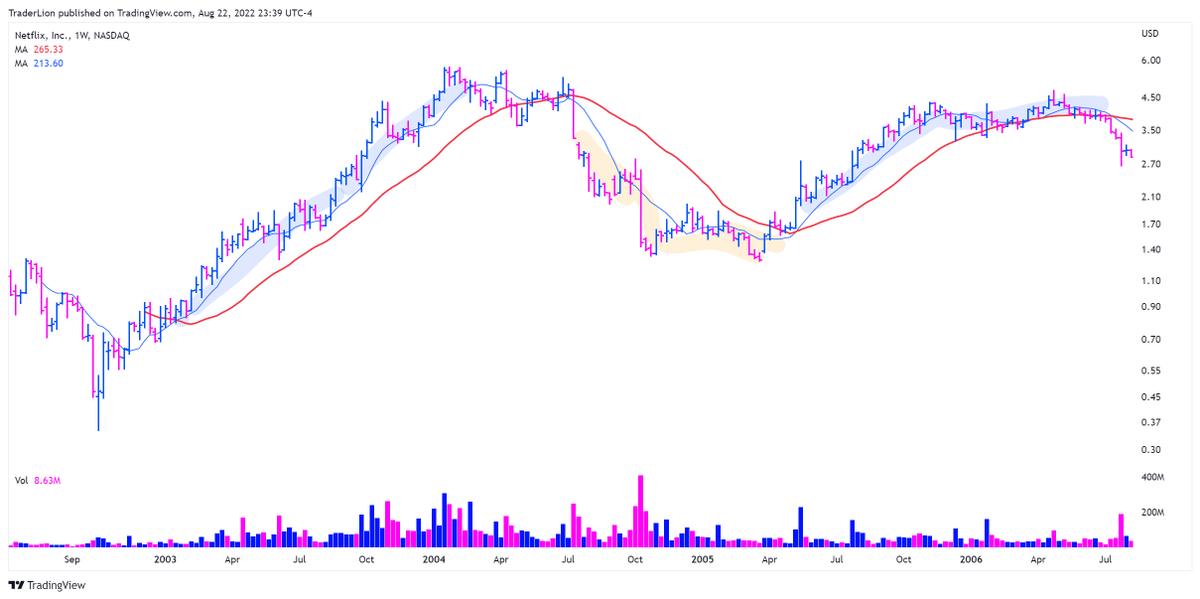
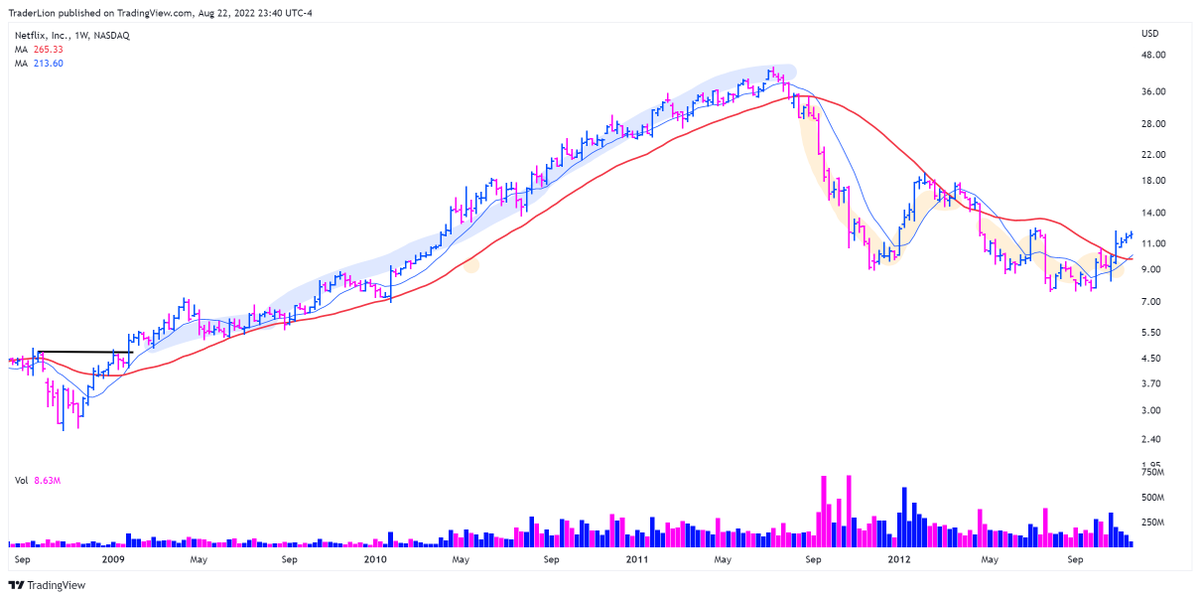
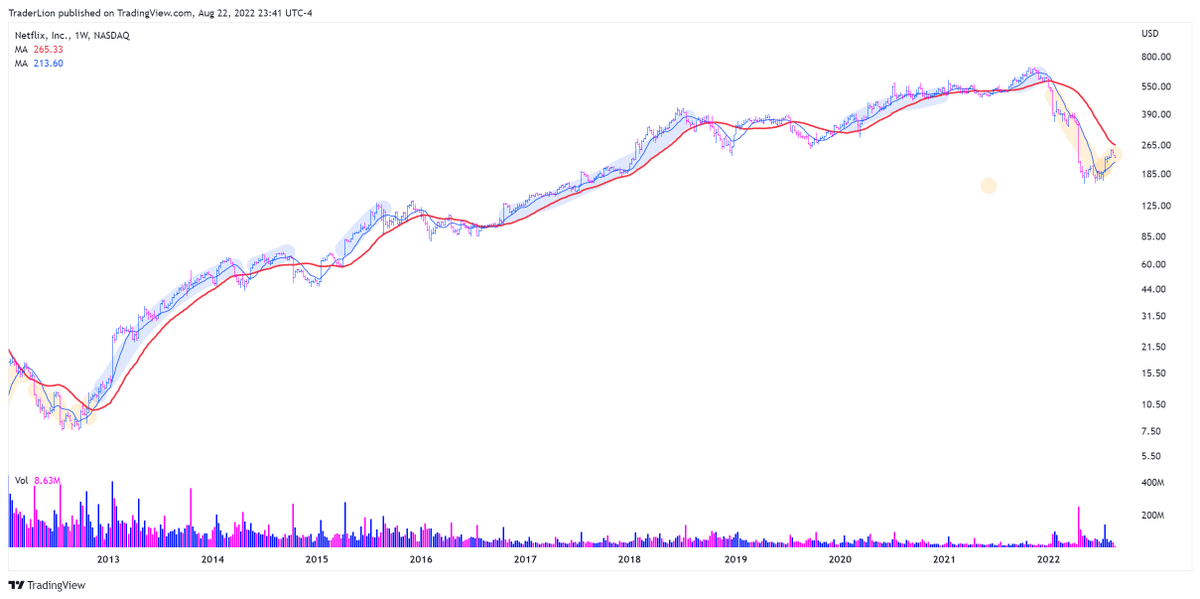
Step 1: Open up any charting software (You can use one like tradingview which is free). Go to a weekly chart
Step 1: Open up any charting software (You can use one like tradingview which is free). Go to a weekly chart
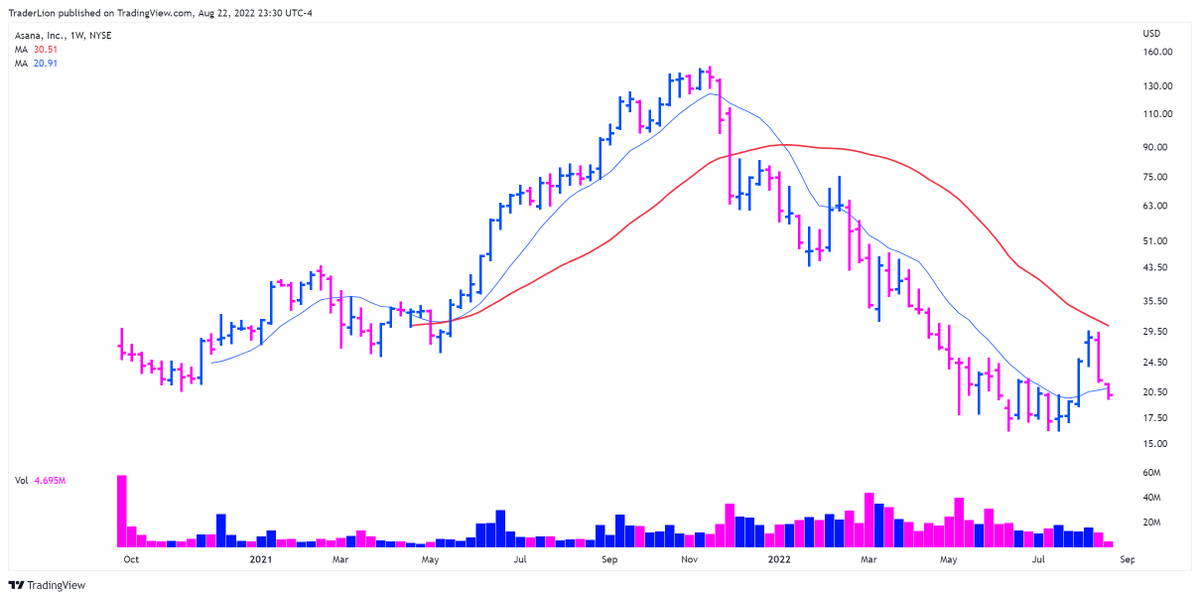
Step 2: Add a 10-week simple moving average as well as a 30-week moving average
Step 3: Bring up this list:
ASAN
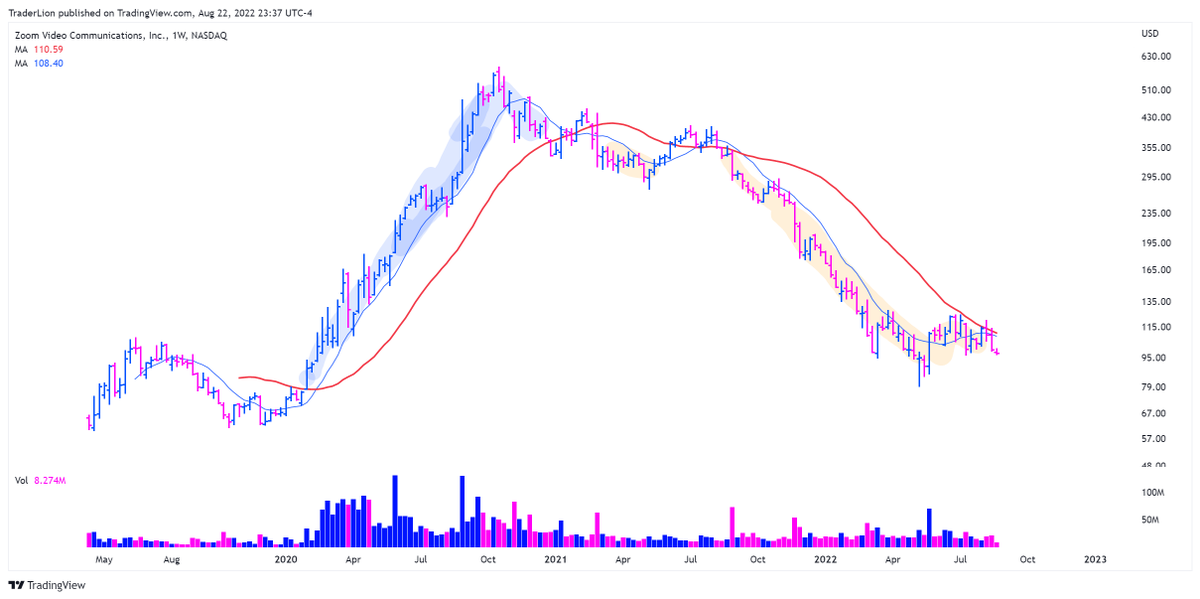
ZM
NET
NFLX
MSFT
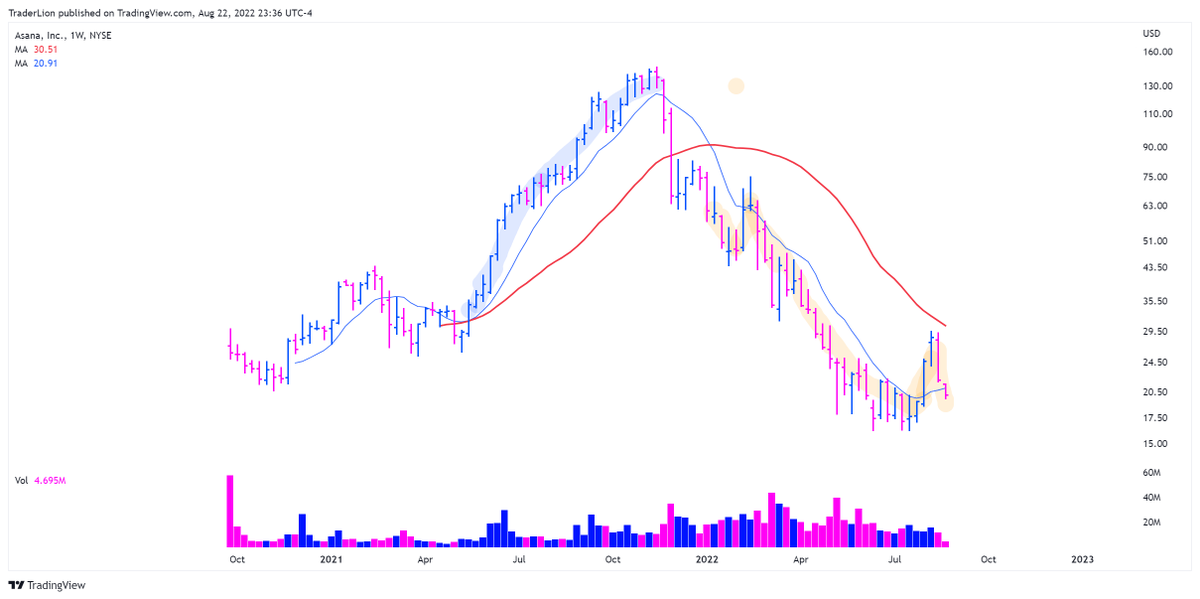
For each one, look for periods of time where the stock rose above a rising 10 and 30 week MA for a long period. highlight these in blue
Then look for when the stock was below a declining 30 week for a long time - color red
ASAN
ZM
NET
NFLX
MSFT
For each one, look for periods of time where the stock rose above a rising 10 and 30 week MA for a long period. highlight these in blue
Then look for when the stock was below a declining 30 week for a long time - color red
That's it, this should start to train your eyes to identify the long-term trend of a stock
ASAN
ZM
NET
NFLX
Loading suggestions...