

what’s a dcf?
there’s probably already a million threads on this but oh well
sophieconomics 101 - valuing a business
a dcf is a discounted cash flow model that we’ll use to get a sense of what we should pay for an asset today based on the cash it will earn in the future
there’s probably already a million threads on this but oh well
sophieconomics 101 - valuing a business
a dcf is a discounted cash flow model that we’ll use to get a sense of what we should pay for an asset today based on the cash it will earn in the future
big picture - were going to calculate free cash flow available to the business this year & use data + our best judgment to project cash flows for the next 5-10 yrs and then discount the value of those cash flows back to today (because we’d rather have $1 today than $1 next year)
why does free cash flow matter?
not only is it a key indicator of the financial health of a business but it also allows the company to increase shareholder value through buying back shares, paying a dividend, paying down debt, reinvesting in the company or making acquisitions
not only is it a key indicator of the financial health of a business but it also allows the company to increase shareholder value through buying back shares, paying a dividend, paying down debt, reinvesting in the company or making acquisitions
the formula for discounting future cash flows to find their present value
pv = future value / (1 +i)^n
where i = the discount rate & n = number of periods (yrs in our case)
so n is 1 for the 1st yr of our projections, 2 for the 2nd etc
well come back to the discount rate
pv = future value / (1 +i)^n
where i = the discount rate & n = number of periods (yrs in our case)
so n is 1 for the 1st yr of our projections, 2 for the 2nd etc
well come back to the discount rate
the main aspects -
revenue
% growth
ebit
% of revenue
tax rate
this gets us to earnings before interest, after taxes. from here we do a few more calculations to get to free cash flow
+ d & a
- capex
- changes in net working capital
this gets us to free cash flow
revenue
% growth
ebit
% of revenue
tax rate
this gets us to earnings before interest, after taxes. from here we do a few more calculations to get to free cash flow
+ d & a
- capex
- changes in net working capital
this gets us to free cash flow
the most important thing is building an intuition for understanding what the business earns in terms of fcf & projecting reasonable growth for the next ~5 years. as you can see, dcf models require lots of discretionary input & can be sensitive to small changes in variables
there are two elements to determining the value of the business (or asset)
the forecast period (the 5-10 years we’re forecasting in our model)
& the “terminal value” the value of all the cash flows after that, once the biz reaches a terminal growth rate (usually 2-4% ish)
the forecast period (the 5-10 years we’re forecasting in our model)
& the “terminal value” the value of all the cash flows after that, once the biz reaches a terminal growth rate (usually 2-4% ish)
once we have the forecast for the next 5 years, we’ll take the last year of fcf & multiply it by 1 + the terminal growth rate & then divide it by the discount rate - terminal growth rate
TV = FCF(1+ g) / (r - g)
well then discount the terminal value to find the present value
TV = FCF(1+ g) / (r - g)
well then discount the terminal value to find the present value
so we’ll have 5 years of forecasted cash flows (each discounted back to the present based on when we’ll receive them) & the terminal value of the cash flows once the company reaches a terminal growth rate (also discounted) the sum of those will be our implied enterprise value
wait tho, wtf is the “discount rate?” you’ll also hear this referred to as the weighted average cost of capital
in essence, it’s the firm’s cost of capital (all the sources of financing it’s business operations, debt & equity) it’s determined by the market & not by management
in essence, it’s the firm’s cost of capital (all the sources of financing it’s business operations, debt & equity) it’s determined by the market & not by management
you can think of WACC as the return that bondholders & shareholders demand in order to provide the firm w capital (most dcfs will use a range for WACC)
the formula for calculating WACC where the cost of equity is
the equity risk premium x (the firms beta + the risk free rate)
the formula for calculating WACC where the cost of equity is
the equity risk premium x (the firms beta + the risk free rate)

you might be thinking “wow that’s a lot of subjectivity for something that’s supposedly a quantitative analysis of a business” & you’re right. the purpose isn’t to find an exact valuation, but to help us develop an understanding of the company & how the market might valuing it
so now we have our projected cash flows for the next 5 years & our terminal value calculated (both discounted back to their present value) we add those & subtract the firms net debt to arrive at our implied enterprise value & divide to shares outstanding to find the share price
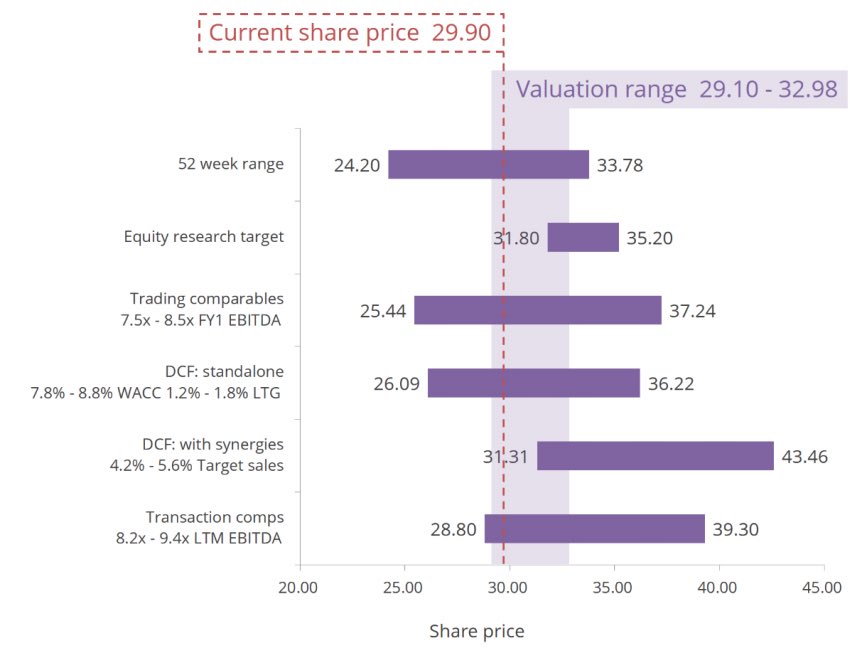
this is a simple version of a dcf model that values a business based on projections for perpetual growth of the business (the terminal value) another common industry approach is to project cash flow (or ebitda) & look for multiples that other companies have sold for recently
this is useful because gives you a sense of the multiple that other investors have been paying for comparable businesses. the perpetual growth & exit multiple approaches are just two ways to value a business and are often weighed alongside others in a football field visualization
if it were as easy as buying assets that are below their discounted value, markets would be solved & there would be algorithms that would arbitrage any inefficiency before u could blink. a dcf is just a tool to understand how the biz generates cash & how the market values the biz
let’s take Google as an example - assuming ~15% revenue growth, 30% net profit margin, capex as ~13% of revenue, a discount rate of 8% & a long term growth rate of 4% we’d arrive at an equity value of ~$1.9T & a share price of $150 (rough numbers, obv this is better w a visual)
that valuation shows some upside from the current price. however, if we look at industry multiples (tricky because google is sort of in a league of its own) the average price/earnings is around ~14x but google trades at 20x, which would imply downside from the current price!
this is a simple example to illustrate how a dcf is just a tool in the process of making an investment and if you’re investing based on fundamentals, there will certainly be key drivers & other qualitative aspects that will determine if an investment is a good opportunity or not
hopefully this was somewhat helpful. if i make a thread like this again i’ll definitely include visuals to illustrate what i’m saying w each tweet. i’m open to any comments/criticism/general thoughts as i’m always trying to learn so feel free to reach out & lmk your thoughts
Loading suggestions...