

Stage Analysis Technical Attributes (SATA) indicator has been published on #TradingView
Identify the Four Stages from Stan Weinstein's Stage Analysis method using the visual scoring system
Enjoy!
#StanWeinstein #stocks #trading #investing #Indicators
tradingview.com
Identify the Four Stages from Stan Weinstein's Stage Analysis method using the visual scoring system
Enjoy!
#StanWeinstein #stocks #trading #investing #Indicators
tradingview.com

Here's the previous post with examples:
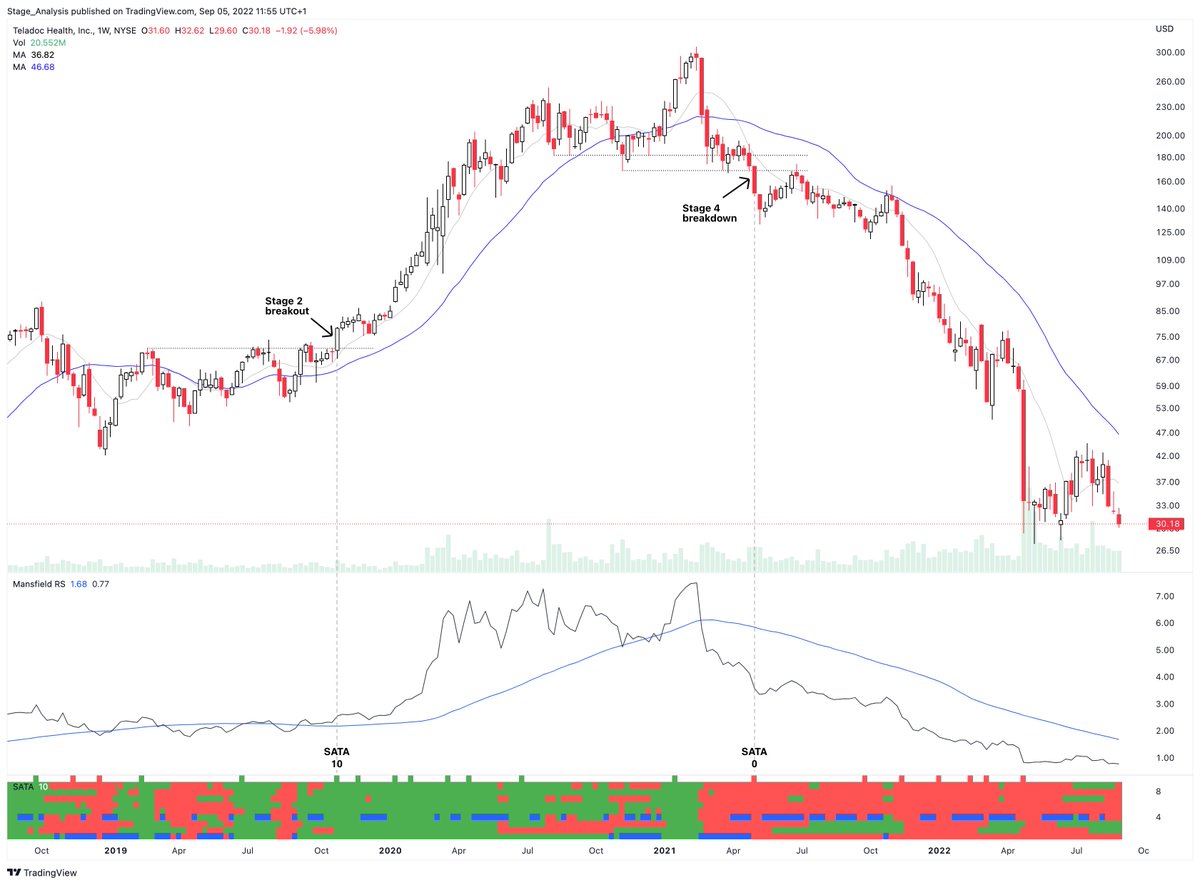
The intention of the indicator is to help people to be able to identify the four Stages on the WEEKLY timeframe, where the major Stages are determined.
Here's another example of how to use the SATA indicator to help to visually identify the Stages using $TDOC
There are 10 blocks – each green block gets a score of 1, and each red or blue has no value.
Simply count the green blocks. 10 is best, 0 is worst
There are 10 blocks – each green block gets a score of 1, and each red or blue has no value.
Simply count the green blocks. 10 is best, 0 is worst
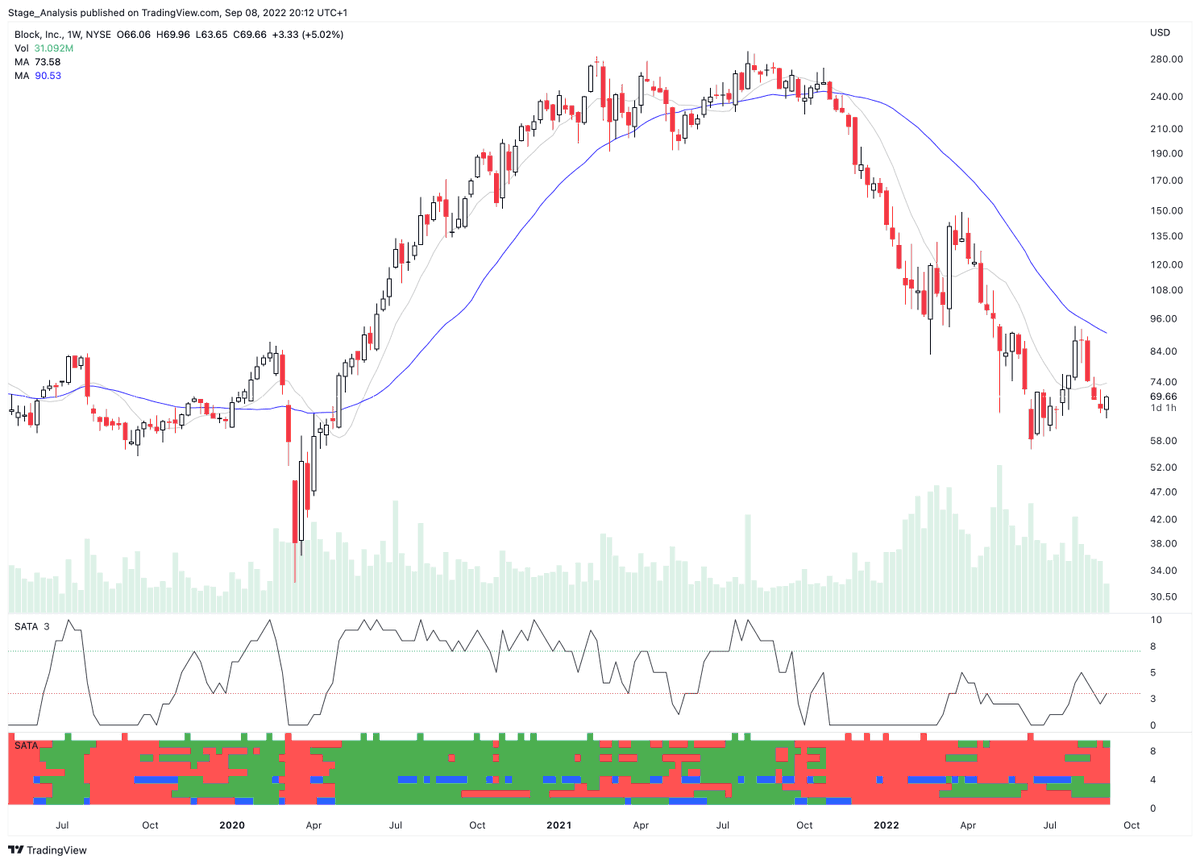
The SATA indicator has been updated: tradingview.com
▪️ Total SATA Score added to the end
▪️ Oscillator version options added
▪️ Hide the total score line by making it transparent
To get the new options. You need to remove the indicator from your chart and re-add it.
▪️ Total SATA Score added to the end
▪️ Oscillator version options added
▪️ Hide the total score line by making it transparent
To get the new options. You need to remove the indicator from your chart and re-add it.
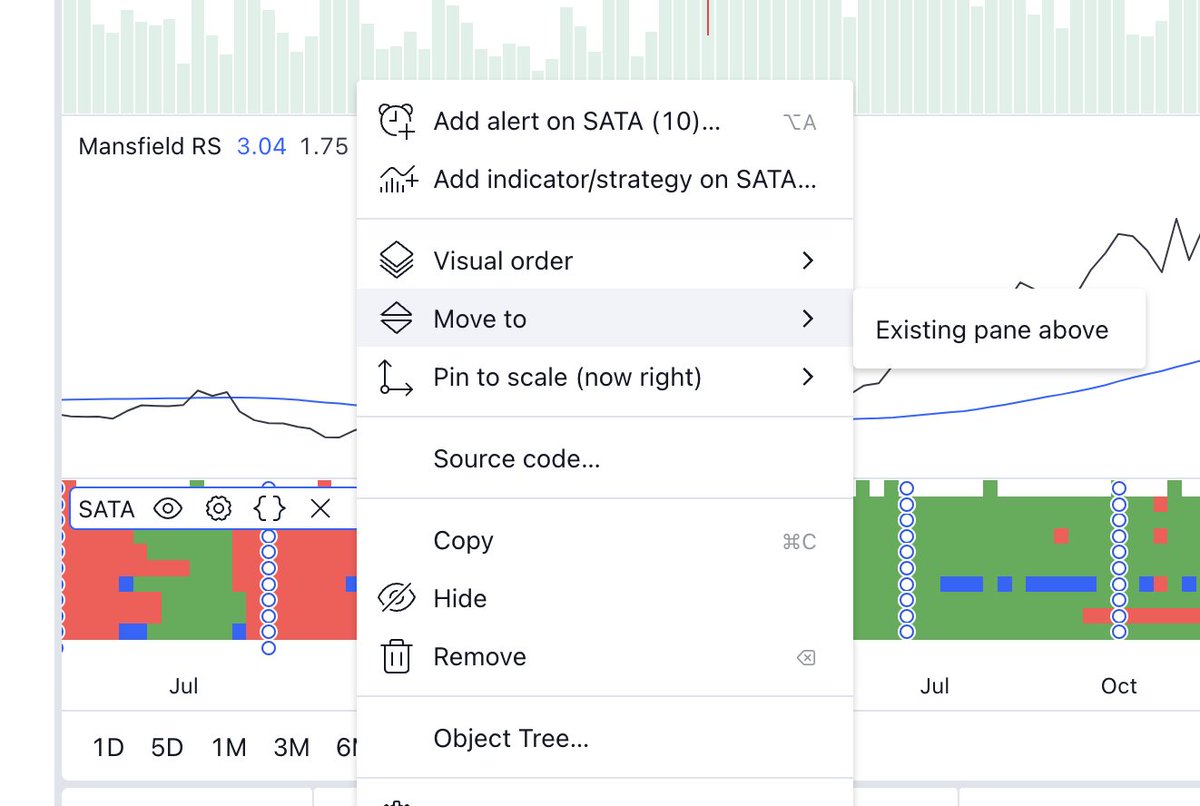
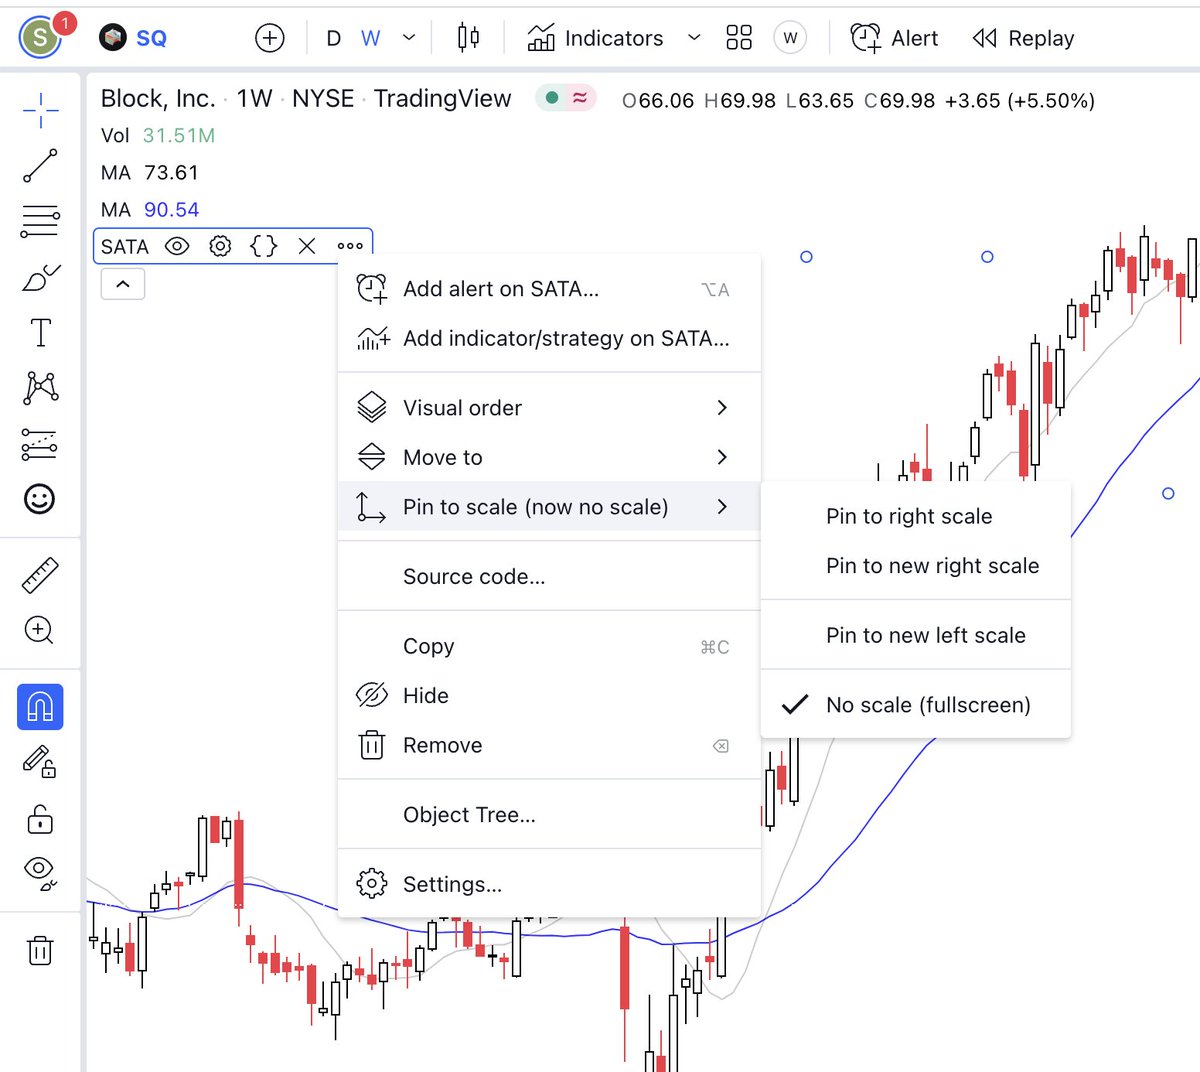
If you just want to display the score in the top left info under the MA values and hide the indicator:
1. Hover over the indicator name and then click the three dots ...
2. Select move to existing pane above.
3. Select the three dots ... again
4. Pin to scale > No scale
1. Hover over the indicator name and then click the three dots ...
2. Select move to existing pane above.
3. Select the three dots ... again
4. Pin to scale > No scale
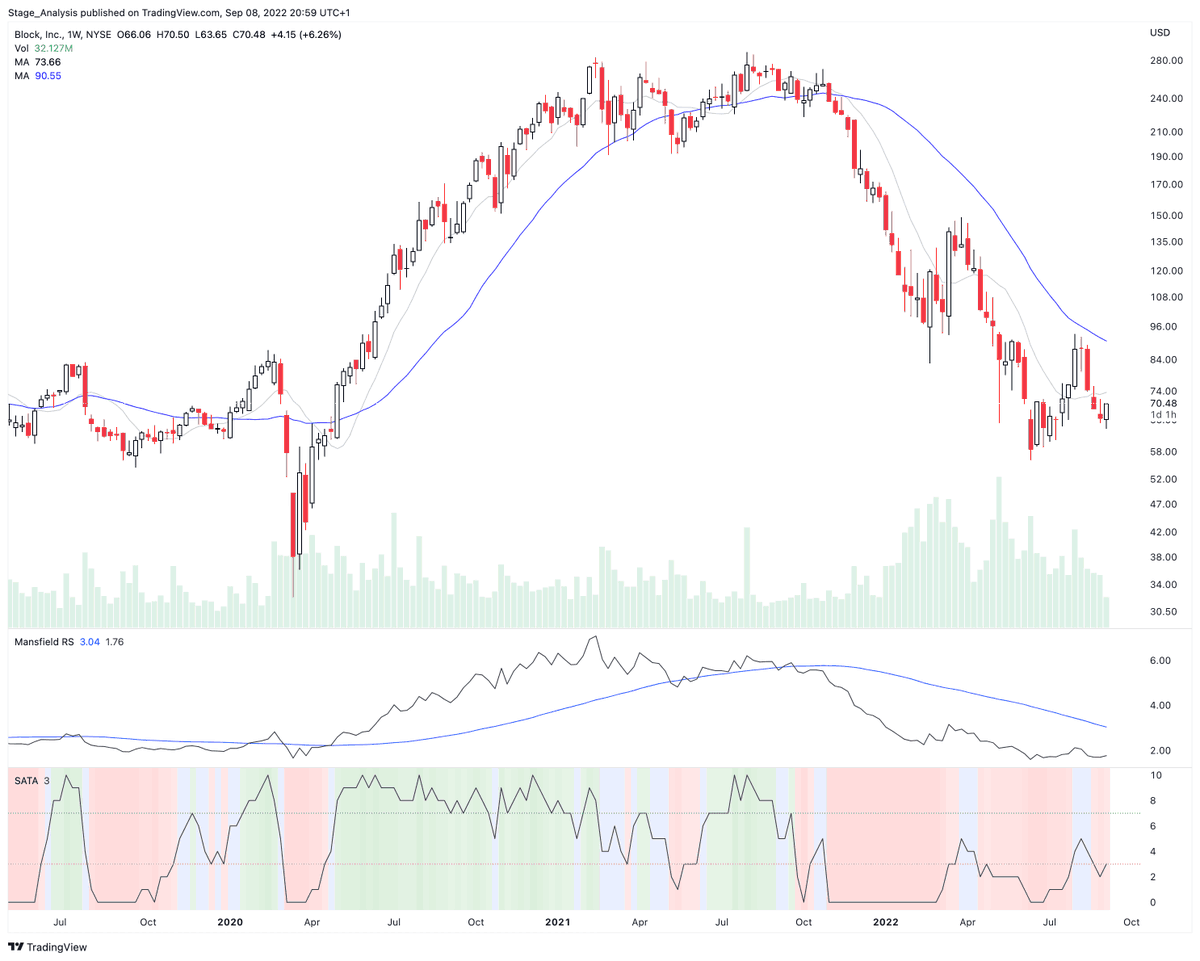
One more update for those that want to get really crazy. Is that I've added the background colour options so that you can see the SATA scores behind the chart as tints.
Best score: SATA 10 = darkest green tint
Worst score: SATA 0 = darkest red tint
#indicator #StanWeinstein
Best score: SATA 10 = darkest green tint
Worst score: SATA 0 = darkest red tint
#indicator #StanWeinstein

Final option is to use it as the oscillator version with the coloured background tints on the indicator instead.
Loading suggestions...