

@InvestmentTalkk It's interesting to look at the chart of $MSFT during the period he's discussing.
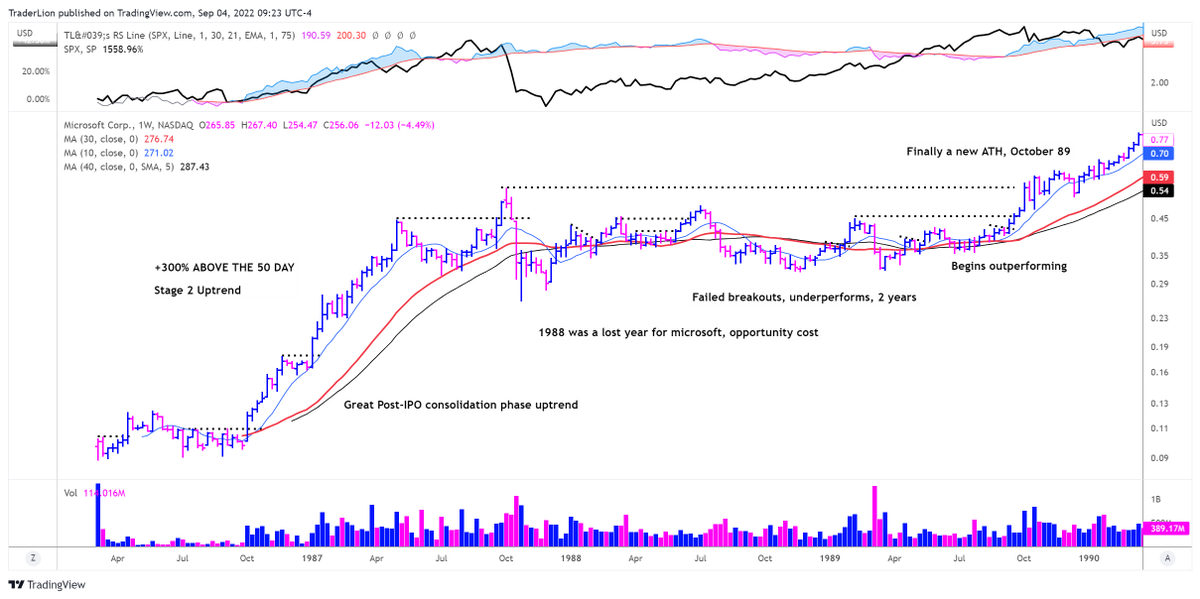
It had an amazing 300% run from a classic IPO consolidation but then made no progress for 2 years with 1988 being a lost year (for most stocks in general after the crash)
It had an amazing 300% run from a classic IPO consolidation but then made no progress for 2 years with 1988 being a lost year (for most stocks in general after the crash)
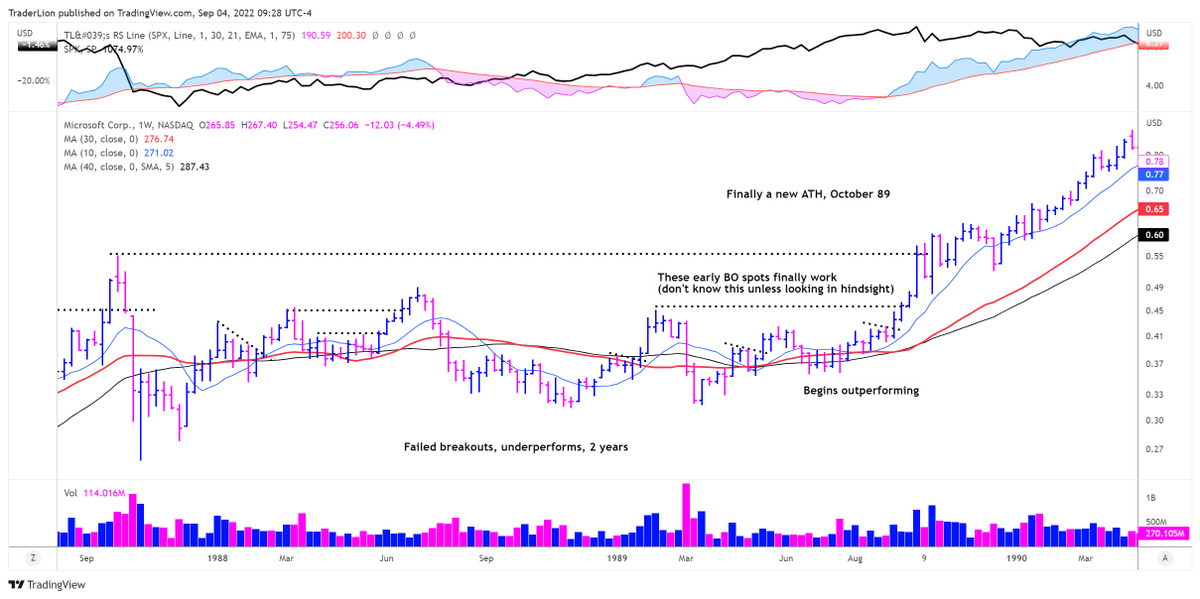
@InvestmentTalkk During the 2 year period I see a lot of early breakout spots where I could/likely would have been sucked in, none of them produced meaningful moves.
The true next move beings in the fall of 89 when the stock finally makes a new all time high.
The Stage 2 uptrend begins 9/11/89
The true next move beings in the fall of 89 when the stock finally makes a new all time high.
The Stage 2 uptrend begins 9/11/89
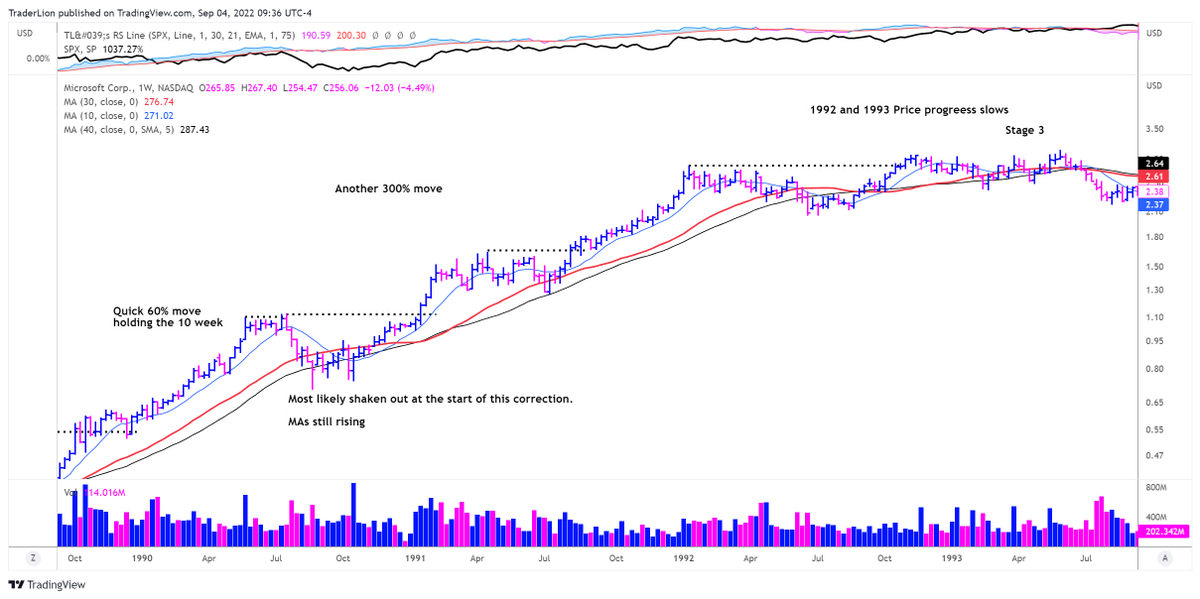
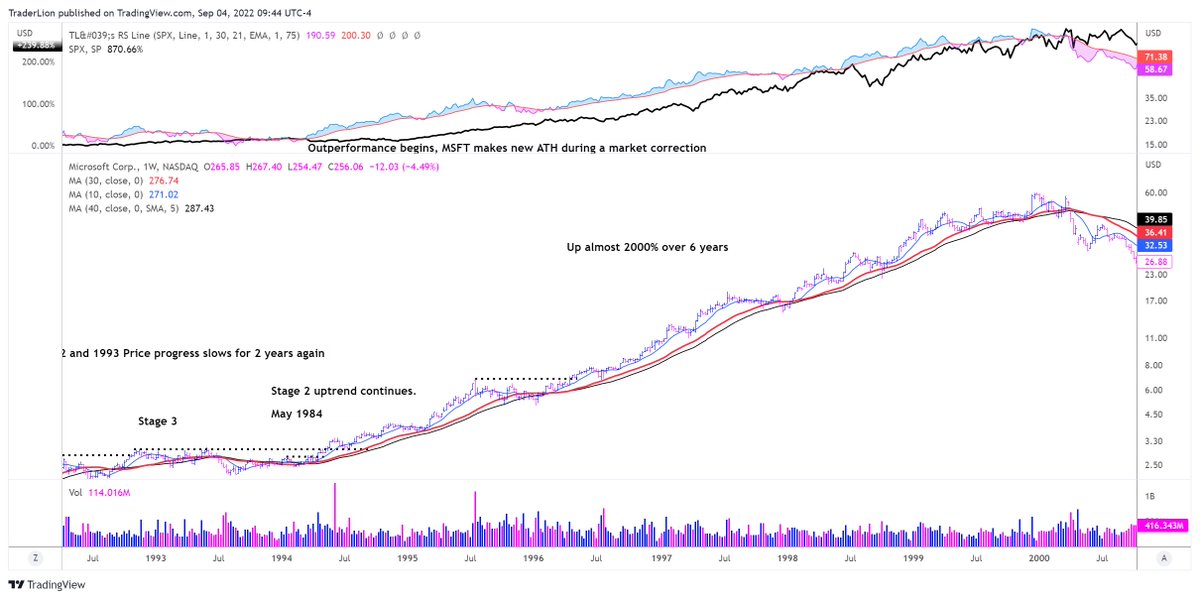
@InvestmentTalkk This breakout started another excellent run of 300% until price progress slowed in 1992 1993.
@InvestmentTalkk The stock was stagnant for 2 years until it started outperforming the market in March 1984 and broke out into a new Stage 2 amid a market correction
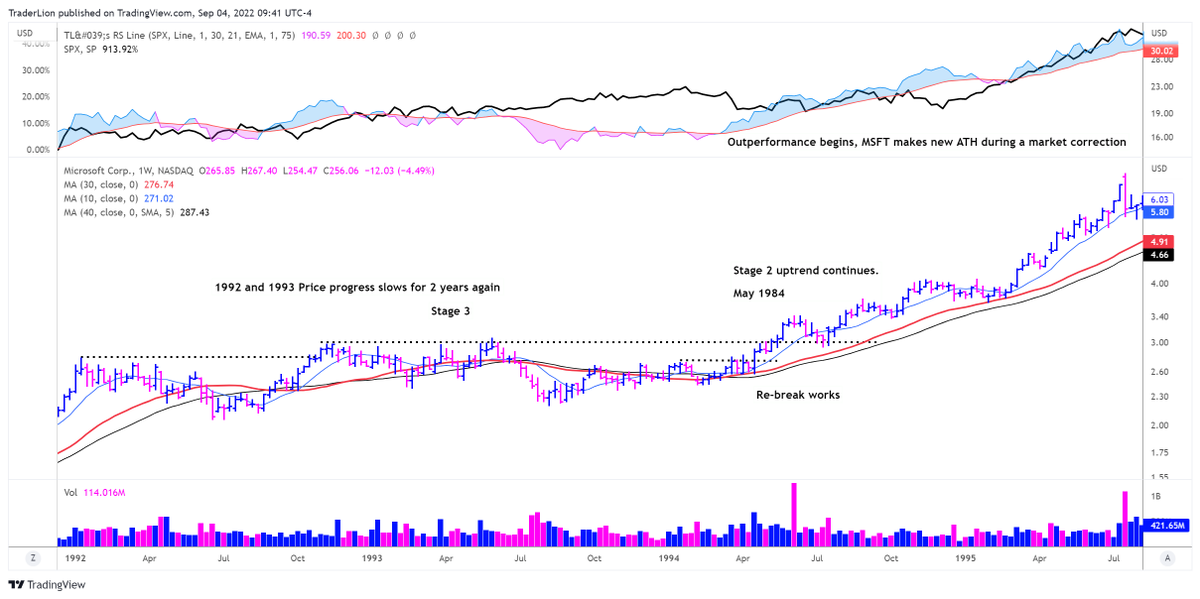
@InvestmentTalkk This breakout led to a massive move of 2000% over 6 years. The market itself was of course a huge driving factor during this time.
During the strongest moves after new base breakouts, it held the 10 week
During the strongest moves after new base breakouts, it held the 10 week
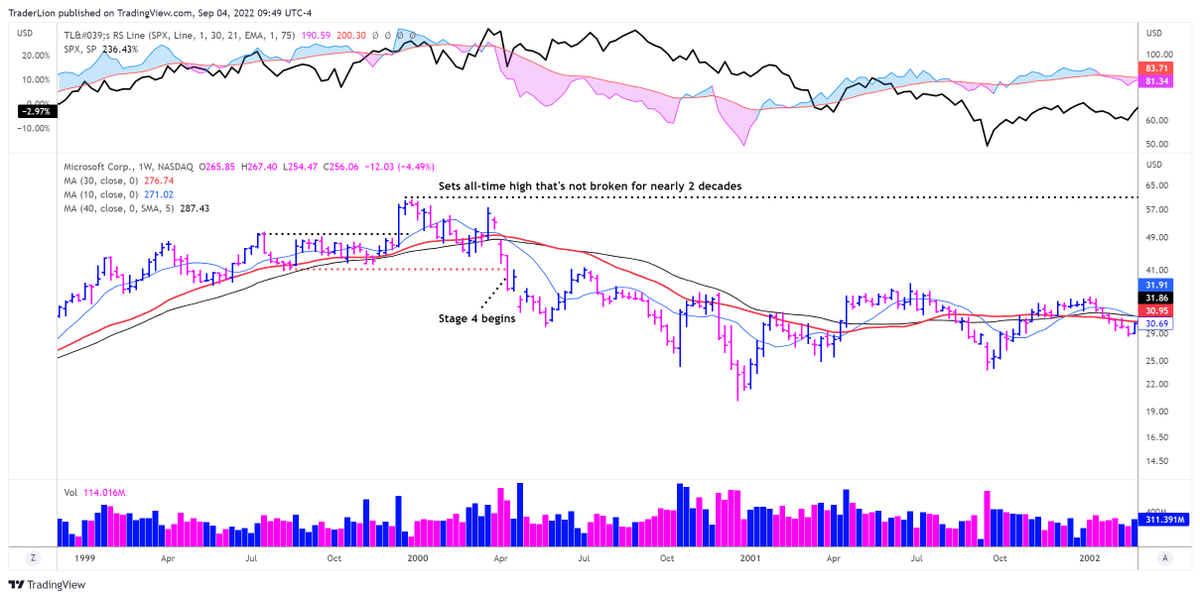
@InvestmentTalkk The top occurred along with most stocks.
MSFT had a breakout that failed in Jan 2000, then a gap below the long term MAs in April 2000, and the Stage 4 also began in April.
That All time high was not broken until 2016.
MSFT had a breakout that failed in Jan 2000, then a gap below the long term MAs in April 2000, and the Stage 4 also began in April.
That All time high was not broken until 2016.
Loading suggestions...