

Here is a thread on Naked Short Straddles vs Ironfly.
If you find this informative, do retweet.
We will discuss different aspects regarding
* Hedging Cost
* Backtest Data
* Probability of Market Movement
* Margins and Charges
(1/n)
If you find this informative, do retweet.
We will discuss different aspects regarding
* Hedging Cost
* Backtest Data
* Probability of Market Movement
* Margins and Charges
(1/n)
We are going to discuss from the positional trade aspect assuming that the hedging is always done at the breakevens of the naked ironfly
In Bank Nifty 15th Sep Expiry 39500 Short Straddle, the price of CE is Rs. 520 and price of PE is Rs. 480, a total of 1000 Points
(2/n)
In Bank Nifty 15th Sep Expiry 39500 Short Straddle, the price of CE is Rs. 520 and price of PE is Rs. 480, a total of 1000 Points
(2/n)
When we buy the hedges at Breakevens (38500 & 40500), 38500 PE is trading at Rs. 175 and 40500 CE is trading at Rs. 150
The total hedging cost would be 175+150 = 325/ Week
In a year we would pay close to 325 X 52 = 16900 points as hedging cost
(3/n)
The total hedging cost would be 175+150 = 325/ Week
In a year we would pay close to 325 X 52 = 16900 points as hedging cost
(3/n)
16900 points is more than 40% of Banknifty, that means even if Banknifty falls 40% overnight, it would cost us the same amount that we end up paying for hedge.
Is paying so much for a hedge really worth it?
We are going to do backtesting using @stockmock_in to find out
(4/n)
Is paying so much for a hedge really worth it?
We are going to do backtesting using @stockmock_in to find out
(4/n)
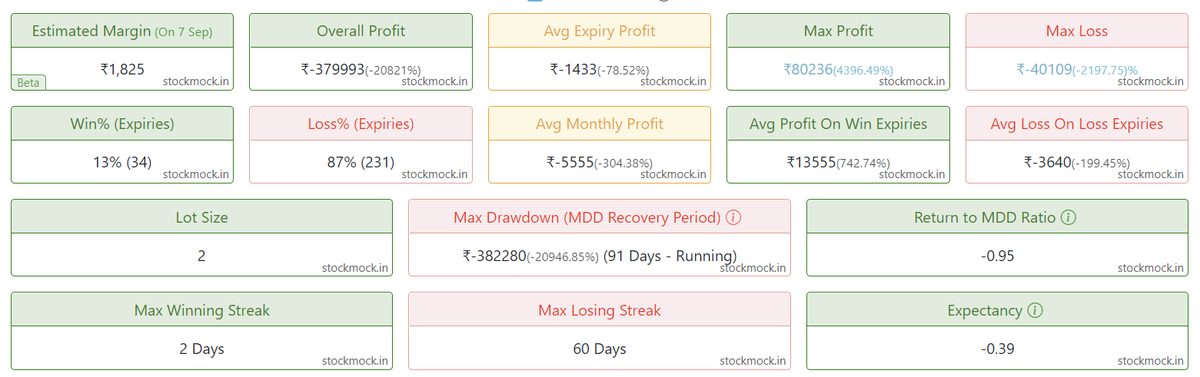
With 1 lot, the hedge legs gave a loss of 3.7L, there is 87% chance that the hedge legs will lose money.
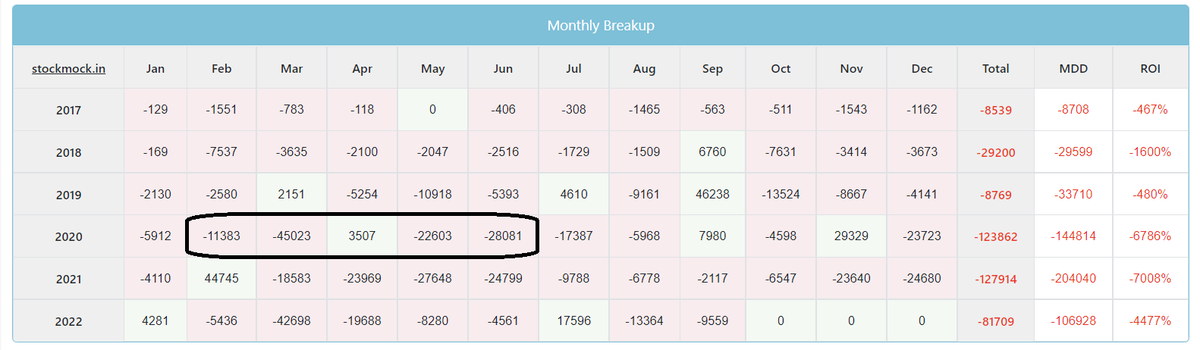
When we look at the monthly profits, during the real blackswan event (Covid), when hedge legs are expected to give profits, they have given the biggest monthly loss
(5/n)
When we look at the monthly profits, during the real blackswan event (Covid), when hedge legs are expected to give profits, they have given the biggest monthly loss
(5/n)
We will now look at the simple short straddles without hedge and its performance
Over the last five years, a simple naked short straddle has given a 4.75L profit with a return of 267% on the total margin, with a profit probability of 63%
(6/n)
Over the last five years, a simple naked short straddle has given a 4.75L profit with a return of 267% on the total margin, with a profit probability of 63%
(6/n)
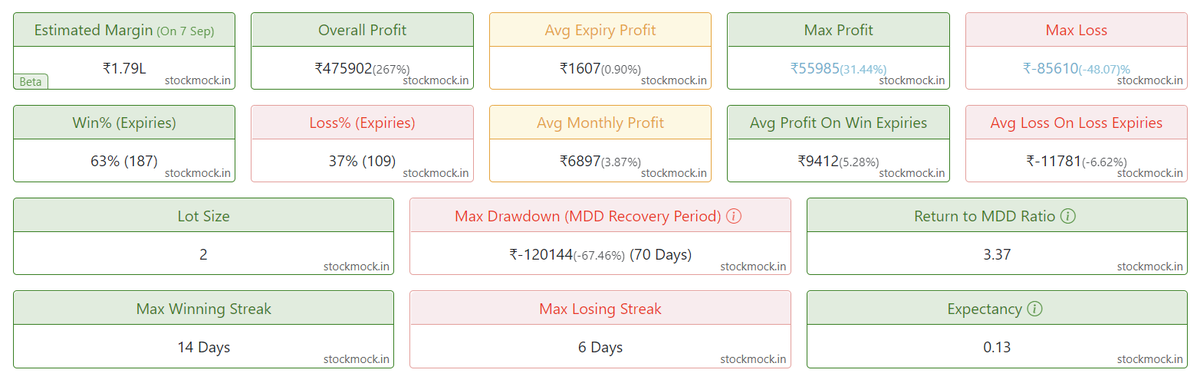
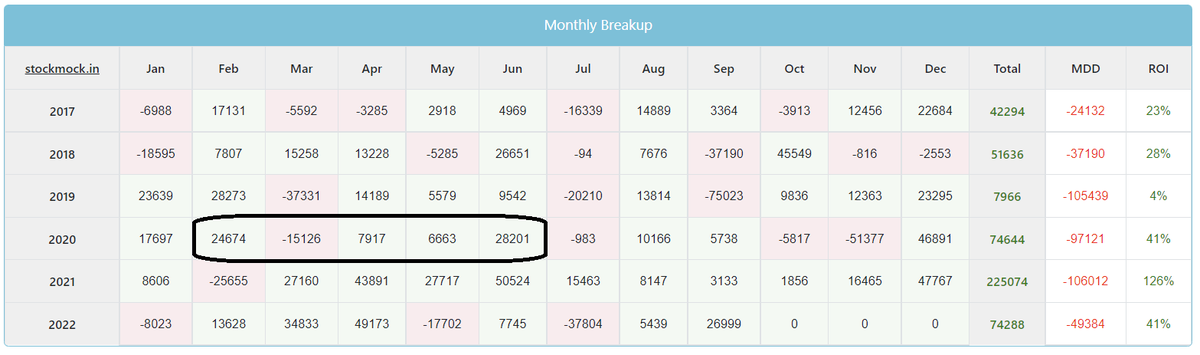
Even during the blackswan events like Covid, naked short straddles have given profits.
The main reason is because of High IV, the premiums will be pricing in such a move and that’s a reason why hedge legs have lost money and straddles have made money.
(7/n)
The main reason is because of High IV, the premiums will be pricing in such a move and that’s a reason why hedge legs have lost money and straddles have made money.
(7/n)
Now we combine both and compare the performance of Ironfly vs Naked Short Straddle.
One lot Ironfly requires a margin of 70k, but the overall return is around 150% in the last 5 years. This also comes with a profit probability of 54%
(8/n)
One lot Ironfly requires a margin of 70k, but the overall return is around 150% in the last 5 years. This also comes with a profit probability of 54%
(8/n)
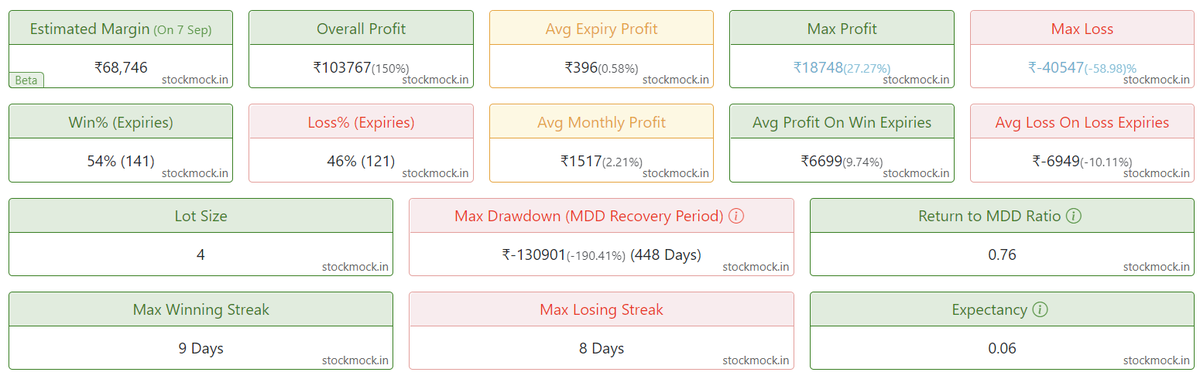
When we compare the images from the last two posts, we see that in terms of total returns, percentage returns, profit probability, Return to MDD and Expectancy, the naked short straddles have performed petter than an ironfly.
Now we will try to understand why this happens
(9/n)
Now we will try to understand why this happens
(9/n)
The simple answer is the hedges are expensive. I will explain why I call them expensive
Here is a table comparing the gap up or down and expected loss from the gap for 1 Lot
1%: Nil
2%: -2,500 (100pts)
3%: -11,500 (460pts)
5%: -30,000 (1200pts)
10%: -80,000 (3000pts)
(10/n)
Here is a table comparing the gap up or down and expected loss from the gap for 1 Lot
1%: Nil
2%: -2,500 (100pts)
3%: -11,500 (460pts)
5%: -30,000 (1200pts)
10%: -80,000 (3000pts)
(10/n)
The data presented above regarding the expected loss is based on expected profits from option payoff graphs
Now we will see the probability of the Gap openings based on the historical data of BankNifty (We have used data from 2017)
2%: 3.2%
3%: 1.9%
5%: 0.8%
10%: 0.4%
(11/n)
Now we will see the probability of the Gap openings based on the historical data of BankNifty (We have used data from 2017)
2%: 3.2%
3%: 1.9%
5%: 0.8%
10%: 0.4%
(11/n)
As we now know the probability of an event happening and the loss due to the event. We will calculate the expected loss and compare it with the loss due to hedging.
100pt(3.2%) + 460pt(1.9%) + 1200pt(0.8%) + 3000pt(0.4%)
Expected loss= 2784pts / year
(12/n)
100pt(3.2%) + 460pt(1.9%) + 1200pt(0.8%) + 3000pt(0.4%)
Expected loss= 2784pts / year
(12/n)
Expected loss due to gap up gap down = 2784pts/year
The total hedging cost = 16900pts/year
The hedges might recover some costs for us when the expire ITM, but the historical data and backtesting has shown that the cost recovered is much lesser than the hedging cost paid
(13/n)
The total hedging cost = 16900pts/year
The hedges might recover some costs for us when the expire ITM, but the historical data and backtesting has shown that the cost recovered is much lesser than the hedging cost paid
(13/n)
Hedging will increase the total brokerage cost by close to 60%.
Entering 2 legs v/s 4 legs will result in double the brokerage, on top of which the transaction charges on the additional hedge legs will be close to 50% higher.
(14/n)
Entering 2 legs v/s 4 legs will result in double the brokerage, on top of which the transaction charges on the additional hedge legs will be close to 50% higher.
(14/n)
Initially when we saw the total returns on the margin deployed was 267% over 5 years for naked short compared to 150% for ironfly.
In the long run due to the charges, the performance of ironfly will further deteriorate (as per the data: 267% vs 150%)
(15/n)
In the long run due to the charges, the performance of ironfly will further deteriorate (as per the data: 267% vs 150%)
(15/n)
The only issue with the naked short straddles is not the big gap moves, it is to have the right psychology to handle the MTM.
The solution to this is to have the right position size, we would recommend
8-10 Lakh / Lot (Overnight/ Positional)
2-3 Lakh / Lot (Intraday)
(16/n)
The solution to this is to have the right position size, we would recommend
8-10 Lakh / Lot (Overnight/ Positional)
2-3 Lakh / Lot (Intraday)
(16/n)
We have also made a detailed video on the same, you can check it out using the link below.
youtu.be
Do let us know your thoughts on the same in the comment section
Note: Prices are as on 08-Sept-22 08:00 AM
If you found this thread useful, please Retweet
youtu.be
Do let us know your thoughts on the same in the comment section
Note: Prices are as on 08-Sept-22 08:00 AM
If you found this thread useful, please Retweet
Loading suggestions...