

Fleshing out my thoughts on the scariest macroeconomics paper of 2022: "Understanding U.S. Inflation During the COVID Era" by Larry Ball, Daniel Leigh, & Prachi Mishra. This 🧵 expands on the broader points I made in my @WSJopinion. wsj.com
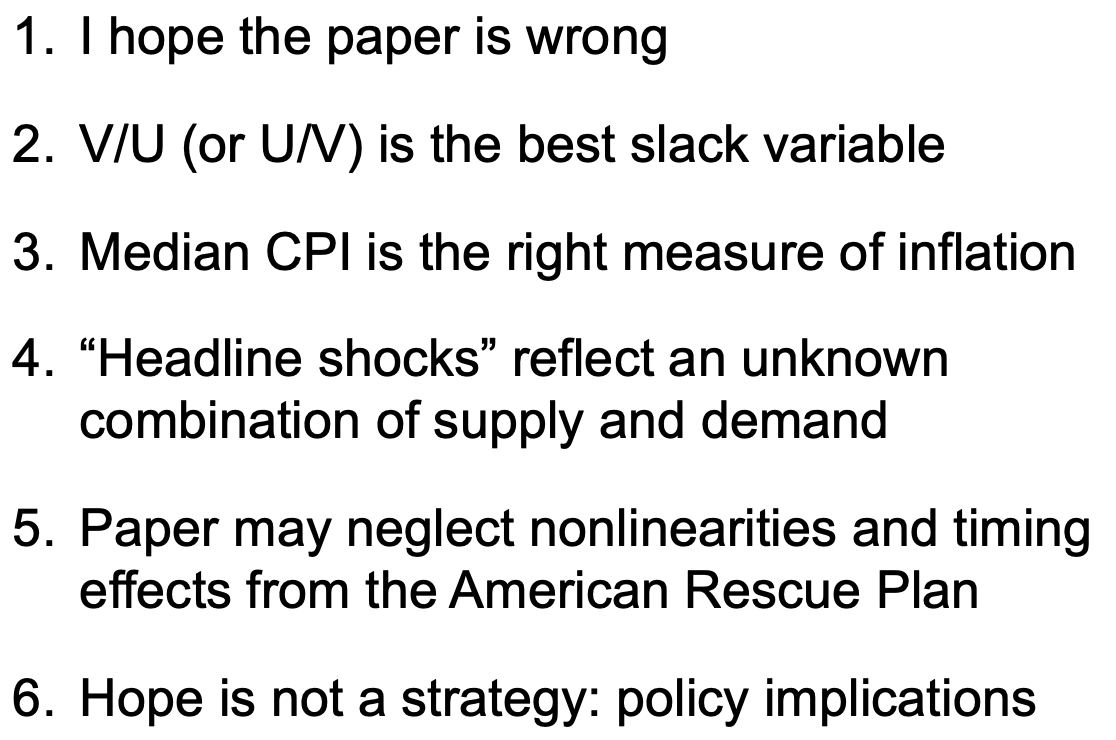
I was a discussant for the paper at the Brookings Papers on Economic Activity earlier today. You can find the paper and my discussion slides here. Here is the outline of my comments.
dropbox.com brookings.edu
dropbox.com brookings.edu
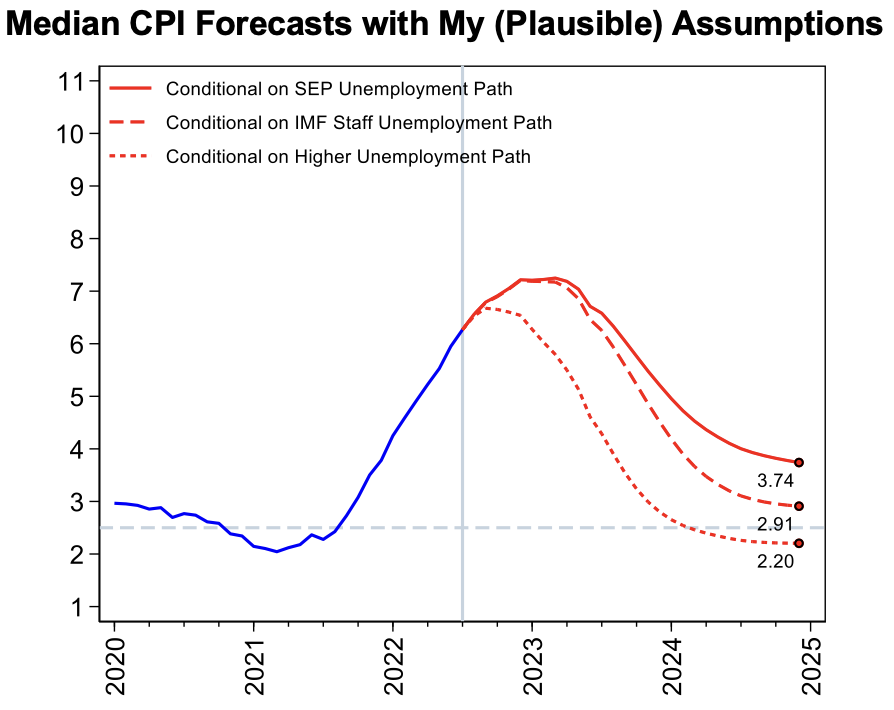
1. I HOPE THE PAPER IS WRONG. Ball, Leigh and Mishra do not have a forecast or a preferred scenario, instead showing a range. Here is the range of inflation outcomes assuming the June median FOMC path (max unemployment = 4.1%) and assuming 7.5% unemployment.
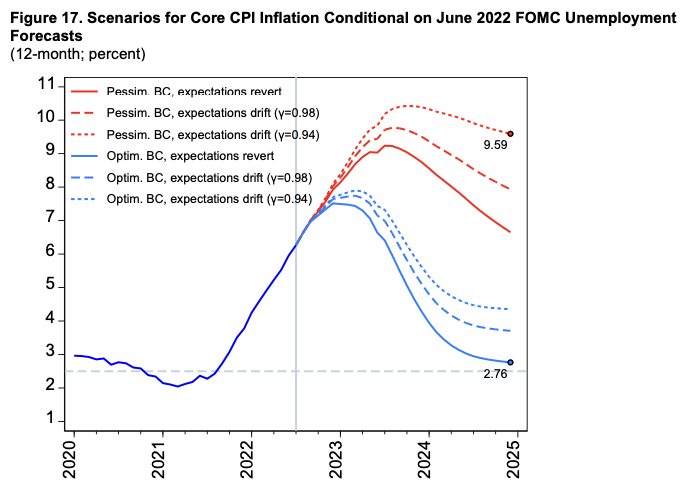
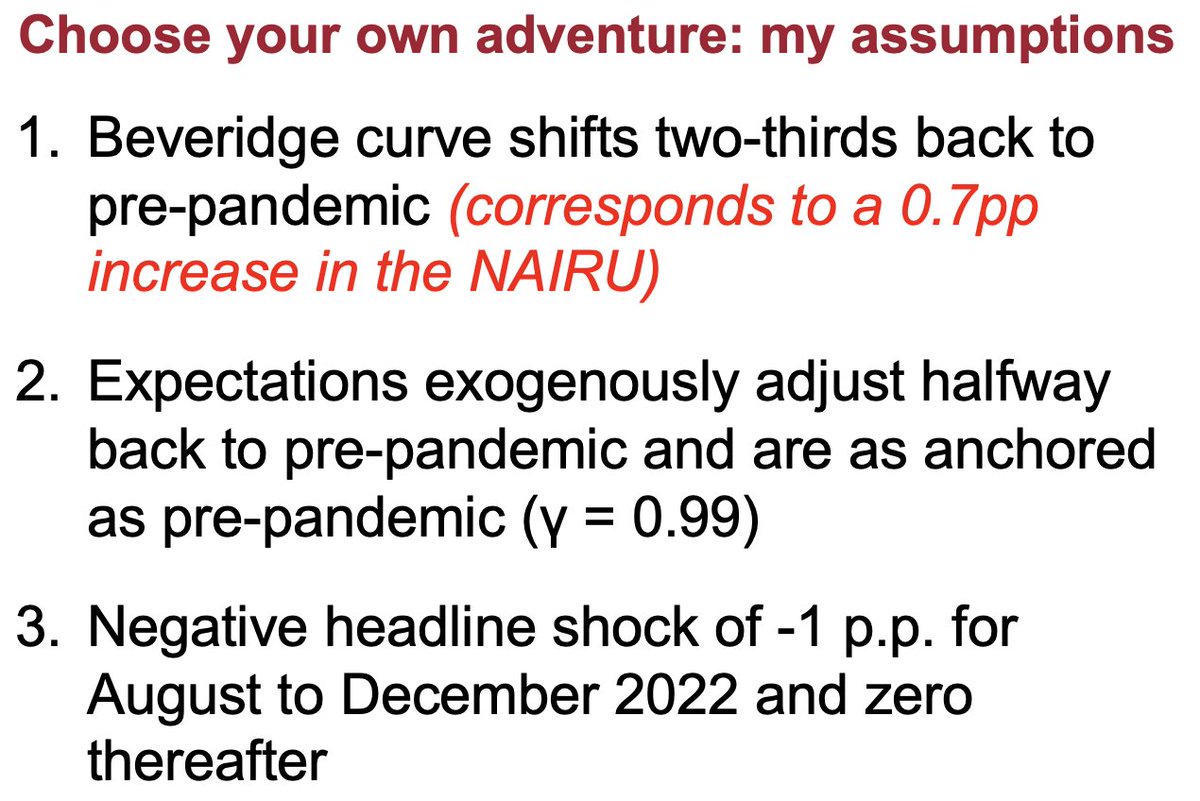
Their paper is "choose your own adventure" format with lots of choices about parameters. I re-run their model using what I think are reasonable parameters (and more optimistic than their midpoint assumption), most importantly Beverage Curve shifts back two-thirds to pre-pandemic.
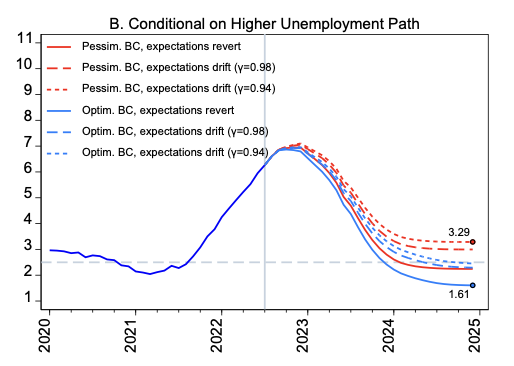
Under these scenarios if the unemployment rate rises to 4.1% then inflation will stay above 3%. If it rises to 7.5% then inflation will slightly undershot the Fed's target.
The unemployment rate needed to hit the Fed's target in this scenario is 6.4%.
The unemployment rate needed to hit the Fed's target in this scenario is 6.4%.

2. V/U (OR U/V) IS THE RIGHT SLACK VARIABLE.
Willie Powell and I have written about this before, in general comparing vacancies to unemployment gives you better predictions for inflation. It's also more stable over time than just using the unemployment rate.
Willie Powell and I have written about this before, in general comparing vacancies to unemployment gives you better predictions for inflation. It's also more stable over time than just using the unemployment rate.
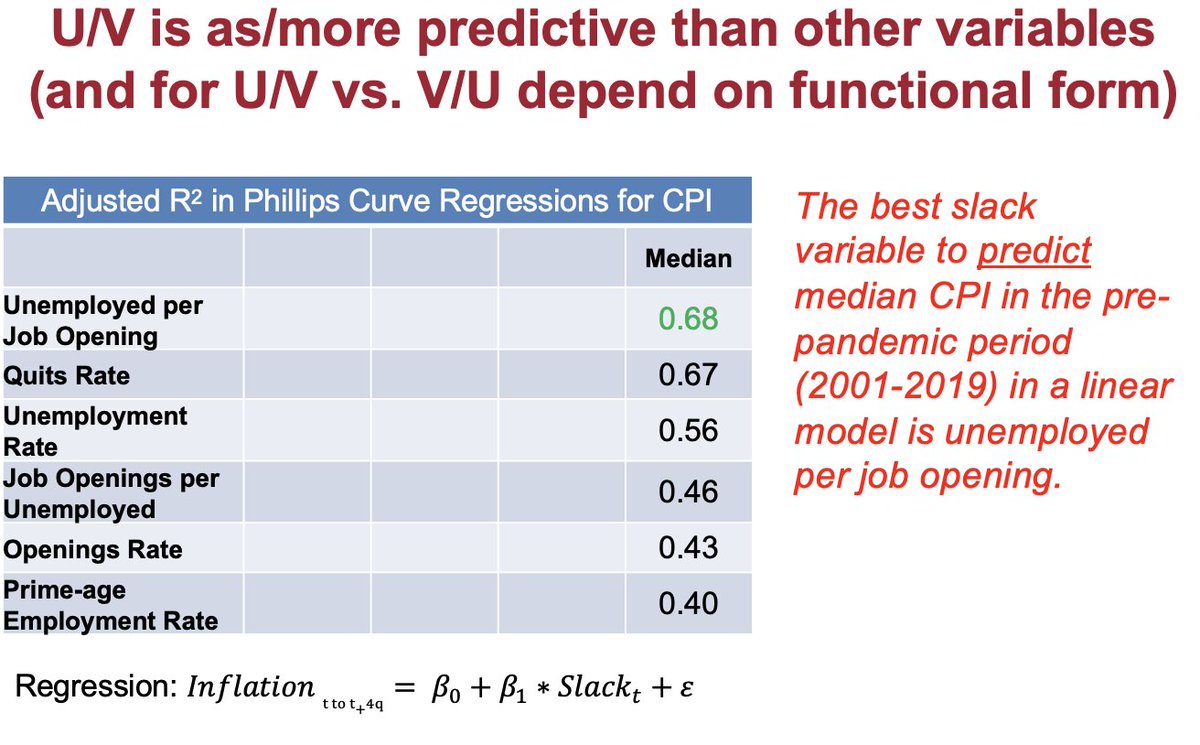
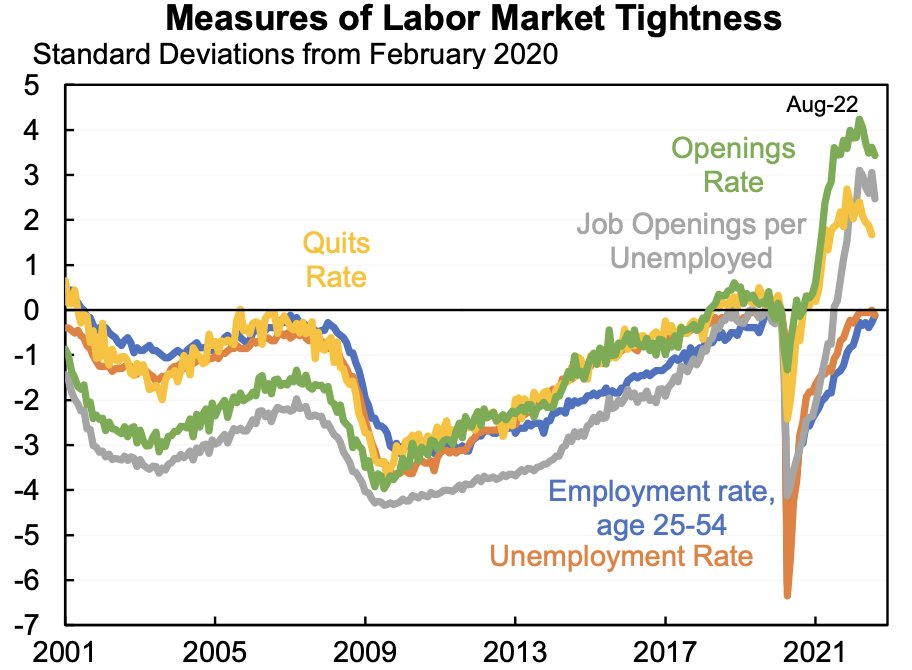
This matters because V/U is extremely high right now, well above what it has ever been prior to the pandemic.
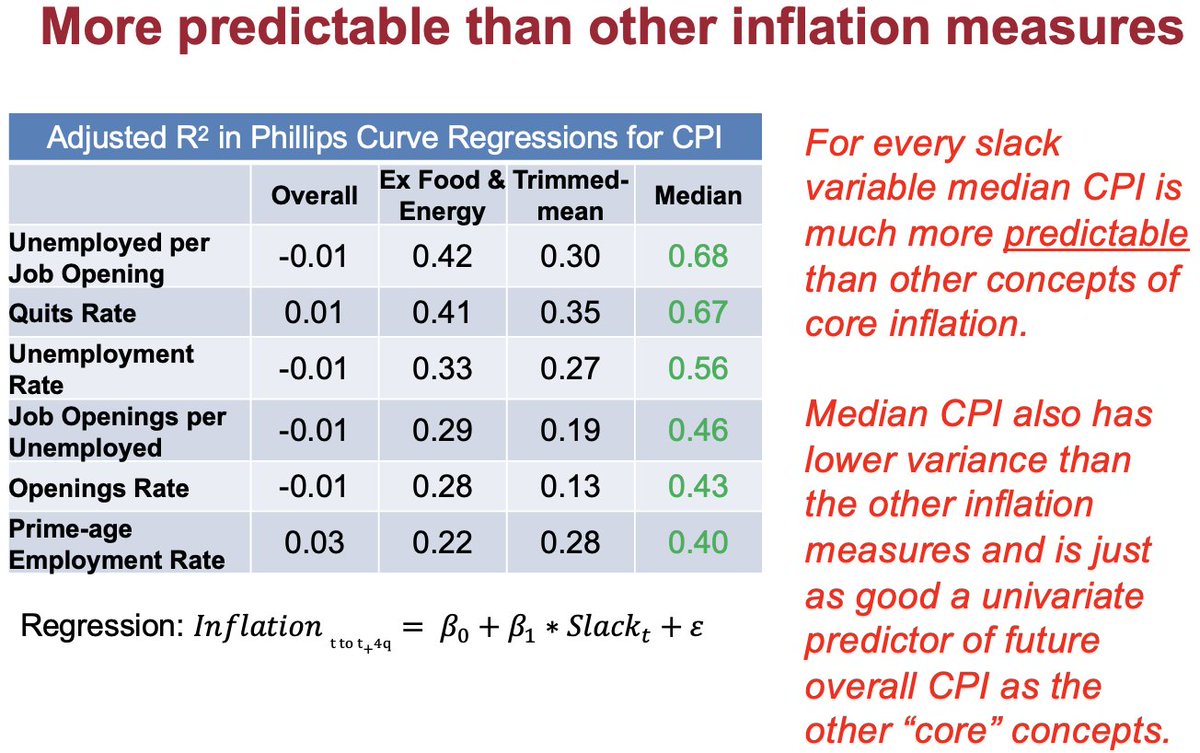
3. MEDIAN CPI IS THE RIGHT INFLATION MEASURE
The authors focus on median CPI (as opposed to the usual mean), which throws out all outliers. I had been semi-skeptical but their results, papers they sent me back to, and...
The authors focus on median CPI (as opposed to the usual mean), which throws out all outliers. I had been semi-skeptical but their results, papers they sent me back to, and...
...My looking at lots and lots of Phillips curves and median inflation is *much* more predictable than other concepts of core inflation. It seems like this is closer to what moves with demand/labor market than anything else.
Note that even while core inflation (excluding food and energy) has stabilized, median inflation has not--it is rising even faster than before.

4. HEADLINE SHOCKS REFLECT SUPPLY AND DEMAND
The authors rely a lot on a variable called "headline shocks" which is the difference between mean and median CPI. They find it matters a lot (by definition). Question is how to interpret it: I would argue a lot is demand.
The authors rely a lot on a variable called "headline shocks" which is the difference between mean and median CPI. They find it matters a lot (by definition). Question is how to interpret it: I would argue a lot is demand.
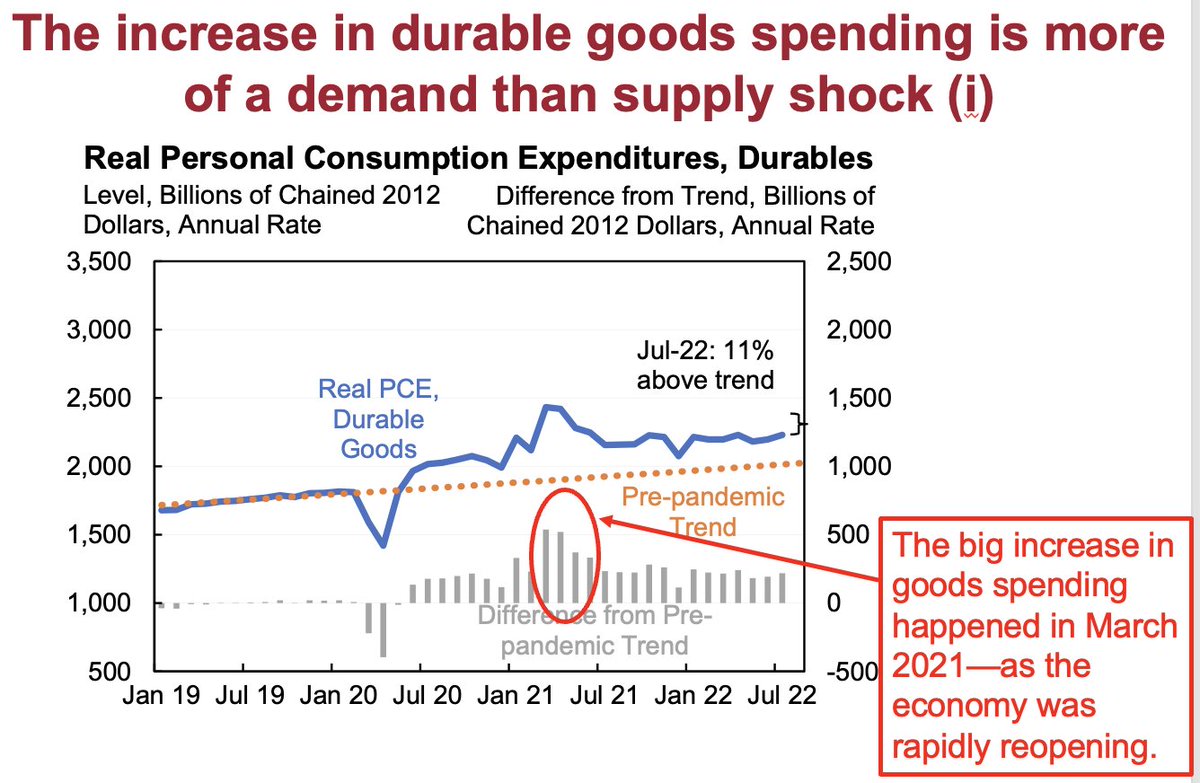
I've written about this a bunch before, see this thread for more. Short version: part of why there have been shortages, supply chain issues, backed up ports, etc., is that people were trying to buy a lot more than before.
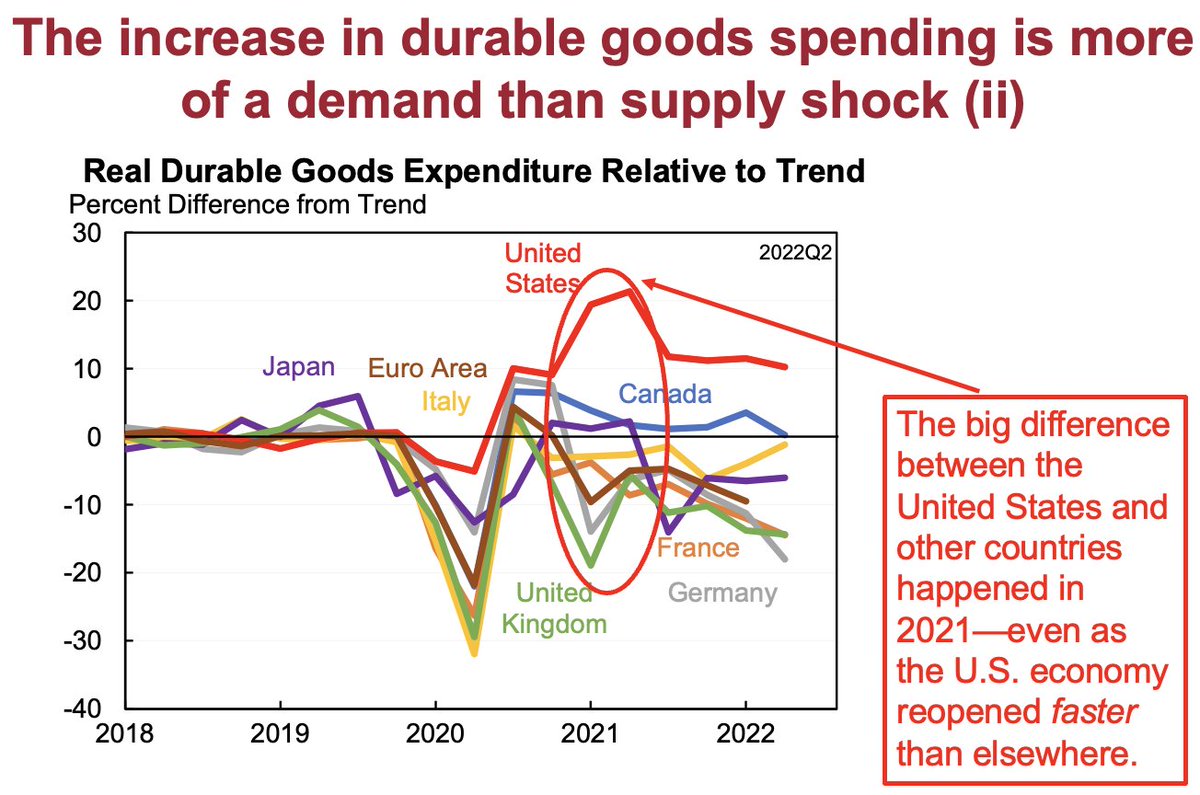
In particular, the increase in durable goods spending in 2021 happened as the economy was reopening, not as it was shutting down. And it happened in the United States not in other G7 economies.
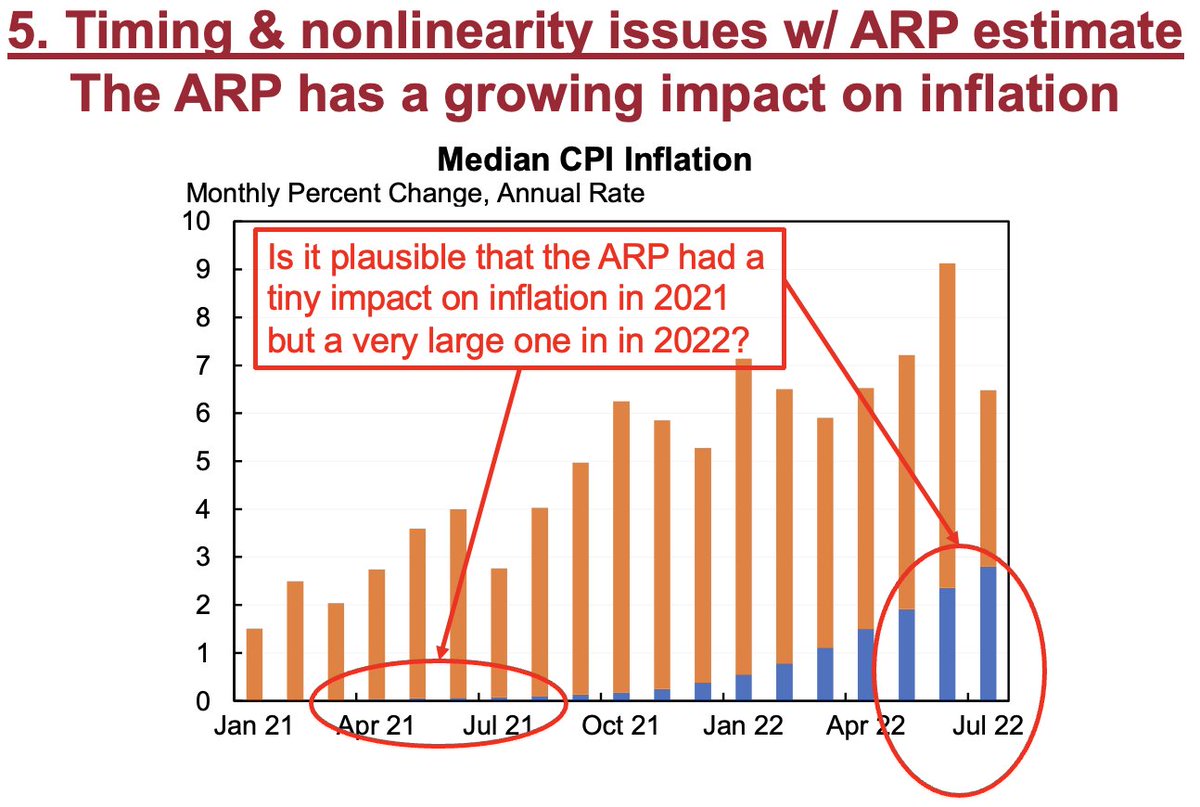
5. TIMING AND NONLINEARITY ISSUES W/ THE ARP ESTIMATE
The authors find that the ARP had a large effect on inflation in 2022 but only a small effect in 2021. This is because of their assumed lags: going from ARP to labor market to inflation, by construction, can't happen quickly.
The authors find that the ARP had a large effect on inflation in 2022 but only a small effect in 2021. This is because of their assumed lags: going from ARP to labor market to inflation, by construction, can't happen quickly.
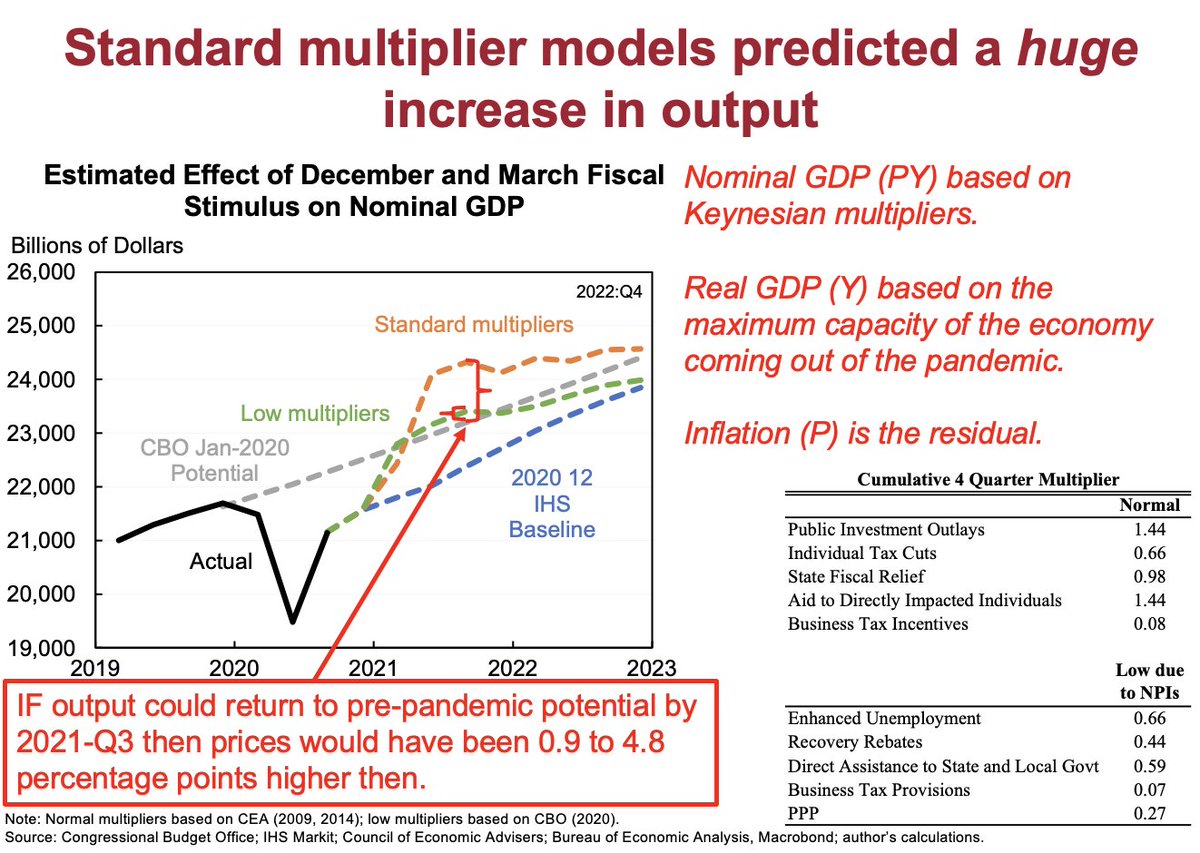
As I've written about before, I don't think the Phillips Curve is useful for modeling large abrupt changes like the ARP. Better to do: (1) multiplier to generate nominal GDP; (2) real GDP determined by capacity; and (3) prices are a residual.
6. HOPE IS NOT A STRATEGY: POLICY IMPLICATIONS
I hope they're wrong but policy shouldn't be based on hope. Policy implications:
(i) De-anchoring inflation expectations is costly so be aggressive, could save 3pp of extra unemployment.
I hope they're wrong but policy shouldn't be based on hope. Policy implications:
(i) De-anchoring inflation expectations is costly so be aggressive, could save 3pp of extra unemployment.
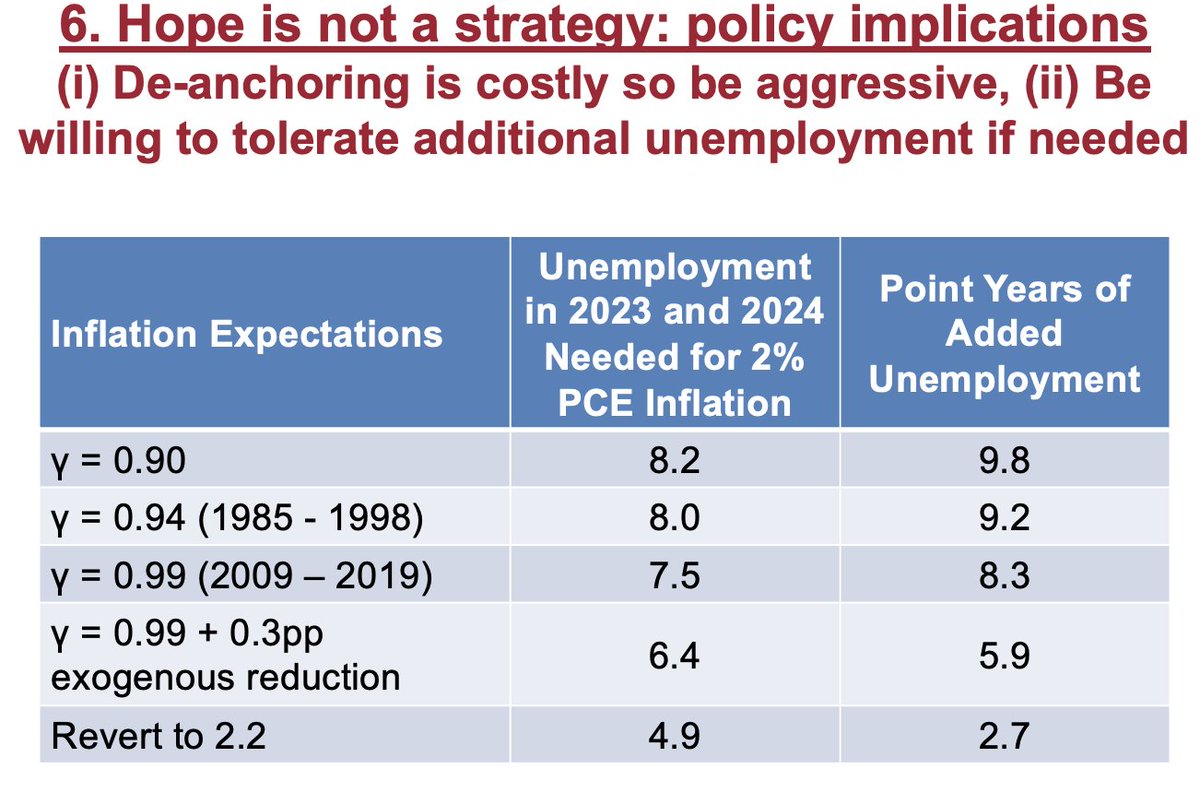
(ii) Be willing to tolerate unemployment. The Fed's goal should not be to raise the unemployment rate (or reduce vacancies), in fact the opposite is a goal. BUT, this suggests they may need to tolerate higher unemployment if they want to bring inflation down.
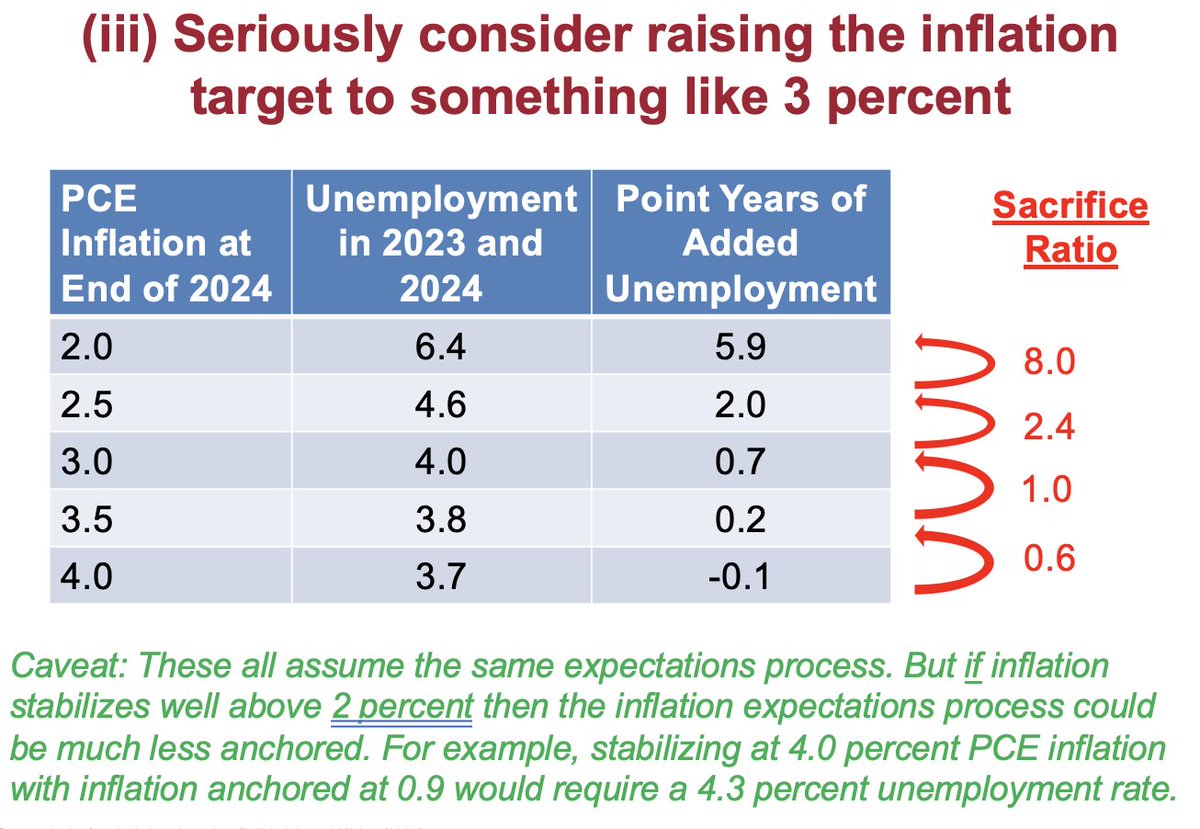
(iii) Seriously consider raising the inflation target to something like 3 percent
This one is tricky. On a blank slate a 3% target would be better than a 2% target. But shifting to that could deanchor expectations.
This one is tricky. On a blank slate a 3% target would be better than a 2% target. But shifting to that could deanchor expectations.
One consideration is that the implicit "sacrifice ratio" in their model is highly nonlinear. Lowering inflation from 4.0% to 3.5% costs 0.6 point-years of unemployment per 1pp of inflation.
It rises to 8.0 going from 2.5% to 2.0% inflation.
It rises to 8.0 going from 2.5% to 2.0% inflation.
In sum, policy shouldn't be based on how we hope the economy functions but how it does function. There is a *huge* amount of uncertainty. Maybe it will work out. Maybe it will be much scarier than what I had above (as some BPEA participants argued).
Here are links again to my @WSJopinion (with my interpretation / running of their model), the Ball-Leigh-Mishra paper, and my full slides. wsj.com brookings.edu dropbox.com
Loading suggestions...