

Major Strong Reversal Chart Pattern Thread 🧵🧵
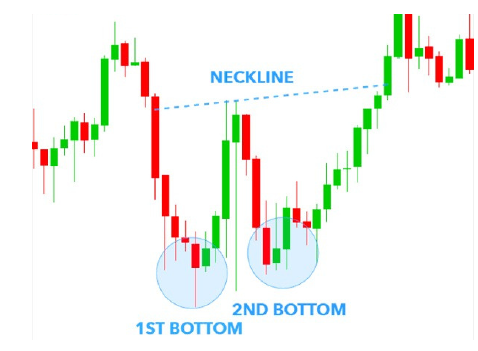
1) Double Bottom (Buy)
The double bottom pattern is a bullish reversal pattern that occurs at the bottom of a downtrend and signals that the sellers, who were in control of the price action so far, are losing momentum...
1) Double Bottom (Buy)
The double bottom pattern is a bullish reversal pattern that occurs at the bottom of a downtrend and signals that the sellers, who were in control of the price action so far, are losing momentum...
The pattern resembles the letter “W” due to the two-touched low and a change in the trend direction from a downtrend to an uptrend.
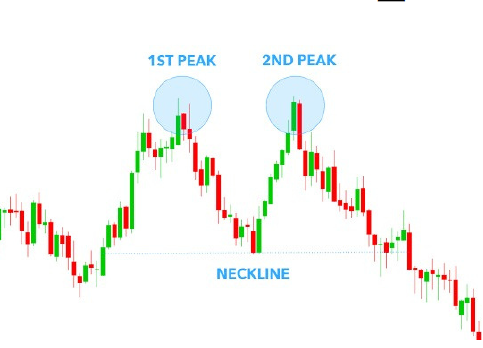
Double Top (Sell)
What Is a Double Top? A double top is an extremely bearish technical reversal pattern that forms after an asset reaches a high price two consecutive times with a moderate decline between the two highs...
What Is a Double Top? A double top is an extremely bearish technical reversal pattern that forms after an asset reaches a high price two consecutive times with a moderate decline between the two highs...
It is confirmed once the asset's price falls below a support level equal to the low between the two prior highs.
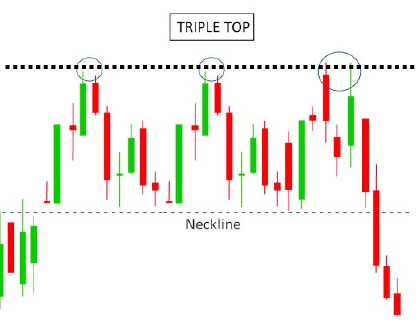
3) Triple Top (sell)
The triple top pattern occurs when the price of an asset creates three peaks at nearly the same price level. The area of the peaks is resistance. The
pullbacks between the peaks are called the swing lows.
The triple top pattern occurs when the price of an asset creates three peaks at nearly the same price level. The area of the peaks is resistance. The
pullbacks between the peaks are called the swing lows.
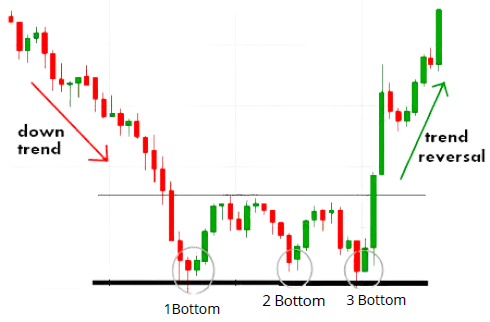
4) Triple Bottom(Buy)
A triple bottom is a visual pattern that shows the buyers taking control of the price action from the sellers (bears). A triple bottom is generally seen as three roughly equal lows bouncing off support followed by the price action breaching resistance.
A triple bottom is a visual pattern that shows the buyers taking control of the price action from the sellers (bears). A triple bottom is generally seen as three roughly equal lows bouncing off support followed by the price action breaching resistance.
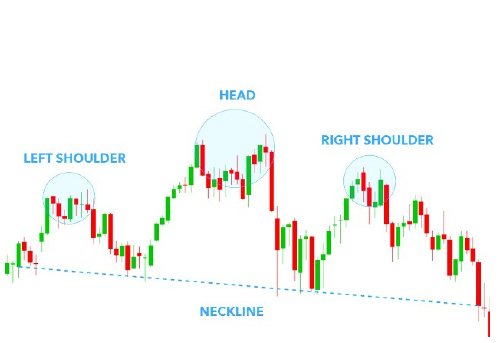
5) Head and Shoulders (Sell)
A head and shoulders pattern is a chart of the formation that appears as a baseline with three peaks, where the outside two are close in height and the middle is highest...
A head and shoulders pattern is a chart of the formation that appears as a baseline with three peaks, where the outside two are close in height and the middle is highest...
In technical analysis, a head and shoulders pattern describes a specific chart formation that predicts a bullish-to-bearish trend reversal.
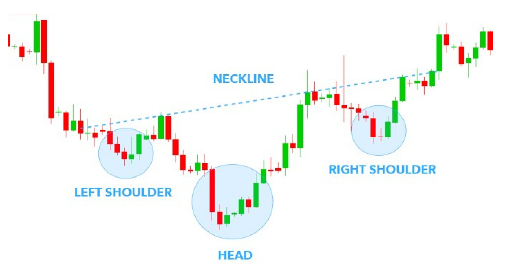
6) Inverse Head and Shoulders (Buy)
An inverse head and shoulders pattern is comprised of three component parts: After long bearish trends, the price falls to a trough and subsequently rises to form a peak...
An inverse head and shoulders pattern is comprised of three component parts: After long bearish trends, the price falls to a trough and subsequently rises to form a peak...
The price falls again to form a second trough substantially below the initial low and rises yet again.
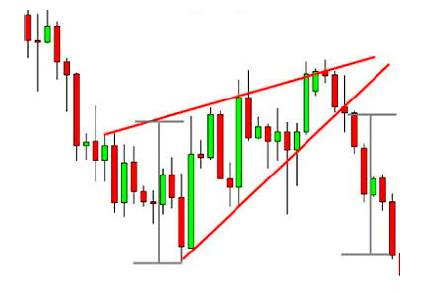
7) Rising Wedge (Sell)
A rising wedge is a technical chart pattern, suggesting a reversal pattern frequently seen in bear markets. This pattern shows up in charts when the price moves upward with pivot highs and lows converging toward a single point known as the apex...
A rising wedge is a technical chart pattern, suggesting a reversal pattern frequently seen in bear markets. This pattern shows up in charts when the price moves upward with pivot highs and lows converging toward a single point known as the apex...
When it is accompanied by declining volume, it can signal a trend reversal and a continuation of the bear market.
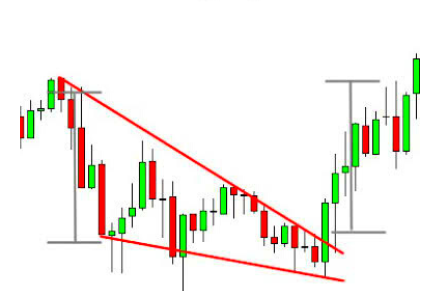
8) Falling Wedge ( Buy)
The falling wedge pattern is characterized by a chart pattern that forms when the market makes lower lows and lower highs with a contracting range. When this pattern is found in a downward trend...
The falling wedge pattern is characterized by a chart pattern that forms when the market makes lower lows and lower highs with a contracting range. When this pattern is found in a downward trend...
it is considered a reversal pattern, as the contraction of the range indicates the downtrend is losing steam.
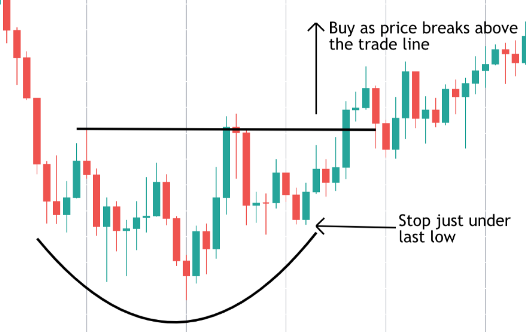
9) Rounding Bottom (Buy)
The rounding bottom is a bullish trend reversal chart pattern that signals the end of a downward trend and the beginning of a new upward trend. The Rounding Bottom is a long-term reversal pattern that is best suited for weekly charts.
The rounding bottom is a bullish trend reversal chart pattern that signals the end of a downward trend and the beginning of a new upward trend. The Rounding Bottom is a long-term reversal pattern that is best suited for weekly charts.
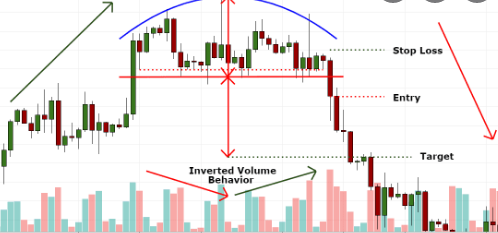
10) Rounding Top (Sell)
The “rounding top” is a reversal chart pattern that develops after a price incline. When it is graphed, it forms an inverted U Shape. Rounding tops are found at the end of extended uptrend trends and signify a reversal in long-term price movements...
The “rounding top” is a reversal chart pattern that develops after a price incline. When it is graphed, it forms an inverted U Shape. Rounding tops are found at the end of extended uptrend trends and signify a reversal in long-term price movements...
The rounding top pattern can last for days, weeks, months, or years with longer time frames. Usually, volumes traded are highest at the phase when the price is increasing and may increase more during the downtrend.
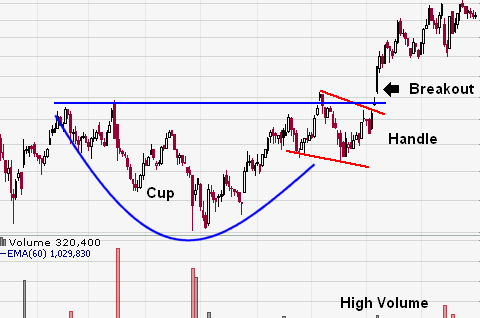
11) Cup and Handle (Buy)
The cup and handle pattern occurs in small time frames, like a one-minute chart, and in large time frames, like daily, weekly, and monthly charts. It occurs when a price wave is downward, followed by a stabilizing period...
The cup and handle pattern occurs in small time frames, like a one-minute chart, and in large time frames, like daily, weekly, and monthly charts. It occurs when a price wave is downward, followed by a stabilizing period...
Prices then rally to an approximately equal size to the prior decline. It creates a U-shape or the "cup" in the "cup and handles." The price then moves sideways or drifts downward within a channel, forming the handle. The handle may also take the form of a triangle...
The handle needs to be smaller than the cup. It should not drop into the lower half of the cup, and ideally, it should stay in the upper third.
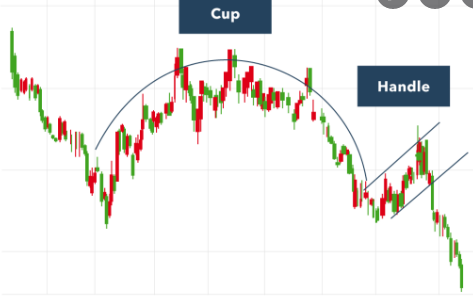
12) Inverted Cup & Handle (Sell)
Inverted Cup and Handle is an opposite version of the Cup and Handle pattern. It consists of a flipped-over u-shape cup with a handle. Volume should decrease in the handle part as well...
Inverted Cup and Handle is an opposite version of the Cup and Handle pattern. It consists of a flipped-over u-shape cup with a handle. Volume should decrease in the handle part as well...
The cup and Handle pattern and its inverted version can occur in any timeframes but longer-term formations have a higher accuracy rate in terms of pattern confirmation...
the Inverted Cup and Handle pattern works the same for Cup and Handle but market participants change places. The price starts moving upward and then stabilizes on the top, showing that bulls can’t drive the price further...
Sellers move the price to the previous low and face support level, trying to re-test it. It leads to a short consolidation period with decreased volume, forming a handle for the cup...
When the price breaks lower than the lowest point of the Inverted Cup and Handle pattern, the pattern is confirmed and the price continues moving downward.
To understand all these chart patterns correctly, I will also post the charts of the stock in which this pattern is being formed.
Please Retweet🔁 this thread to reach all the traders' friends.
Thank you.
Please Retweet🔁 this thread to reach all the traders' friends.
Thank you.
Loading suggestions...