

🧵 How to use RSI Thread 🧵
How to use RSI while trading stocks such as $SPY $AAPL $TSLA $AMZN etc…
RSI Divergence is a Key Tool/Strategy to see if a trend is changing! 📉📈
How to use RSI while trading stocks such as $SPY $AAPL $TSLA $AMZN etc…
RSI Divergence is a Key Tool/Strategy to see if a trend is changing! 📉📈
The relative strength index is a technical indicator used in the analysis of financial markets. It is intended to chart the current and historical strength or weakness of a stock or market based on the closing prices of a recent trading period. ~ WikiPedia
A RSI of 30 and less is considered oversold and a RSI of 70+ is considered overbought. This does not mean the Stock Price and RSI will not go lower or high if above or below those ranges.
RSI Divergence W/ Example 🚨
If a chart has a RSI divergence then the relative strength index (RSI) on the chart has lower highs when price is at a higher high or the RSI makes higher lows when price makes new lower lows.
If a chart has a RSI divergence then the relative strength index (RSI) on the chart has lower highs when price is at a higher high or the RSI makes higher lows when price makes new lower lows.
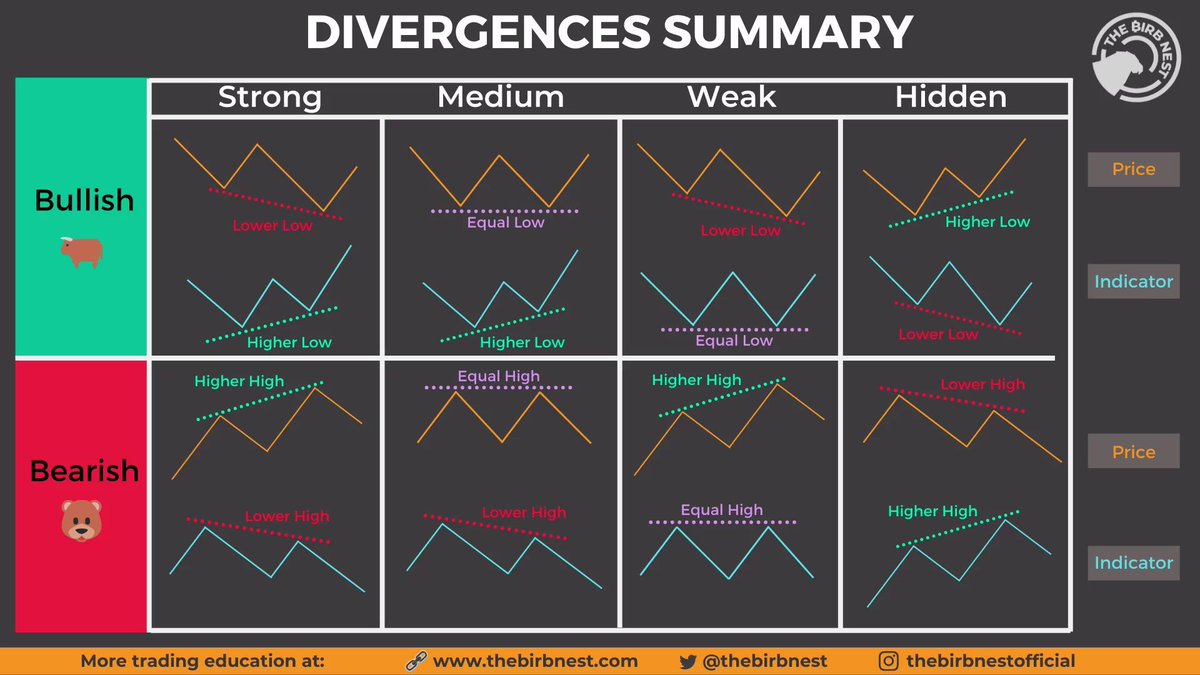
This is a possible signal and set up to bet on a reversal in the direction of the market price action. An RSI divergence is saying that the indicator does not agree with the price action.
A bullish divergence is signaled when the RSI indicator has an oversold reading then a higher low that correlates to lower lows in the price action.
This can show increasing bullish momentum, a break out back above an oversold reading is a common buy parameter used to signal a new long position.
A bearish divergence is signaled when the RSI indicator has an overbought reading then a lower high that correlates to higher highs in the price action.
This can show decreasing momentum and a potential reversal in the uptrend. A break down back below an overbought reading is a common profit taking or short selling parameter used to signal a new short position.
Loading suggestions...