

Relative Strength (RS) is my main methodology to analyze Stocks , Sectors & where to place my bets effectively
Many confuse it with Relative Strength Index
RSI is an indictor but RS is a concept which applied well can improve Stock selection
Here's a Thread on Relative Strength
Many confuse it with Relative Strength Index
RSI is an indictor but RS is a concept which applied well can improve Stock selection
Here's a Thread on Relative Strength
Two guys were camping in the woods and
a bear appears
As one guy starts running, the other stops to put on his sneakers.
‘What are you doing?’ the first guy yells out.
‘You’ll never outrun the bear.’
He replies: ‘I don’t have to.
I just have to outrun you’
That's RS 😁
a bear appears
As one guy starts running, the other stops to put on his sneakers.
‘What are you doing?’ the first guy yells out.
‘You’ll never outrun the bear.’
He replies: ‘I don’t have to.
I just have to outrun you’
That's RS 😁
Relative Strength :
Relative strength is a ratio of a stock price performance to a market average (index) performance
So basically its a way to measure Performance of an Instrument against another.
Relative Strength Formula= (Price of Instrument #1/ Price of Instrument 2 )* 100
Relative strength is a ratio of a stock price performance to a market average (index) performance
So basically its a way to measure Performance of an Instrument against another.
Relative Strength Formula= (Price of Instrument #1/ Price of Instrument 2 )* 100
This concept can be used to Analyze which sectors are Outperforming or Underperforming Nifty 50.
So if we Divide all All Sectors one by one against Nifty 50 and observe them over time, we can get a good idea which Sectors are Outperforming Nifty or Underperforming it.
So if we Divide all All Sectors one by one against Nifty 50 and observe them over time, we can get a good idea which Sectors are Outperforming Nifty or Underperforming it.
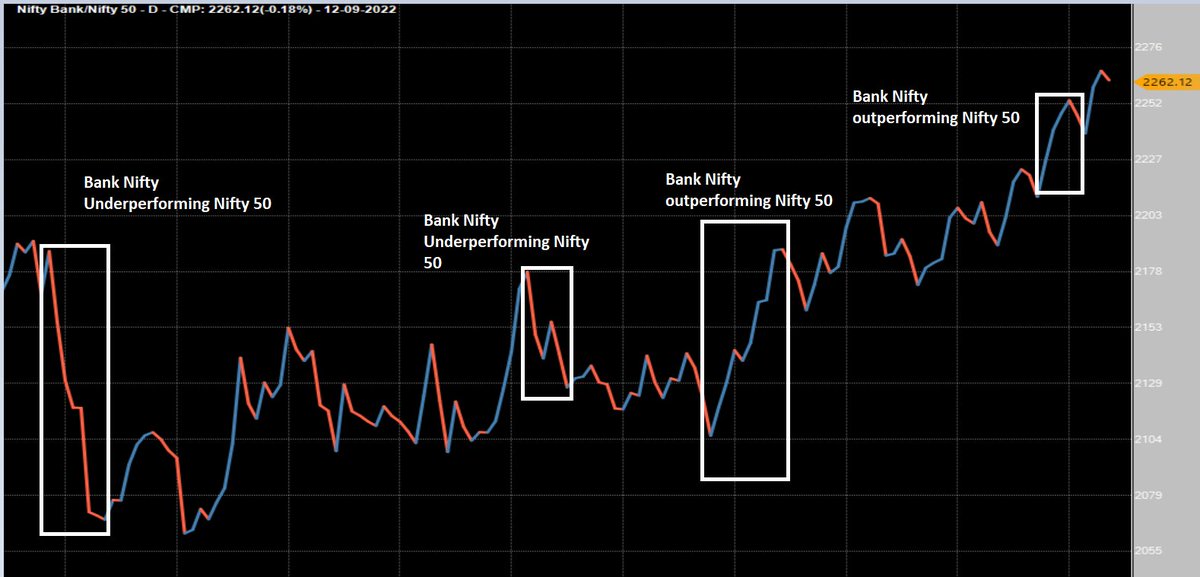
Example of Comparing BNF VS Nifty
Where BNF is numerator and NIFTY 50 is denominator
Where BNF is numerator and NIFTY 50 is denominator
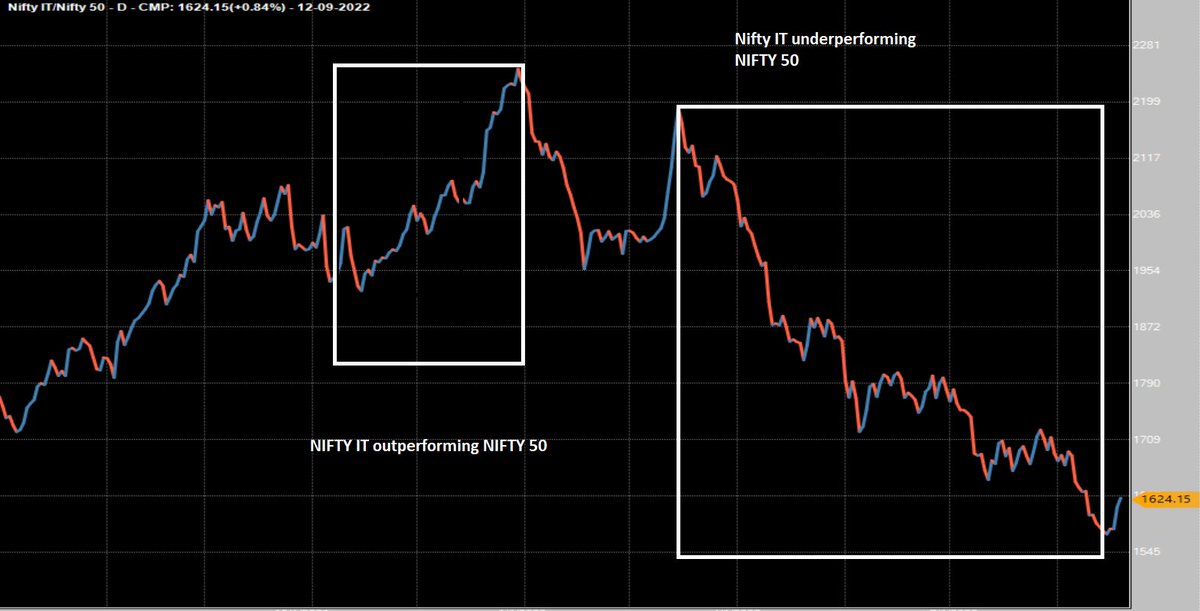
Example of Comparing NIFT IT VS Nifty
Where BNF is numerator and NIFTY 50 is denominator
Where BNF is numerator and NIFTY 50 is denominator
While some auto stocks were stronger than others, but relative strength gave an Idea about which ones to not short & which ones to short.
This concept can be used to analyze Weak and Strong Sectors
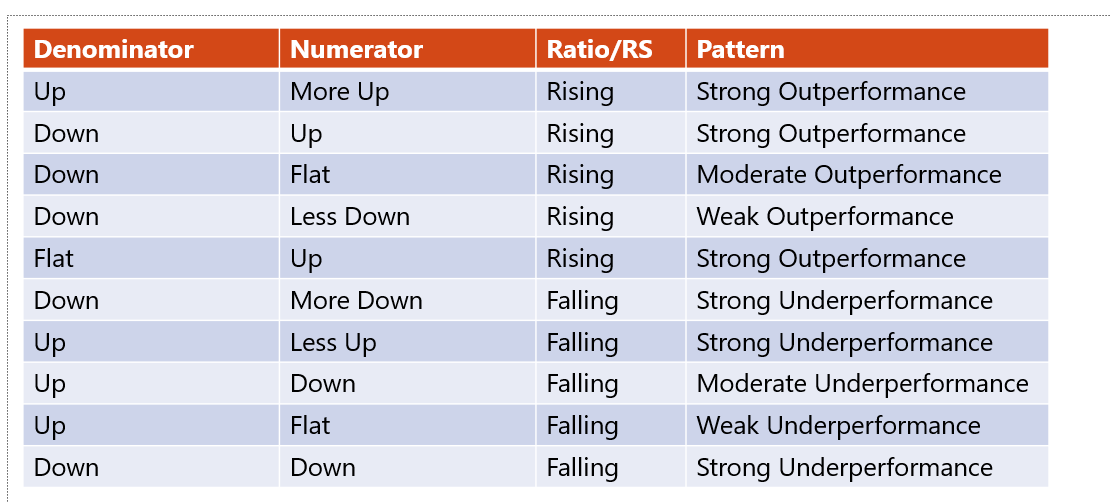
Outperformance
When the price chart is bullish = Instrument can go up.
When the RS chart is bullish = Instrument can outperform.
When both are bullish = Instrument can go up significantly and outperform.
Outperformance
When the price chart is bullish = Instrument can go up.
When the RS chart is bullish = Instrument can outperform.
When both are bullish = Instrument can go up significantly and outperform.
Underperformance
When the price chart is bearish = Instrument can go down.
When the RS chart is bearish = Instrument can underperform.
When both are bearish = Instrument can go down significantly and underperform.
When the price chart is bearish = Instrument can go down.
When the RS chart is bearish = Instrument can underperform.
When both are bearish = Instrument can go down significantly and underperform.
Now we can take this one step Further
using Top Down approach i.e select the Strong /Weak Sector vs the Index or the larger group and then drill down on the Sector to find the outperformers and underperformers.
So If say Banks are Strong, find the outperfomer and looks for Long
using Top Down approach i.e select the Strong /Weak Sector vs the Index or the larger group and then drill down on the Sector to find the outperformers and underperformers.
So If say Banks are Strong, find the outperfomer and looks for Long
So If say IT Sector is weak, find the underperfomer and looks for Short
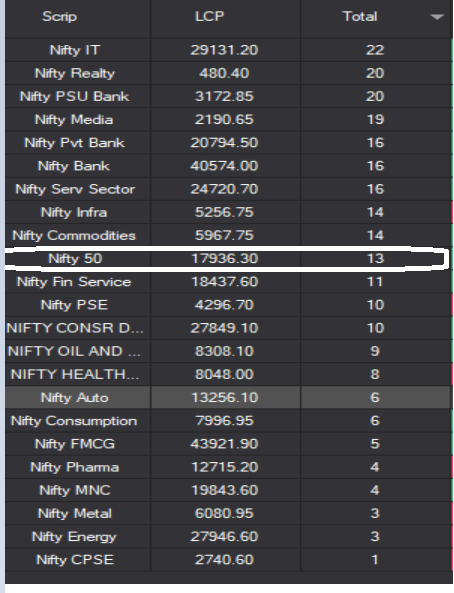
Sharing List of Sectors based on Relative Strength
Sectors Above NIFTY50 are Outperforming it and Below it are Underperformers.
#EndofThread
Sharing List of Sectors based on Relative Strength
Sectors Above NIFTY50 are Outperforming it and Below it are Underperformers.
#EndofThread
Typo Here Numerator is nifty IT not BNF
Loading suggestions...