

The hardest part of buying options is telling if they're cheap.
Whether you buy or sell an option, you’re exposed to the volatility of the underlying.
That’s why it’s important to compare volatility to its recent levels.
I’m going to show you how with Python.
Whether you buy or sell an option, you’re exposed to the volatility of the underlying.
That’s why it’s important to compare volatility to its recent levels.
I’m going to show you how with Python.
Here's what you'll be able to do after reading this:
• Get price data
• Compute realized volatility
• Build volatility cones of realized volatility
• Use cones to determine if the current realized volatility is cheap
Let’s get started!
• Get price data
• Compute realized volatility
• Build volatility cones of realized volatility
• Use cones to determine if the current realized volatility is cheap
Let’s get started!
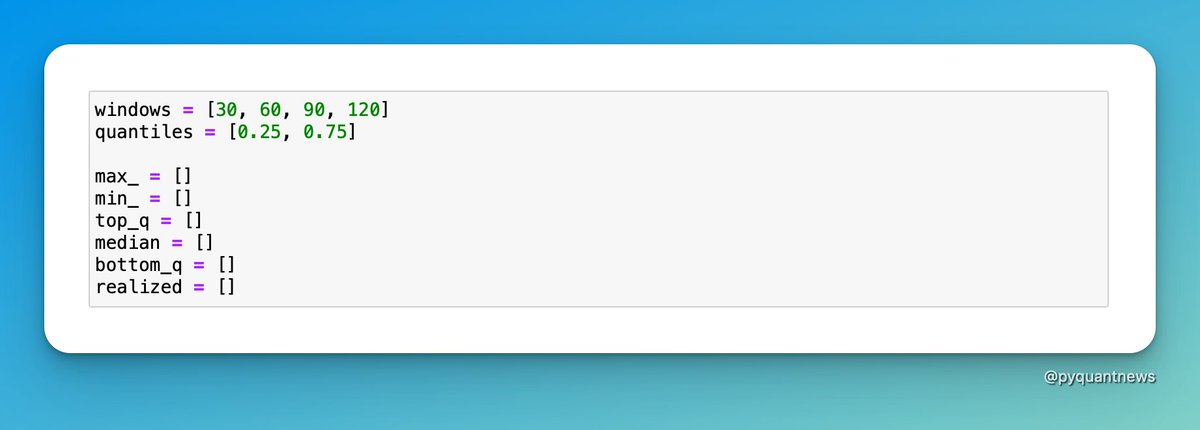
First, set up the variables we’ll use later.
These are all Python lists.
windows defines the number of days to use to compute volatility. quantiles defines the percentage of the top and bottom 25% of values.
The last few lists are where we accumulate data to plot.
These are all Python lists.
windows defines the number of days to use to compute volatility. quantiles defines the percentage of the top and bottom 25% of values.
The last few lists are where we accumulate data to plot.
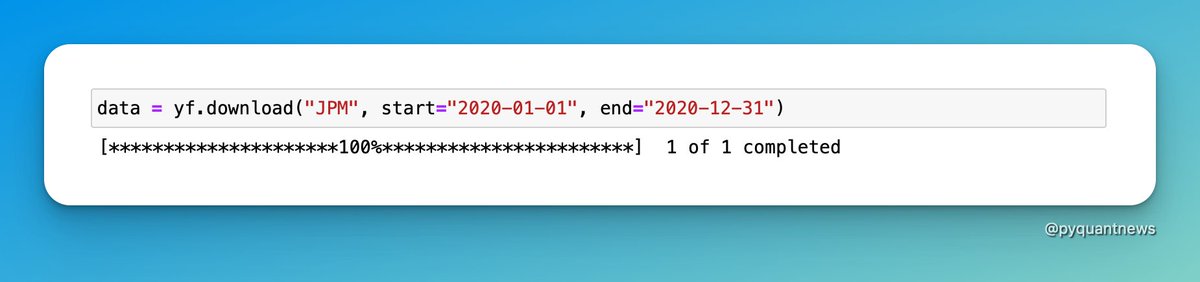
Get the data
You can use yfinance to get stock data – in this case, JPM. You can use any stock and any price range you want.
You can use yfinance to get stock data – in this case, JPM. You can use any stock and any price range you want.
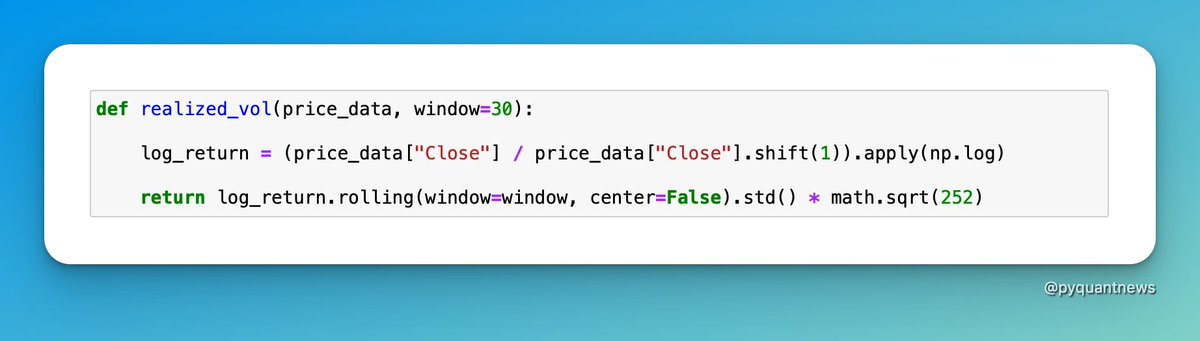
Compute realized volatility
Realized volatility is a measurement of how much the price of a stock varies. It’s used to optimize portfolios, detect regime changes, and price derivatives.
The most common way to measure realized volatility is the standard deviation.
Realized volatility is a measurement of how much the price of a stock varies. It’s used to optimize portfolios, detect regime changes, and price derivatives.
The most common way to measure realized volatility is the standard deviation.
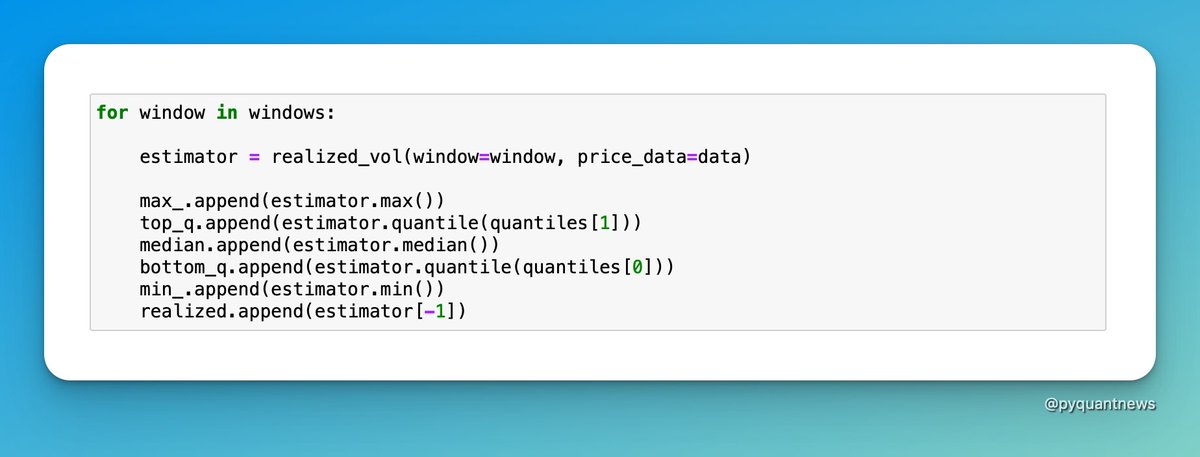
Construct the cones
The next step is to loop through each of the windows and compute realized volatility over each time frame.
estimator is a pandas DataFrame which is why it’s so easy so compute the min, max, median, and quantiles.
Magic.
The next step is to loop through each of the windows and compute realized volatility over each time frame.
estimator is a pandas DataFrame which is why it’s so easy so compute the min, max, median, and quantiles.
Magic.
Plot the results
The last step is to create a chart that plots the volatility cone.
The y-axis is the realized volatility over each time frame. The x-axis is the time frame we use to compute the realized volatility.
The last step is to create a chart that plots the volatility cone.
The y-axis is the realized volatility over each time frame. The x-axis is the time frame we use to compute the realized volatility.
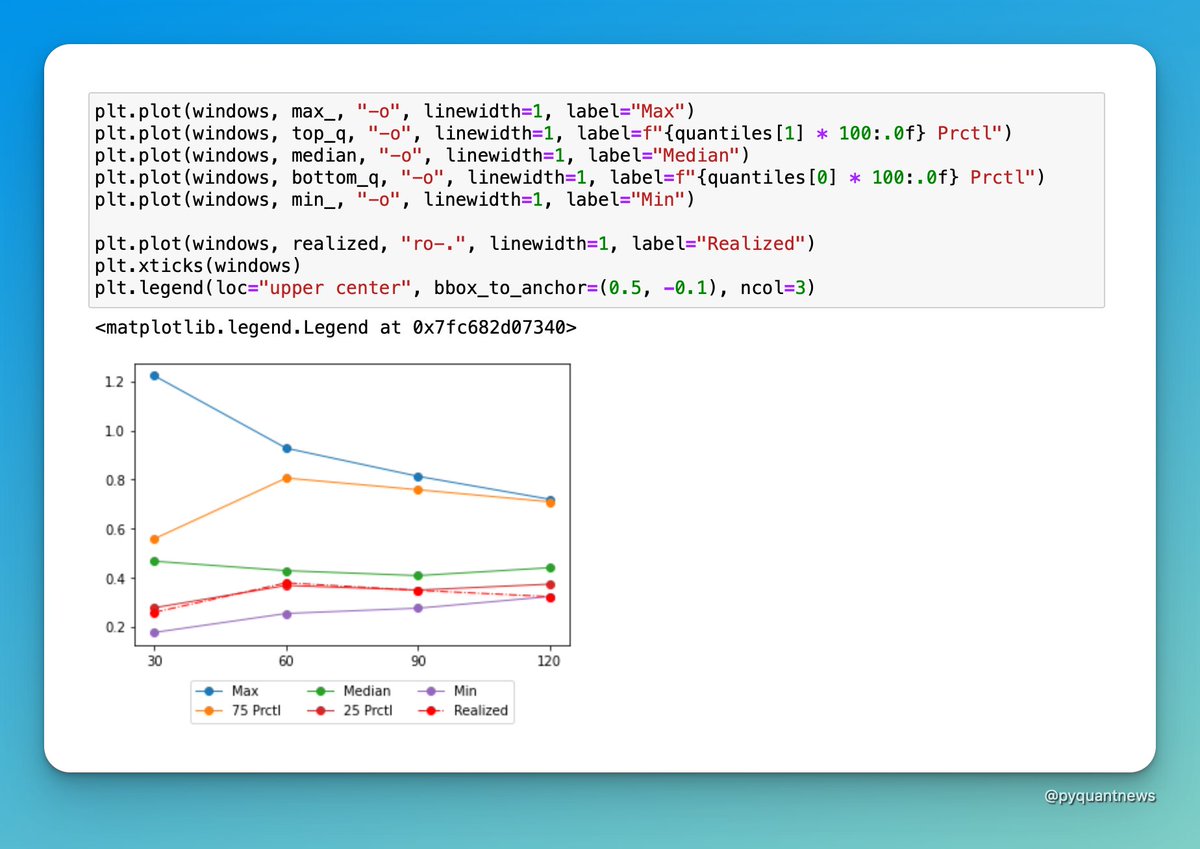
There are three conclusions you can draw from the chart:
Realized volatility:
1. Spikes (corresponds to a drop in the stock price)
2. Close to its lows (supports a case to get long volatility)
3. Reverting to its mean (supports a case to get long volatility)
Realized volatility:
1. Spikes (corresponds to a drop in the stock price)
2. Close to its lows (supports a case to get long volatility)
3. Reverting to its mean (supports a case to get long volatility)
You might conclude recent realized volatility is low and options are cheap.
With Python, it's easy:
• Get price data
• Compute realized volatility
• Build volatility cones of realized volatility
• Use cones to determine if the current realized volatility is cheap
With Python, it's easy:
• Get price data
• Compute realized volatility
• Build volatility cones of realized volatility
• Use cones to determine if the current realized volatility is cheap
That's a wrap!
If you enjoyed this thread:
1. Follow me @pyquantnews for more of these
2. RT the tweet below to share this thread with your audience
If you enjoyed this thread:
1. Follow me @pyquantnews for more of these
2. RT the tweet below to share this thread with your audience
If you're into options, check out the 46-Page Ultimate Guide to Pricing Options and Implied Volatility With Python.
Here's why:
• Black-Scholes, the greeks, and implied volatility
• Jupyter Notebooks with the code
• Live options data
pyquantnews.gumroad.com
Here's why:
• Black-Scholes, the greeks, and implied volatility
• Jupyter Notebooks with the code
• Live options data
pyquantnews.gumroad.com
Loading suggestions...