

Whether OI works for intraday trading ?
Whether OI useful ?
No one has a exact answer. But one effective way to make use OI in a very different perspective - OUT OF THE BOX from Traditional method
Read the full thread 🧵
Kindly RETWEET & share so it can reach many traders
Whether OI useful ?
No one has a exact answer. But one effective way to make use OI in a very different perspective - OUT OF THE BOX from Traditional method
Read the full thread 🧵
Kindly RETWEET & share so it can reach many traders
I do Live Market session every Monday to Friday by 09:00 a.m to 01:00 pm . Also i share important support /resistance levels of Banknifty & Nifty on the Telegram Channel. FOLLOW US @learntotrade365
Join the Telegram Channel - telegram.me
Scroll down 👇
Join the Telegram Channel - telegram.me
Scroll down 👇

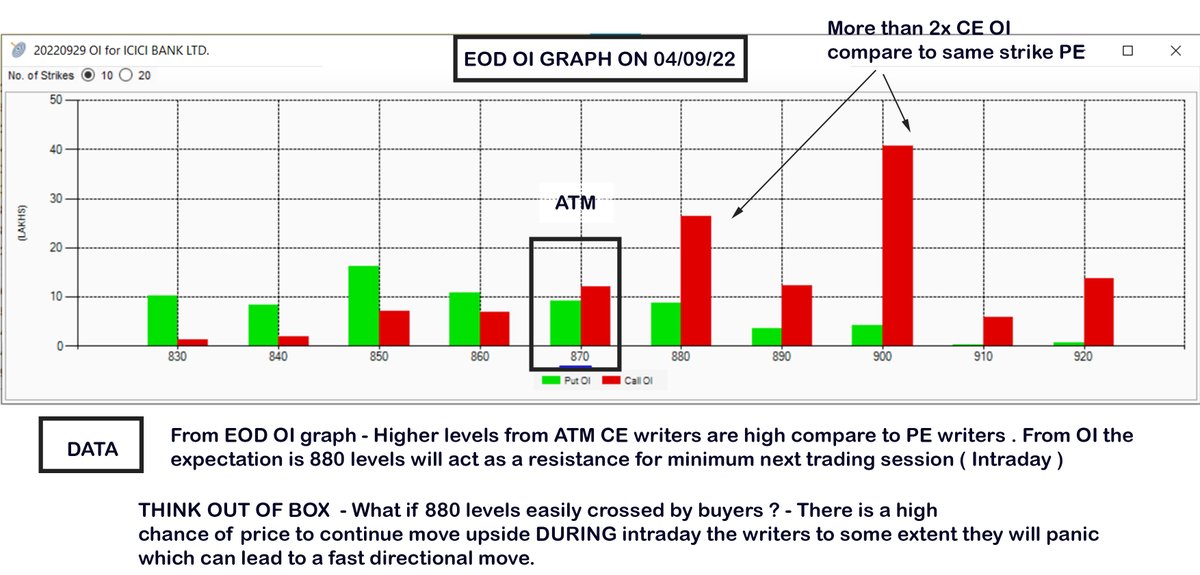
This is a EOD OI graph of ICICIBANK. Here i am trying to focus on strike price which has more than 2x OI comparing CE vs PE of individual strikes.
Below 880 strike CE vs PE in which 880 CE has 2x more OI (more writers) compare to 880 pe.
Read the message in the image
Scroll 👇
Below 880 strike CE vs PE in which 880 CE has 2x more OI (more writers) compare to 880 pe.
Read the message in the image
Scroll 👇
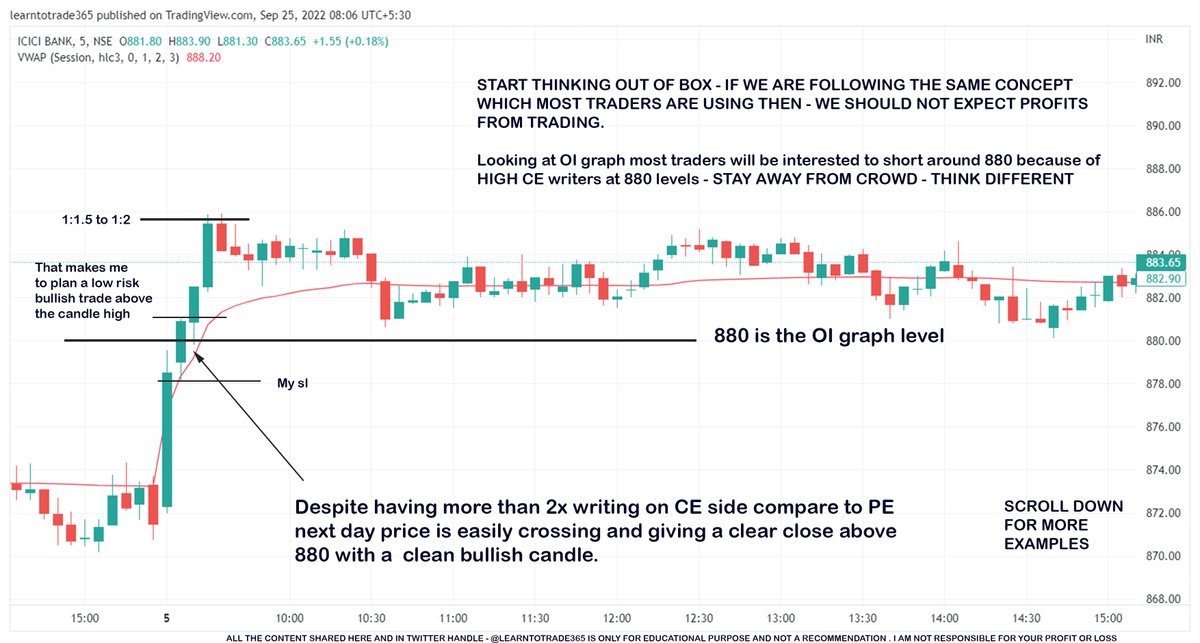
From the above OI graph of EOD 04/09 NOW refer the chart below of the same ICICIBANK for 05 sep
Main focus is not to take 880 levels as resistance just because of more CE OI. My focus if 880 is easily crossing and closing above it to open a bullish opportunity
Scroll👇
Main focus is not to take 880 levels as resistance just because of more CE OI. My focus if 880 is easily crossing and closing above it to open a bullish opportunity
Scroll👇
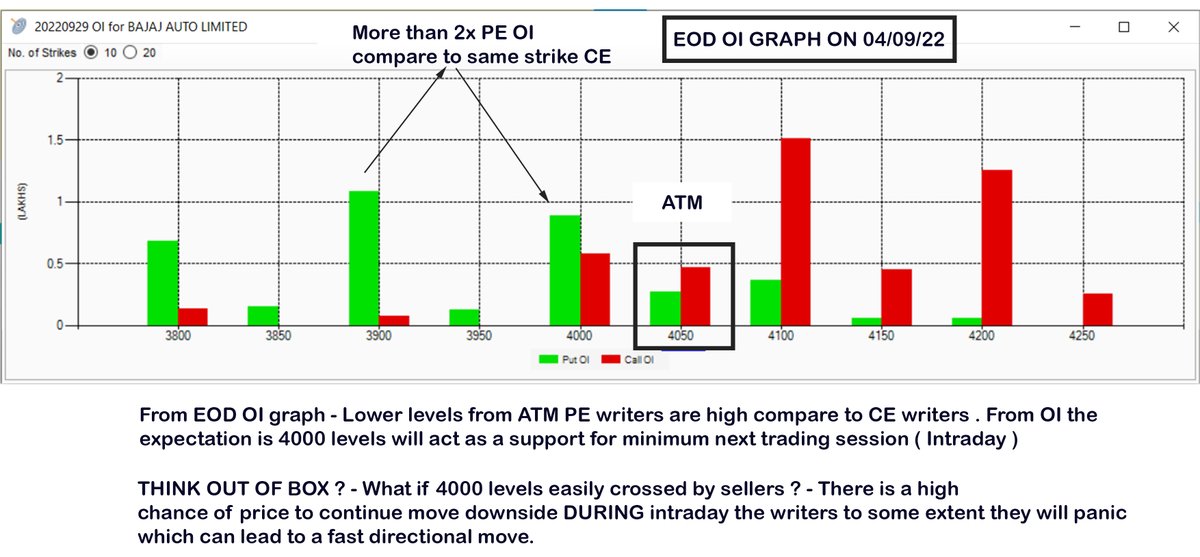
EOD OI graph of Bajaj Auto. Here i am trying to focus on strike price which has more than or equal 2x OI comparing CE vs PE of individual strikes.
Below 4000 strike CE vs PE in which 4000 PE has 2x more OI compare to 4000 CE.
Read the content in the below image
Scroll👇
Below 4000 strike CE vs PE in which 4000 PE has 2x more OI compare to 4000 CE.
Read the content in the below image
Scroll👇
From the above OI graph of EOD 04/09 NOW refer the chart below of the same BAJAJ AUTO for 05 sep
Main focus is not to take 4000 levels as SUPPORT just because of more PE OI. My main focus if 4000 is easily crossing and closing below it to open a bearish opportunity
Scroll👇
Main focus is not to take 4000 levels as SUPPORT just because of more PE OI. My main focus if 4000 is easily crossing and closing below it to open a bearish opportunity
Scroll👇

EOD OI graph of ADANI ENT. Here i am trying to focus on strike price which has more than or equal 2x OI comparing CE vs PE of individual strikes.
Below 3400 strike CE vs PE in which 3400 CE has 3x more OI compare to 3400 PE.
Read the content in the below image
Scroll👇
Below 3400 strike CE vs PE in which 3400 CE has 3x more OI compare to 3400 PE.
Read the content in the below image
Scroll👇

From the above OI graph of EOD 05/09 NOW refer the chart below of the same ADANI ENT for 06 sep
Main focus is not to take 3400 levels as resistance just because of more CE OI. My focus if 3400 is easily crossing and closing above it to open a bullish opportunity
Scroll👇
Main focus is not to take 3400 levels as resistance just because of more CE OI. My focus if 3400 is easily crossing and closing above it to open a bullish opportunity
Scroll👇

EOD OI graph of BAJAJ AUTO. Here i am trying to focus on strike price which has more than or equal 2x OI comparing CE vs PE of individual strikes.
Below 3900 strike CE vs PE in which 3900 PE has 3x more OI compare to 3900 CE.
Read the content in the below image
Scroll👇
Below 3900 strike CE vs PE in which 3900 PE has 3x more OI compare to 3900 CE.
Read the content in the below image
Scroll👇

From the above OI graph of EOD 06/09 NOW refer the chart below of the same BAJAJ AUTO for 07 sep
Main focus is not to take 3900 levels as SUPPORT just because of more PE OI . My focus if 3900 is easily crossing and closing below it to open a bearish opportunity
Scroll👇
Main focus is not to take 3900 levels as SUPPORT just because of more PE OI . My focus if 3900 is easily crossing and closing below it to open a bearish opportunity
Scroll👇

End of the thread
If you find this useful follow us @learntotrade365 and Kindly RETWEET the first tweet of this thread. Your support is very important
Join the Telegram Channel - telegram.me
Kindly do check the below MEGA learning thread 👇
If you find this useful follow us @learntotrade365 and Kindly RETWEET the first tweet of this thread. Your support is very important
Join the Telegram Channel - telegram.me
Kindly do check the below MEGA learning thread 👇
Loading suggestions...