

How to Read Stock Charts
A Step by Step Guide🧵
Retweet to educate
A Step by Step Guide🧵
Retweet to educate
Learning how to trade the stock market successfully can come with a lot of challenges.
Something that can help you create an edge over the market is reading and accurately analyzing stock charts
In this thread, we go through everything you need to know about stock charts
2/n
Something that can help you create an edge over the market is reading and accurately analyzing stock charts
In this thread, we go through everything you need to know about stock charts
2/n
What Exactly is a Stock Chart?
A stock chart shows you a visual representation of what price has done in history and what it could do in the future
For example, a 15 minute chart shows what the price is doing every 15 minutes,
3/n
A stock chart shows you a visual representation of what price has done in history and what it could do in the future
For example, a 15 minute chart shows what the price is doing every 15 minutes,
3/n
Choosing the Best Stock Chart
1. Line Chart
This is the simplest of all the stock market charts. This chart also has the least amount of information and is just one long line moving higher and lower.
It doesnt show the high or low price and reduces noise
4/n
1. Line Chart
This is the simplest of all the stock market charts. This chart also has the least amount of information and is just one long line moving higher and lower.
It doesnt show the high or low price and reduces noise
4/n

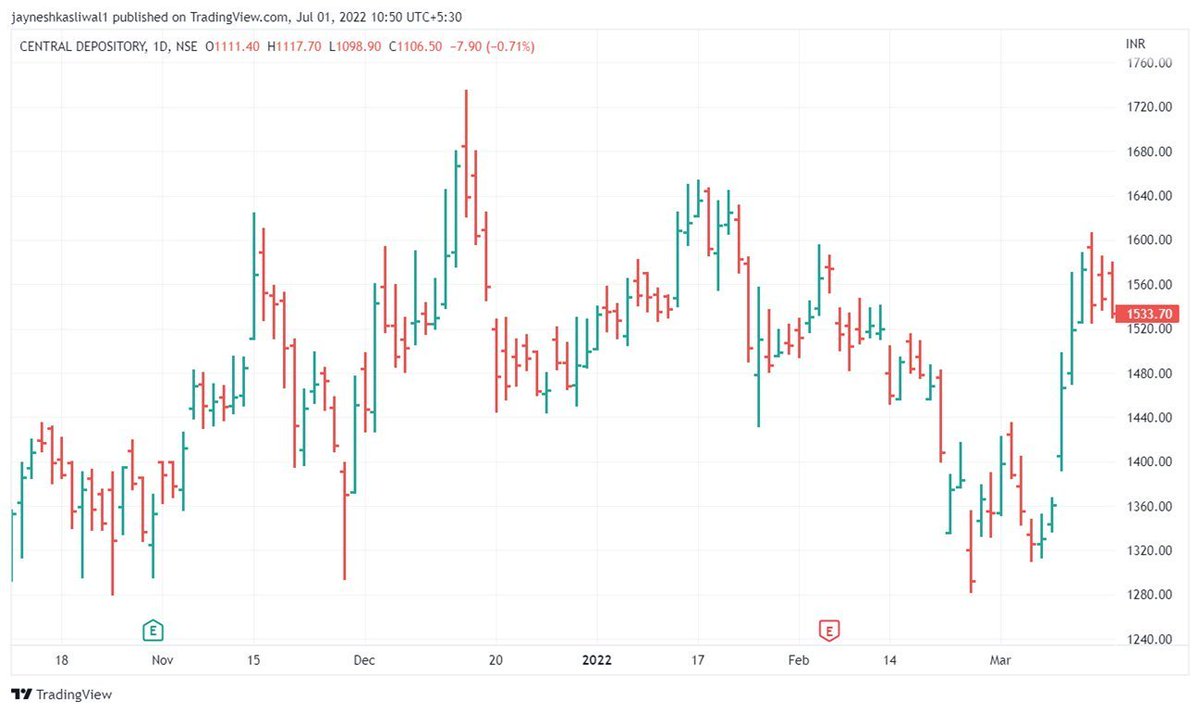
2. Bar Charts
The bar chart and candlestick chart are similar.
The bar chart shows you more information than a line chart as it also shows you the open, close, high, and low that price made for each session.
5/n
The bar chart and candlestick chart are similar.
The bar chart shows you more information than a line chart as it also shows you the open, close, high, and low that price made for each session.
5/n
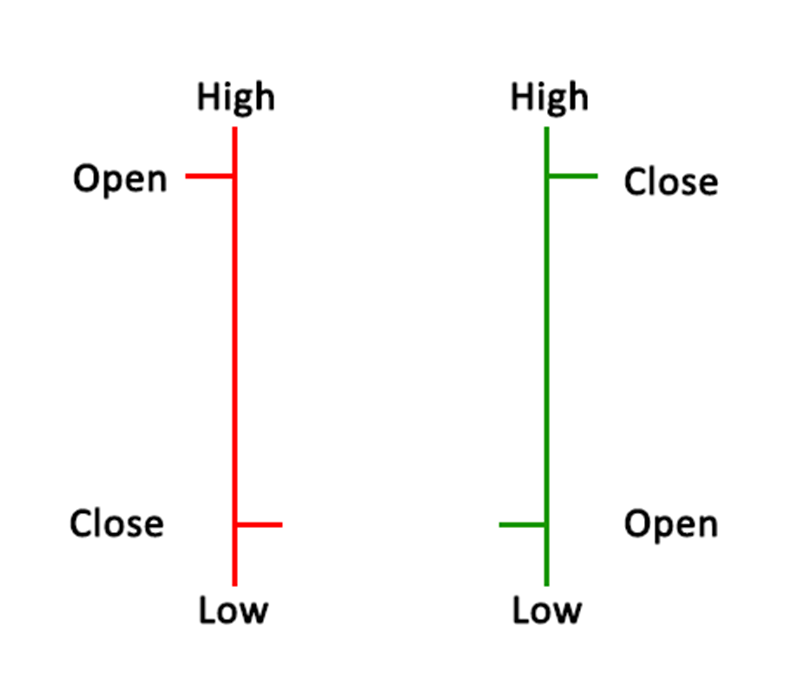
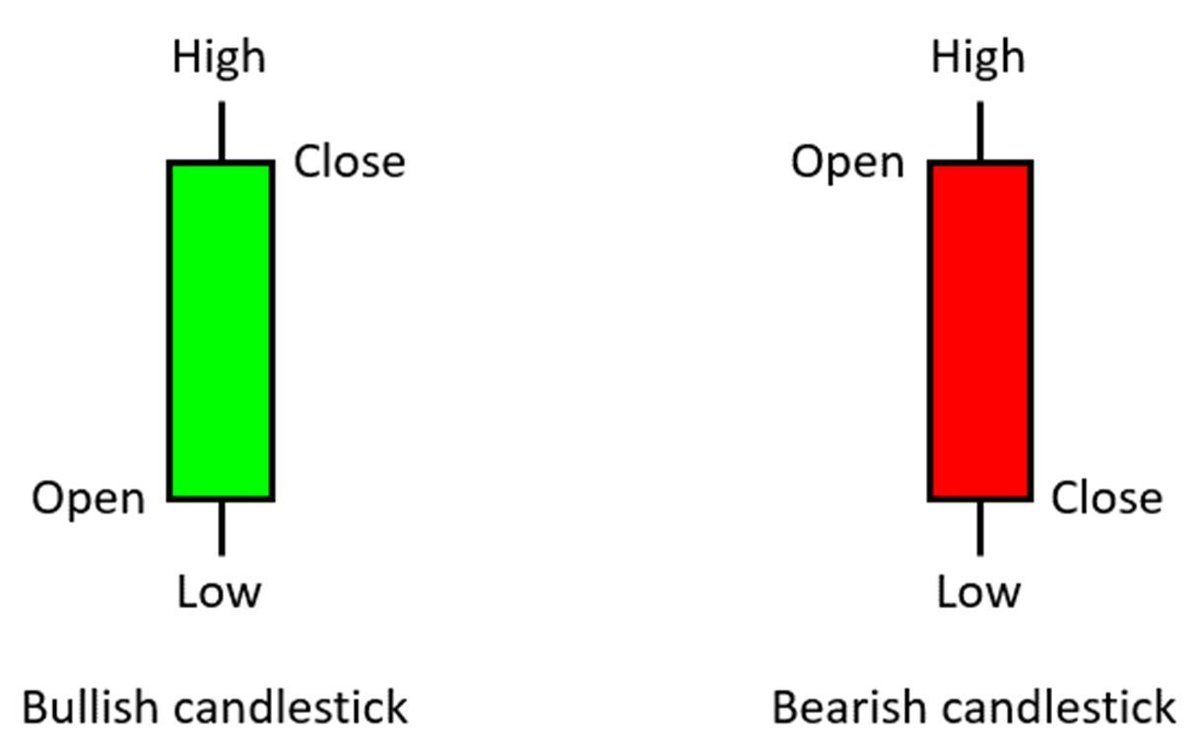
3. Japanese Candlestick Charts
Whilst the candlestick chart shows you the same information as the bar chart, it also includes a body. You can normally change the color of the candle body to suit your own needs.
Green : Bullish , Red: Bearish
6/n
Whilst the candlestick chart shows you the same information as the bar chart, it also includes a body. You can normally change the color of the candle body to suit your own needs.
Green : Bullish , Red: Bearish
6/n
How to Read Stock Charts
Some of the most popular strategies for reading stock charts include;
Look for a obvious Trend
Use Support and Resistance
Add important Indicators
Follow Volume Information
Youtube Video of the same:
youtu.be
Some of the most popular strategies for reading stock charts include;
Look for a obvious Trend
Use Support and Resistance
Add important Indicators
Follow Volume Information
Youtube Video of the same:
youtu.be
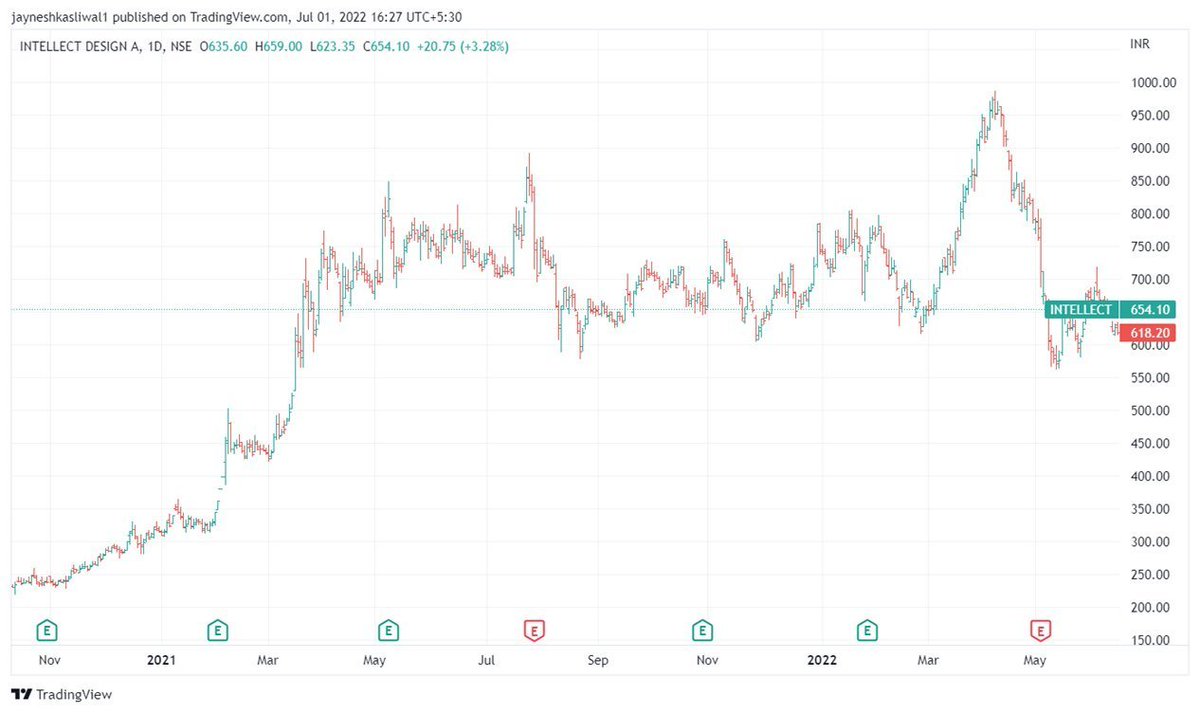
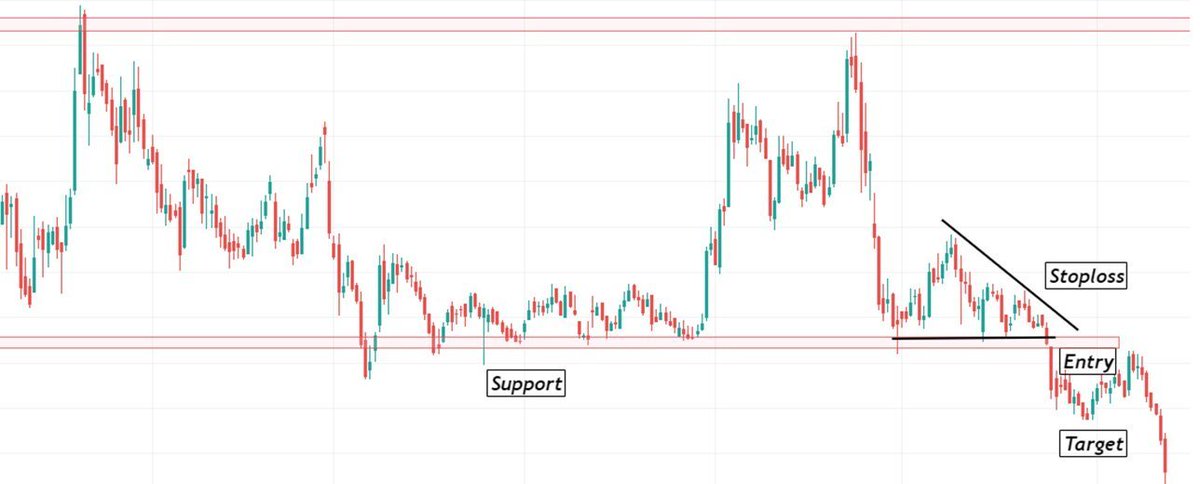
Look for the Obvious Trend
Obvious trends will tend to run for long periods. Whilst every trend has pullbacks where price makes a move against the trend until the trend fails, it can offer high probability trades
8/n
Obvious trends will tend to run for long periods. Whilst every trend has pullbacks where price makes a move against the trend until the trend fails, it can offer high probability trades
8/n
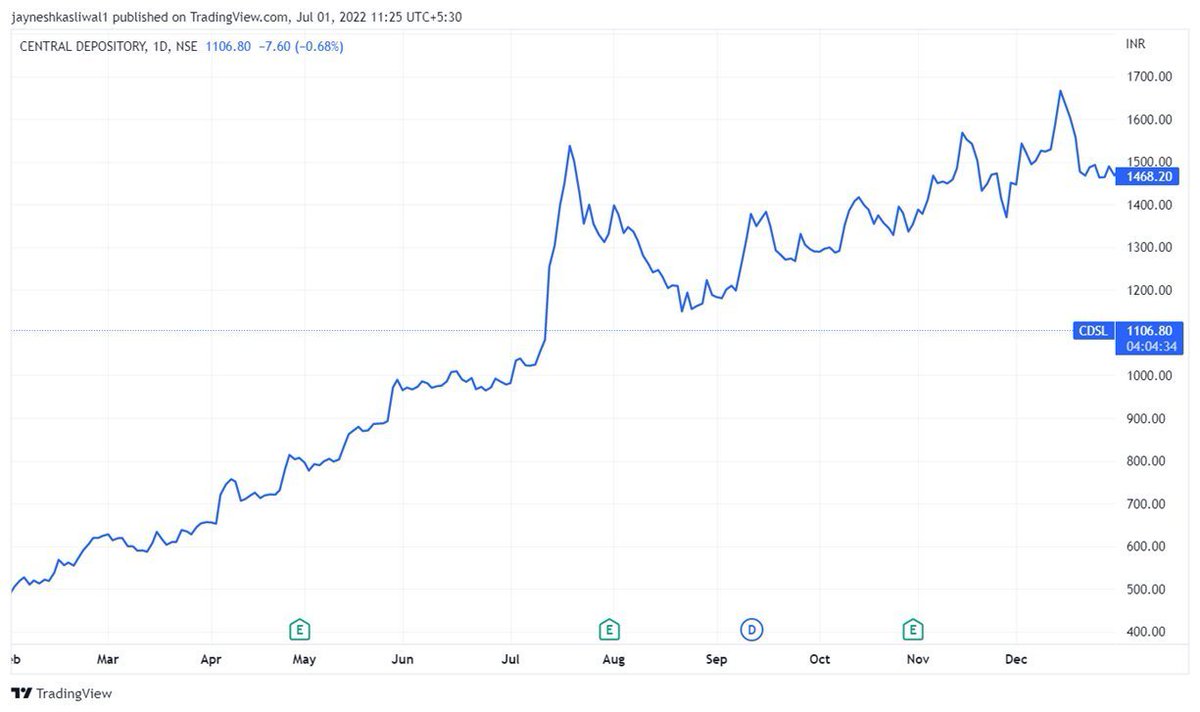
In the example chart below price is on a trend higher. Price makes regular moves and swings lower against the trend, but the trend overall continues moving higher.
These swings lower against the trend can often be the best spots to look for trend trading entries
9/n
These swings lower against the trend can often be the best spots to look for trend trading entries
9/n
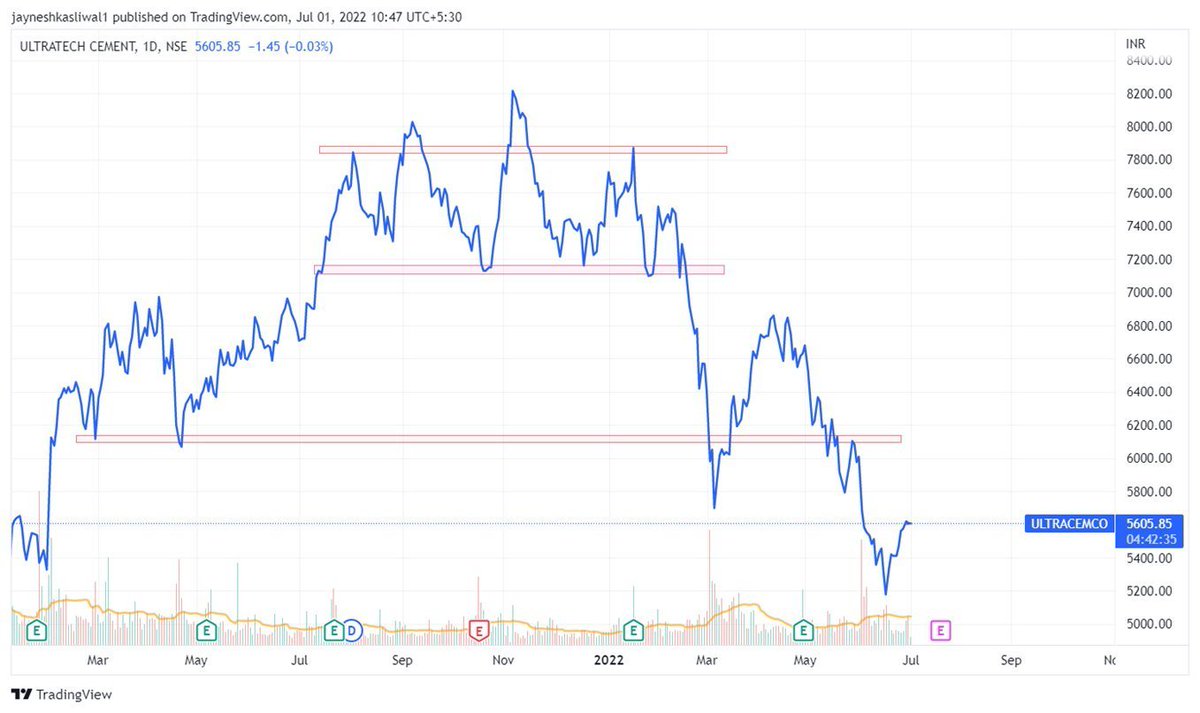
Using Support and Resistance
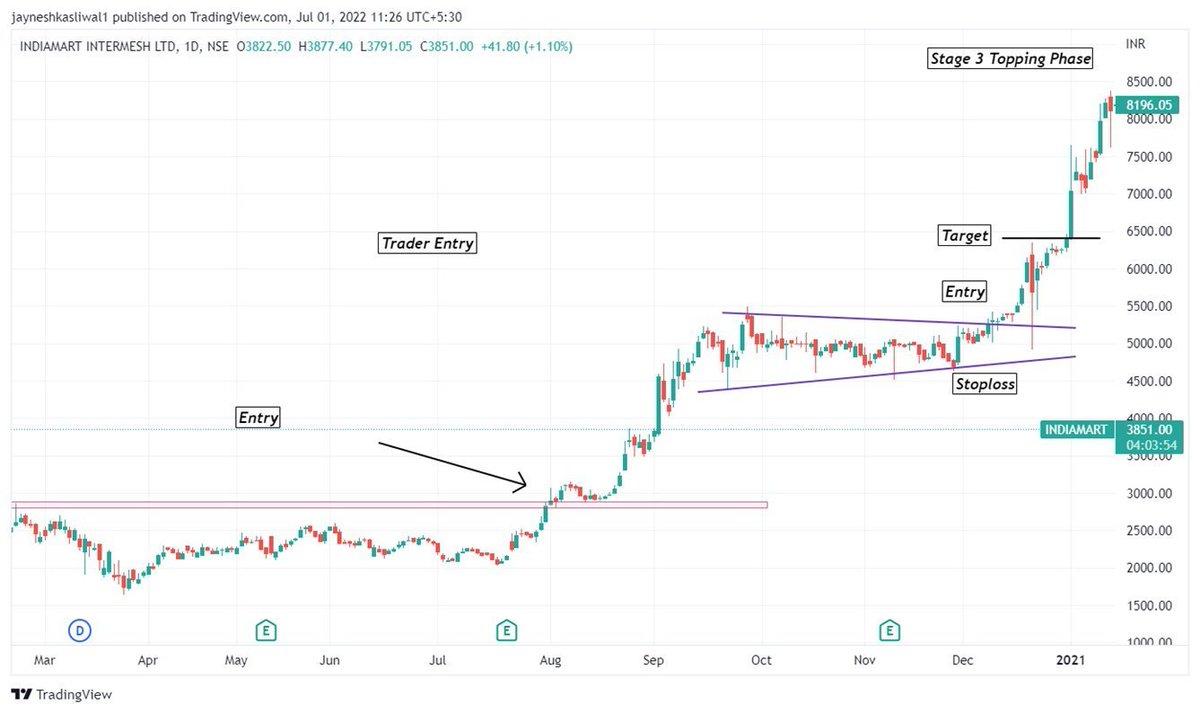
When using support and resistance in your trading, you can either look for the support or resistance to bounce or for a breakout
Support and resistance are some of the most common forms of trading across all different markets and time frames.
10/n
When using support and resistance in your trading, you can either look for the support or resistance to bounce or for a breakout
Support and resistance are some of the most common forms of trading across all different markets and time frames.
10/n
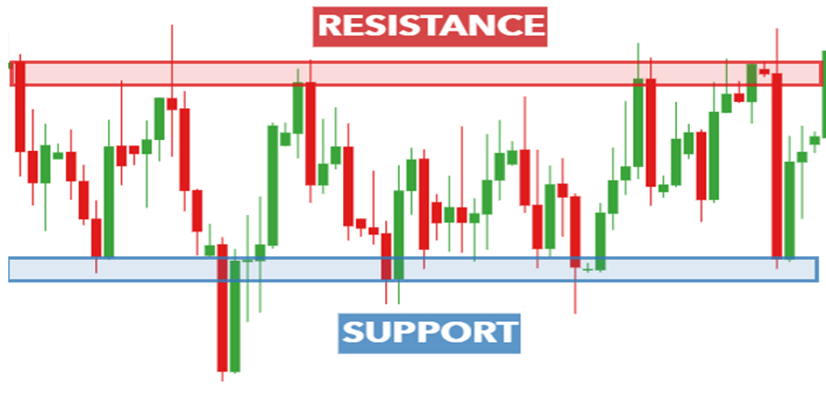
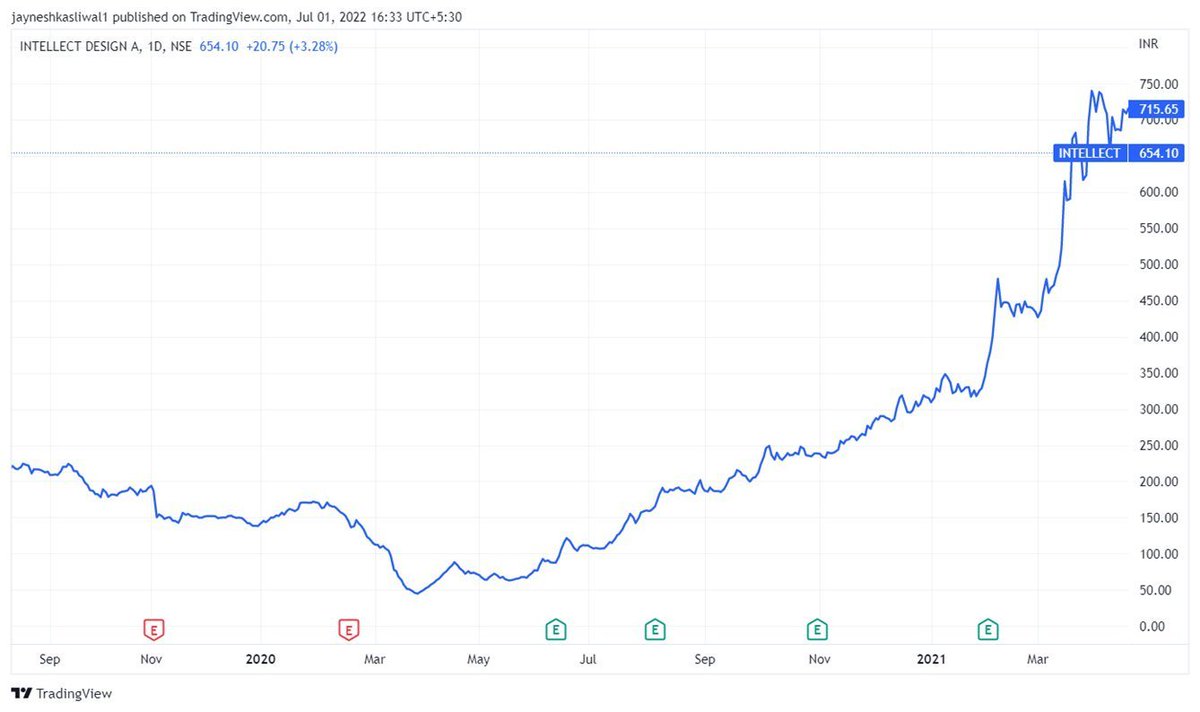
In the example below, price moves into an important area of support. This could be a high probability area to look for long trades before the price rejects the support level and then moves back higher.
11/n
11/n
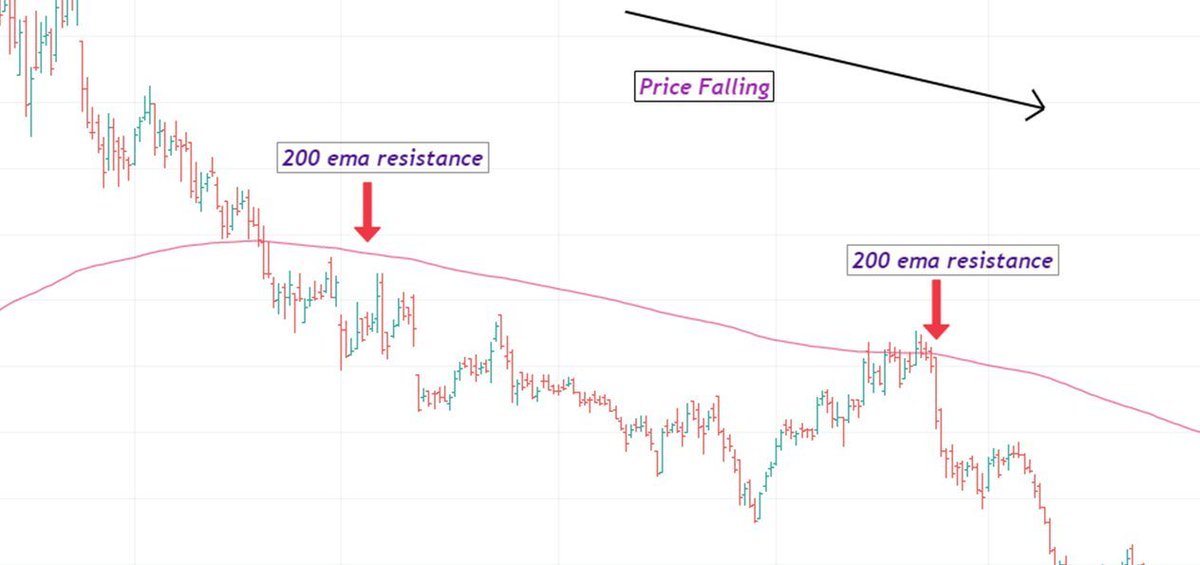
Adding Important Indicators
One of the most popular indicators in the stock market is the moving average and, in particular, the longer-term 200 ema
The 200 ema can give you a quick indication of the overall price trend, and it can also be used as dynamic support and resistance.
One of the most popular indicators in the stock market is the moving average and, in particular, the longer-term 200 ema
The 200 ema can give you a quick indication of the overall price trend, and it can also be used as dynamic support and resistance.
In the example chart below, we can see that price continually stays below the 200 period moving average.
We can also see that each time price moves higher to test this moving average, it rejects it as resistance and moves lower.
14/n
We can also see that each time price moves higher to test this moving average, it rejects it as resistance and moves lower.
14/n
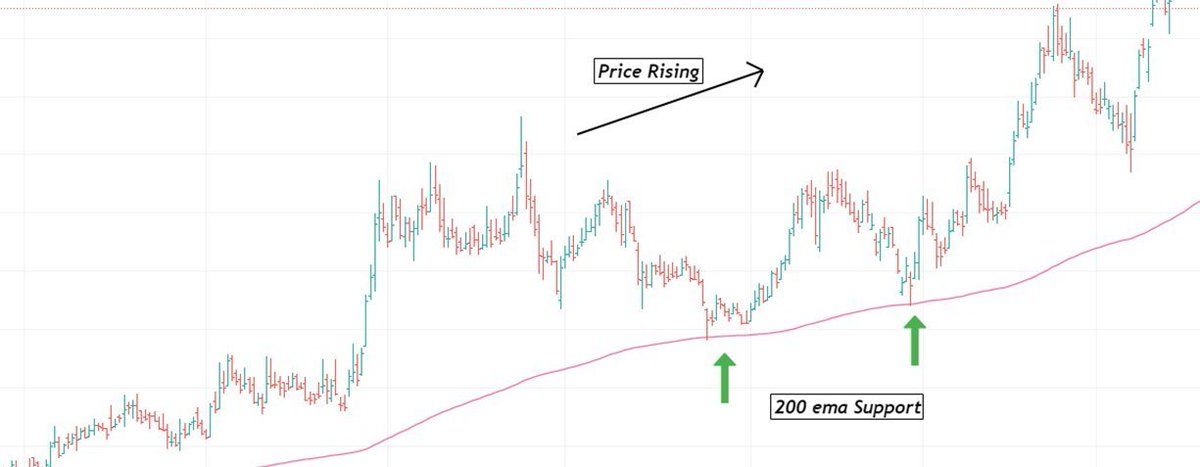
In the example chart below, we can see that price continually stays above the 200 period moving average.
We can also see that each time price moves lower to test this moving average, it rejects it as Support and moves higher.
15/n
We can also see that each time price moves lower to test this moving average, it rejects it as Support and moves higher.
15/n

Found this great app , which is changing the world of Indian stock investing.
For any queries for your stocks & for your portfolio health, get all answers here😇
Use my link below, and get access to exclusive benefits, Check Now
liquidelife.page.link
END
For any queries for your stocks & for your portfolio health, get all answers here😇
Use my link below, and get access to exclusive benefits, Check Now
liquidelife.page.link
END


Start Your Algo Trading Journey
For Algo Setup Signup and Add 2000 Credits :
app.quantiply.tech
app.quantiply.tech

Loading suggestions...