

If you invest, you MUST learn how to analyze the Income Statement.
Income statement provide insights into a company's:
- Growth potential
- Moat trajectory
- Red flags
A complete guide to analyzing the Income Statement (with case studies):
Income statement provide insights into a company's:
- Growth potential
- Moat trajectory
- Red flags
A complete guide to analyzing the Income Statement (with case studies):
Here's how an income statement looks like.
You start off with revenue at the top, which is the total sales a totally makes.
And you subtract expenses down each line item.
You start off with revenue at the top, which is the total sales a totally makes.
And you subtract expenses down each line item.

Let's start with Gross Profit!
Revenue - Cost of Goods Sold = Gross Profit
Revenue: Total amount received from products or services sold
COGS: Cost of producing the products or services
Gross Profit: The difference between revenue and COGS.
Revenue - Cost of Goods Sold = Gross Profit
Revenue: Total amount received from products or services sold
COGS: Cost of producing the products or services
Gross Profit: The difference between revenue and COGS.

Check out this case study:
Based on Chipotle's 2021 financial statements
A chicken burrito sold for $6.50
Would cost $4 to make
This leaves us with $2.50 in gross profits!
Based on Chipotle's 2021 financial statements
A chicken burrito sold for $6.50
Would cost $4 to make
This leaves us with $2.50 in gross profits!
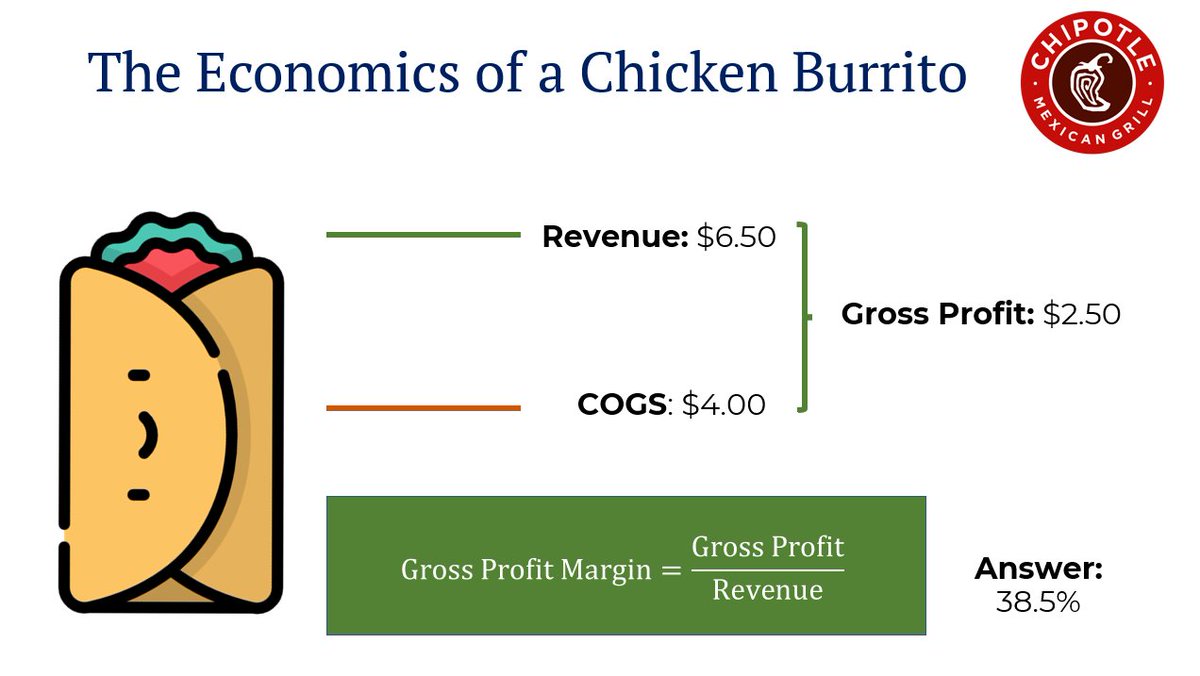
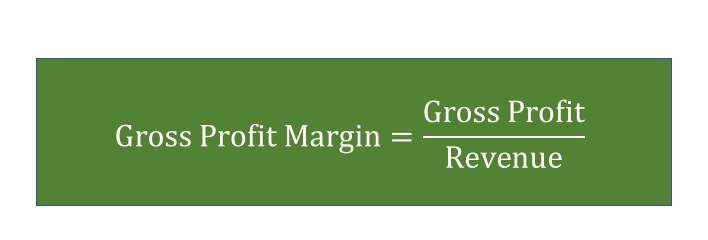
We can also say that their gross profit margin is 38.5%
We get this by taking $2.50 (gross profits) divided by $6.50 (revenue).
This means that for every $1 in sales, Chipotle gets $0.385 in gross profits.
Generally, the higher the better.
Indicates pricing power.
We get this by taking $2.50 (gross profits) divided by $6.50 (revenue).
This means that for every $1 in sales, Chipotle gets $0.385 in gross profits.
Generally, the higher the better.
Indicates pricing power.
But there're exceptions!
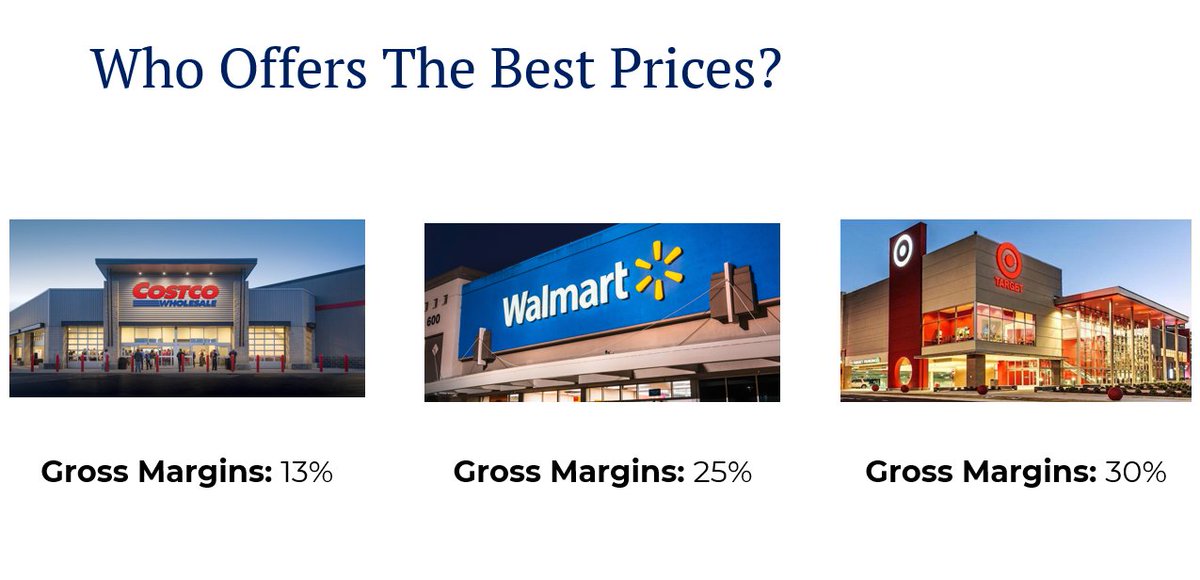
Costco has the lowest gross profit margins amongst its competitors.
But its stock price has been the best performer.
Why?
By lowering prices, they are able to clear their inventory faster and win over a large subscription base for their membership!
Costco has the lowest gross profit margins amongst its competitors.
But its stock price has been the best performer.
Why?
By lowering prices, they are able to clear their inventory faster and win over a large subscription base for their membership!
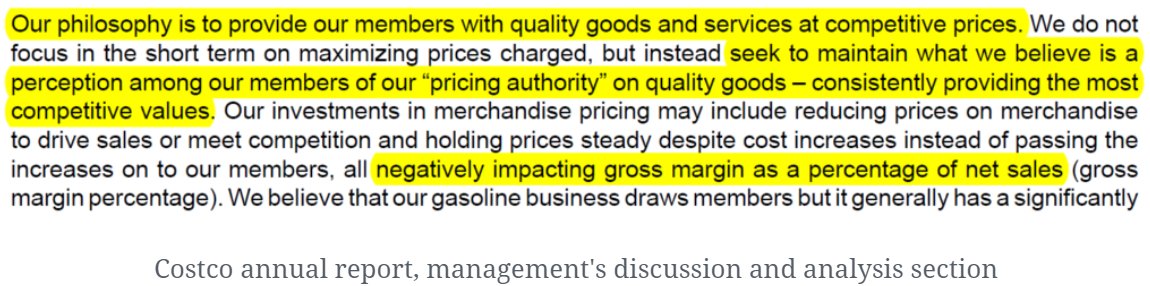
Which is why it's important to analyze the numbers with the business model and strategy.
Here's an excerpt: "seek to maintain what we believe is a perception among our members of our "pricing authority" on quality goods - consistently providing the most competitive values."
Here's an excerpt: "seek to maintain what we believe is a perception among our members of our "pricing authority" on quality goods - consistently providing the most competitive values."
BUT!
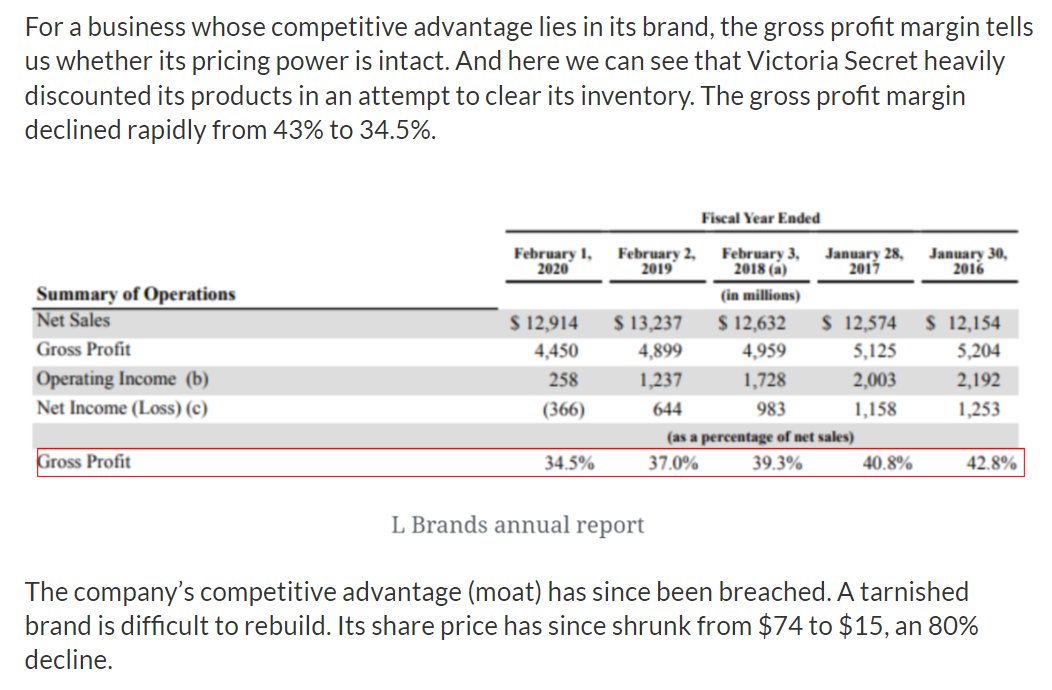
For premium brands, declining margins almost always spells TROUBLE.
E.g. Victoria Secret heavily discounted its products in an attempt to clear its inventory.
The gross profit margin declined rapidly from 43% to 34.5%.
Its moat (branding) has been breached.
For premium brands, declining margins almost always spells TROUBLE.
E.g. Victoria Secret heavily discounted its products in an attempt to clear its inventory.
The gross profit margin declined rapidly from 43% to 34.5%.
Its moat (branding) has been breached.
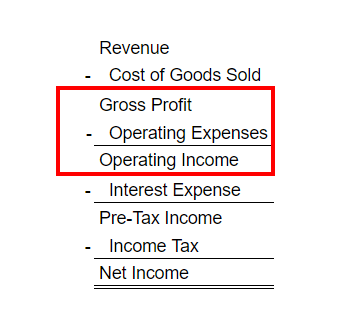
Alright, let's move to Operating Income!
Gross Profit - Operating Expenses = Operating Income
Gross profits tells us if the company has pricing power...
Operating expenses reveal its priorities & how efficiently they're run.
Let's dive deeper ⏬
Gross Profit - Operating Expenses = Operating Income
Gross profits tells us if the company has pricing power...
Operating expenses reveal its priorities & how efficiently they're run.
Let's dive deeper ⏬
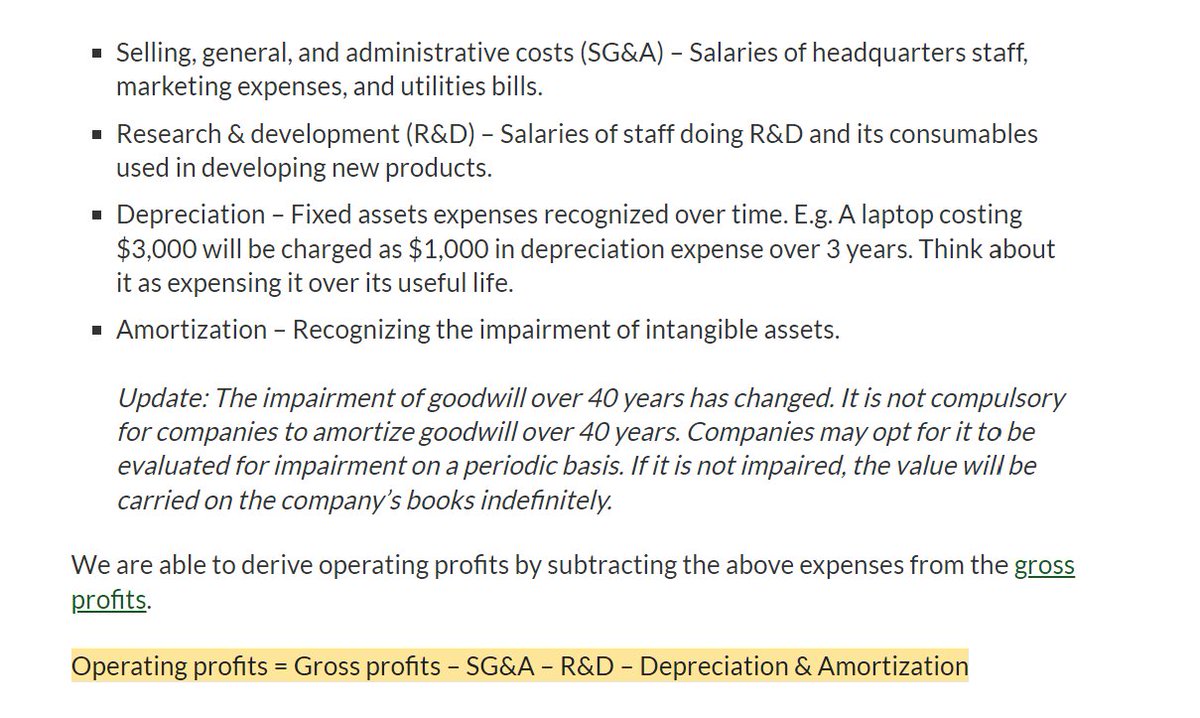
There're 4 main buckets in operating expenses:
1. Selling, general, and administrative costs (SG&A)
2. Research & development (R&D)
3. Depreciation
4. Amortization
What expenses do they include?
Check out the image 👇
1. Selling, general, and administrative costs (SG&A)
2. Research & development (R&D)
3. Depreciation
4. Amortization
What expenses do they include?
Check out the image 👇
Back to our Chipotle case study:
If you spread out Chipotle's operating expenses across ALL Burritos sold...
It would come up date be $1.80
After deducting the cost of making and headquarters costs, a $6.50 burrito earns $0.70 in operating income.
If you spread out Chipotle's operating expenses across ALL Burritos sold...
It would come up date be $1.80
After deducting the cost of making and headquarters costs, a $6.50 burrito earns $0.70 in operating income.
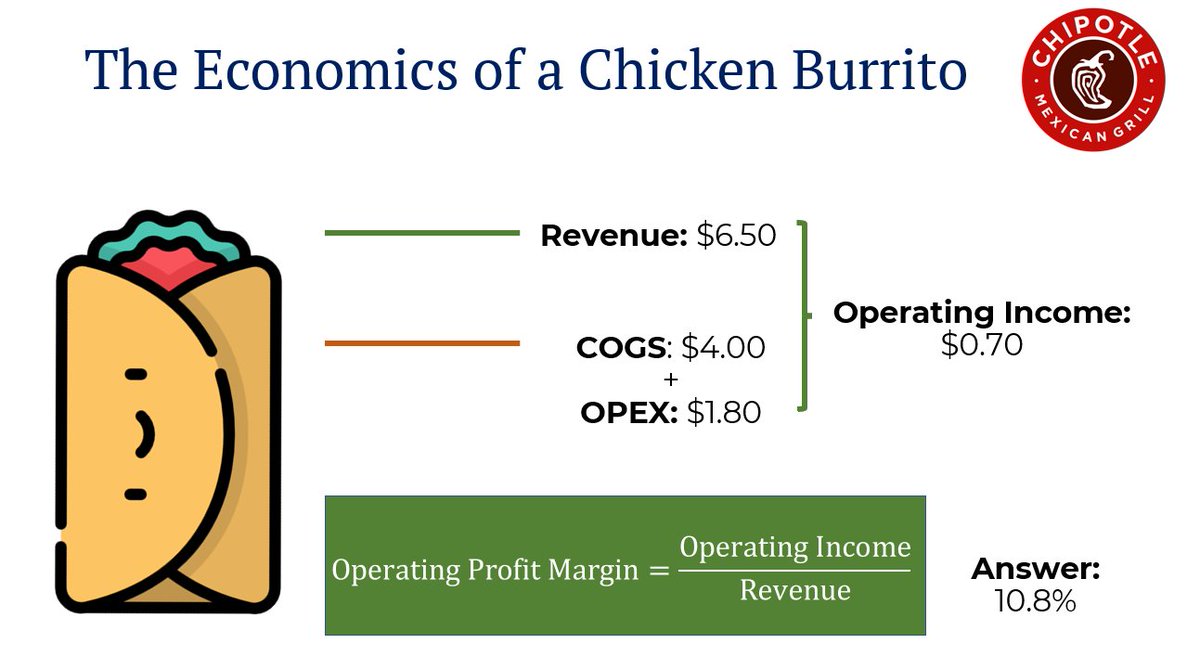
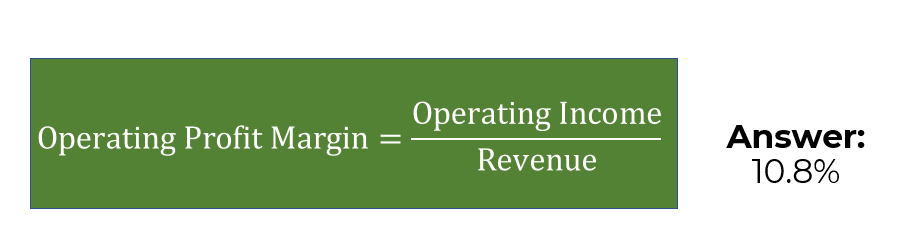
We can also say that their operating profit margin is 10.8%
We get this by taking $0.70 (operating income) divided by $6.50 (revenue)
This means that for every $1 in sales, Chipotle gets $10.80 in operating profits.
Generally, the higher the better.
Indicates efficiency.
We get this by taking $0.70 (operating income) divided by $6.50 (revenue)
This means that for every $1 in sales, Chipotle gets $10.80 in operating profits.
Generally, the higher the better.
Indicates efficiency.
But there're exceptions!
Monster beverage spent a disproportionately large % of its revenue on marketing (SG&A).
Their unit economics are excellent and they knew a large scale will bring:
- Economies of scale in marketing costs
- Lower distribution costs
- Operating leverage
Monster beverage spent a disproportionately large % of its revenue on marketing (SG&A).
Their unit economics are excellent and they knew a large scale will bring:
- Economies of scale in marketing costs
- Lower distribution costs
- Operating leverage
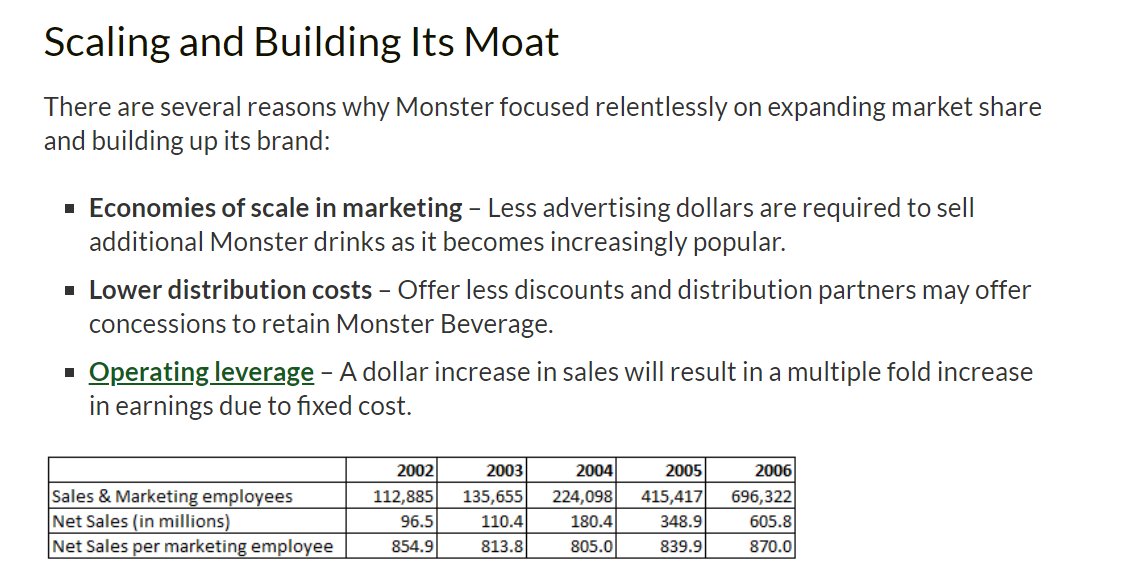
Which is why its important to analyze the numbers with the company's phase and strategy.
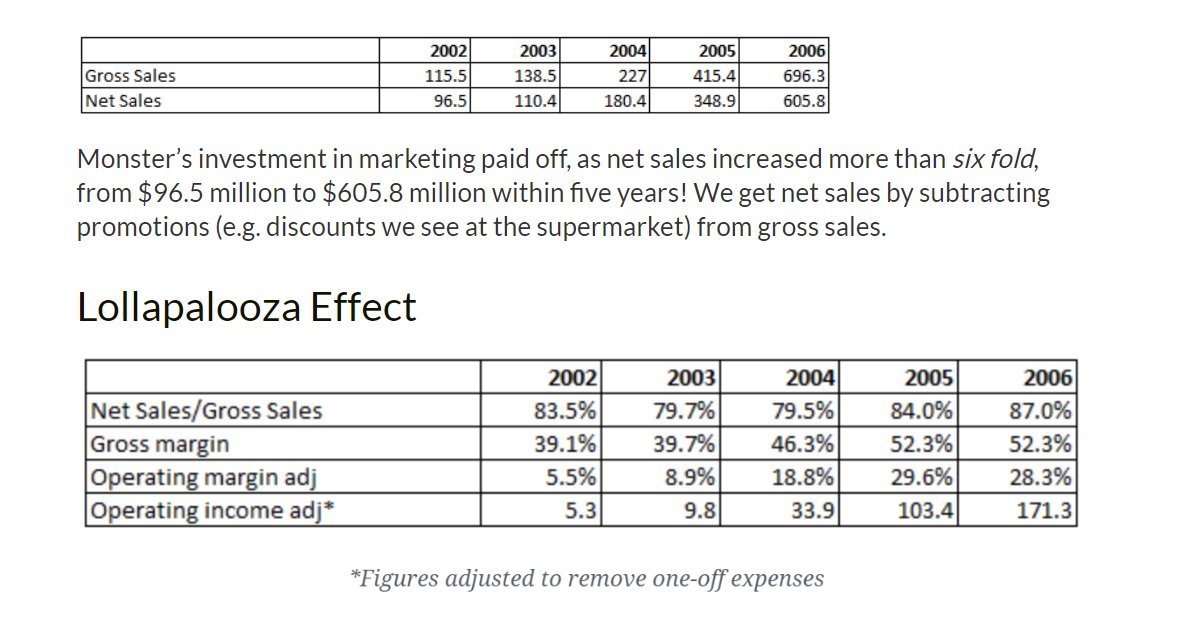
Monster's spend in marketing paid off.
Net sales increased 6-fold, from $96.5m to $605.8m within 5 years.
And operating margins expanded at economies of scale kicks in.
Monster's spend in marketing paid off.
Net sales increased 6-fold, from $96.5m to $605.8m within 5 years.
And operating margins expanded at economies of scale kicks in.
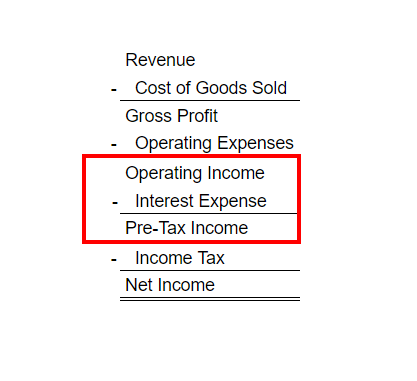
Alright, let's move to Pre-Tax Income!
Operating Income - Interest Expense = Pre-Tax Income
A business's interest expense is the cost of borrowing money from creditors.
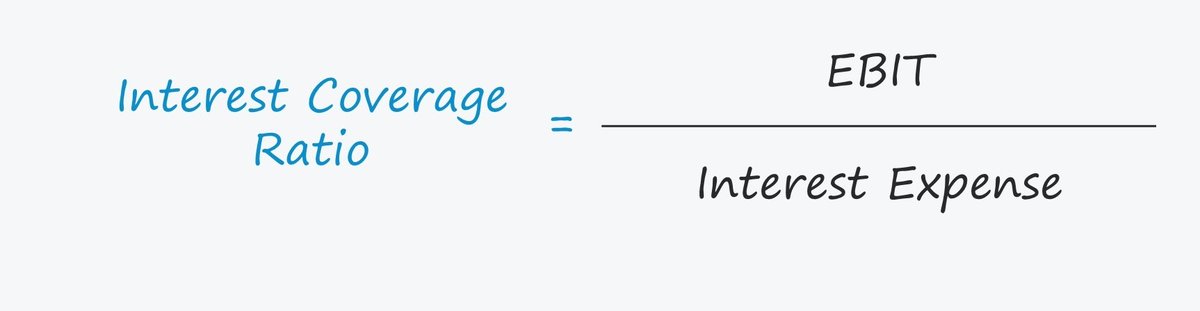
The Interest Coverage Ratio is typically used by investors to assess a company's credit risk
Operating Income - Interest Expense = Pre-Tax Income
A business's interest expense is the cost of borrowing money from creditors.
The Interest Coverage Ratio is typically used by investors to assess a company's credit risk
Interest Coverage Ratio: How much interest expense can a company bear?
Rule of thumb:
Above 3.5x = Safe
Below 1.5x = Risky
To calculate the ICR: Divide Operating Income by Interest Expense
(Operating Income is also commonly referred to as EBIT)
Rule of thumb:
Above 3.5x = Safe
Below 1.5x = Risky
To calculate the ICR: Divide Operating Income by Interest Expense
(Operating Income is also commonly referred to as EBIT)
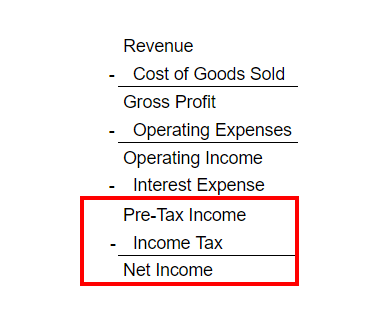
Next up, Net Income!
Pre-Tax Income - Income Tax = Net Income
When assessing the quality of a business...
I seldom look at the Net Income Figure because it is MISLEADING
Pre-Tax Income - Income Tax = Net Income
When assessing the quality of a business...
I seldom look at the Net Income Figure because it is MISLEADING
Two companies that are IDENTICAL in every way (sales, profitability, products, etc)
But with a different capital structure (finance by equity or debt)
Will have a drastically different Net Income figure because of interest expense
But with a different capital structure (finance by equity or debt)
Will have a drastically different Net Income figure because of interest expense
It doesn't necessarily mean that the business with higher Net Income is a better business.
There's opportunity cost when a business is financed by equity.
Other ways where net income is misleading:
- one-off expenses
- one-off gain
- tax breaks
There's opportunity cost when a business is financed by equity.
Other ways where net income is misleading:
- one-off expenses
- one-off gain
- tax breaks
Instead, most investors should assess a business quality by looking at gross profits and operating profits.
This will tell us about a business:
- Profitability
- Pricing power
- Economic moat
- Growth or mature stage
This will tell us about a business:
- Profitability
- Pricing power
- Economic moat
- Growth or mature stage
And that's a wrap!
I hope you enjoyed this!
If you like this, follow me here @steadycompound
I will be writing an in-depth dive into the balance sheet and cash flow statements next.
I hope you enjoyed this!
If you like this, follow me here @steadycompound
I will be writing an in-depth dive into the balance sheet and cash flow statements next.
If you like tweets like this, you might enjoy my weekly newsletter: The Three Bullet Sunday.
Subscribe to receive knowledge bombs on investing every week.
steadycompounding.com
Subscribe to receive knowledge bombs on investing every week.
steadycompounding.com
Still reading?
Awww. You really like me huh?
Then you must check out my newly launched...
Investing Course for Beginners!
You'll learn to:
• Find good investments
• Analyze/ value companies
• Stay Zen during market crashes
Join the tribe here:
zeninvesting.gumroad.com
Awww. You really like me huh?
Then you must check out my newly launched...
Investing Course for Beginners!
You'll learn to:
• Find good investments
• Analyze/ value companies
• Stay Zen during market crashes
Join the tribe here:
zeninvesting.gumroad.com
Loading suggestions...