

Nithin Kamath said that India has over 2 million traders,
but less than 1% of them make more returns than FDs
Here are the fundamentals of trading that anyone can use to earn a good profit from the stock market:
but less than 1% of them make more returns than FDs
Here are the fundamentals of trading that anyone can use to earn a good profit from the stock market:
Fundamental analysis is a process to determine a stock’s fair market value for long term and it involves the consideration of a lot of factors.
But technical analysis is more about predicting the price of stock for short term, based on the past market data.
Here are the basics:
But technical analysis is more about predicting the price of stock for short term, based on the past market data.
Here are the basics:
1. Candlesticks:
It is the basic entity that gives you an idea of what's happening in a stock
It shows the price movement of a stock over a certain period of time
Each candlestick is composed of 2 components:
body and wicks (thin lines extending above and below the body)
It is the basic entity that gives you an idea of what's happening in a stock
It shows the price movement of a stock over a certain period of time
Each candlestick is composed of 2 components:
body and wicks (thin lines extending above and below the body)
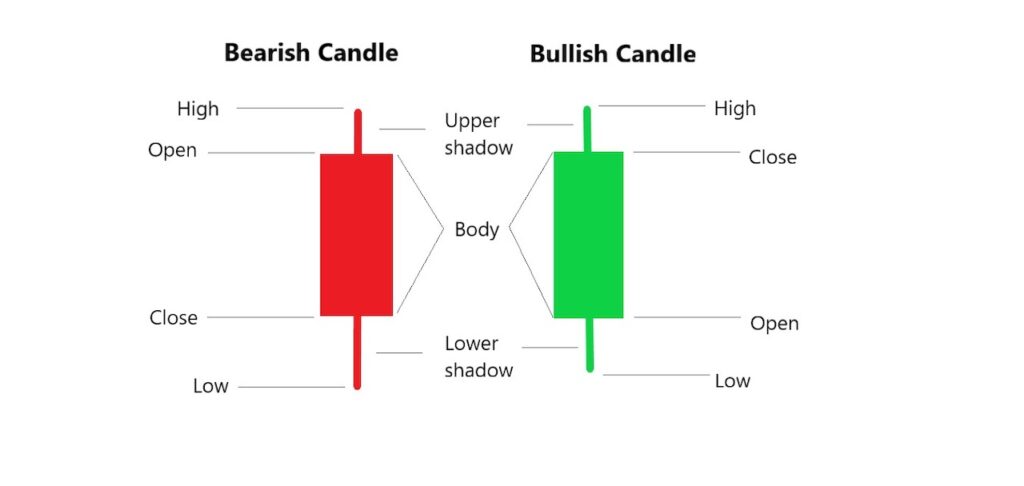
OPEN- the opening price of the candle
HIGH- the highest price it reached
LOW- the lowest price it reached
CLOSE- the closing price of the candle
HIGH- the highest price it reached
LOW- the lowest price it reached
CLOSE- the closing price of the candle
If the closing price is above the opening price, it will be a bullish candle (green) whereas if the closing price is below the opening price, it will be a bearish candle (red).
2. Candlesticks & Analysis
For the candlesticks to come into existence, the opening and the closing prices play a very crucial roles.
They are the sole reason for different types of candlesticks that you see on the charts.
Let's get into 3 most important types of candlesticks:
For the candlesticks to come into existence, the opening and the closing prices play a very crucial roles.
They are the sole reason for different types of candlesticks that you see on the charts.
Let's get into 3 most important types of candlesticks:
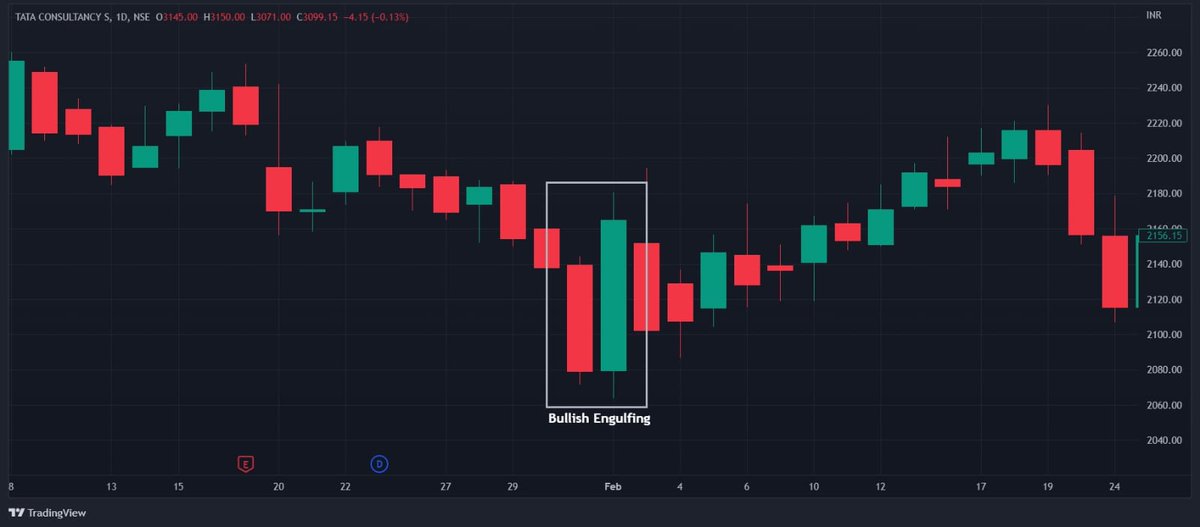
a. Engulfing
An Engulfing candlestick is formed when it completely eats up the previous candlestick.
Bullish Engulfing:
If such a pattern is formed, it suggests that buys have taken the charge and the market might see an upward move.
An Engulfing candlestick is formed when it completely eats up the previous candlestick.
Bullish Engulfing:
If such a pattern is formed, it suggests that buys have taken the charge and the market might see an upward move.
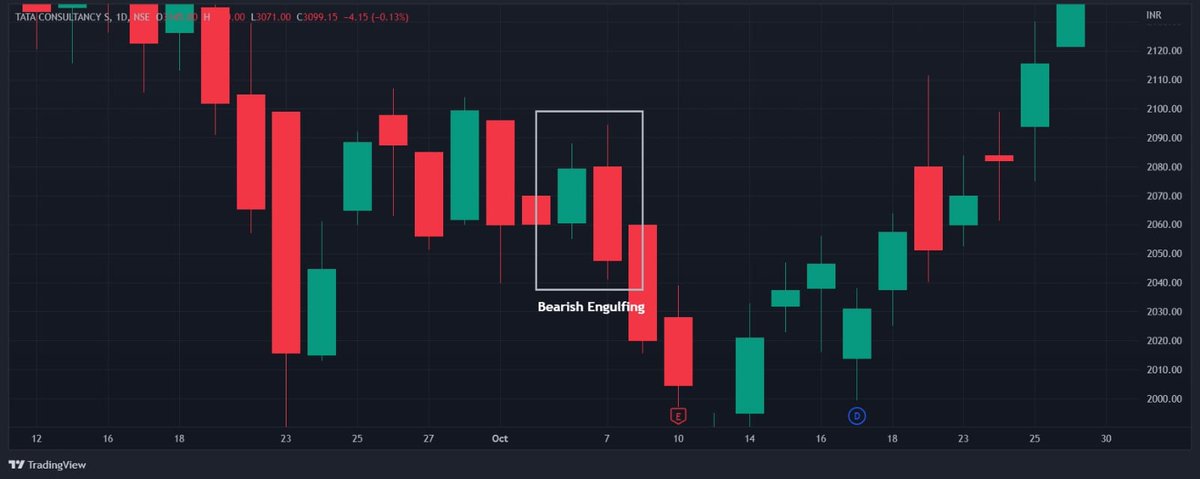
Bearish Engulfing:
If such a pattern is formed, it suggests that sellers have taken the charge and the market might see a downward move.
If such a pattern is formed, it suggests that sellers have taken the charge and the market might see a downward move.
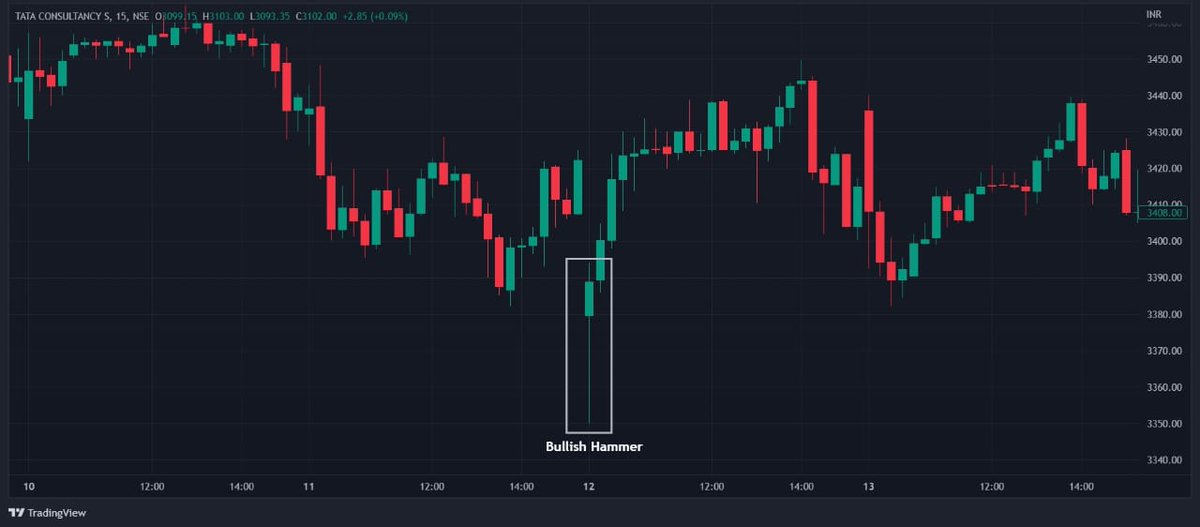
b. Hammer
The Hammer candlestick is formed of a short body with long wick i.e length of the wick should be more than that of the body.
The Hammer candlestick is formed of a short body with long wick i.e length of the wick should be more than that of the body.
Bullish Hammer:
It is formed of short body with long lower wick.
How exactly is it formed?
So, there is a selling pressure constantly but a strong buying pressure comes in and the buyers ultimately take in charge and push the prices further up forming a long lower wick.
It is formed of short body with long lower wick.
How exactly is it formed?
So, there is a selling pressure constantly but a strong buying pressure comes in and the buyers ultimately take in charge and push the prices further up forming a long lower wick.
Bearish Hammer:
It is formed of short body with long upper wick.
Here, there is a buying pressure constantly but a strong selling pressure comes in and the sellers ultimately take in charge and push the prices further lower forming a long upper wick.
It is formed of short body with long upper wick.
Here, there is a buying pressure constantly but a strong selling pressure comes in and the sellers ultimately take in charge and push the prices further lower forming a long upper wick.
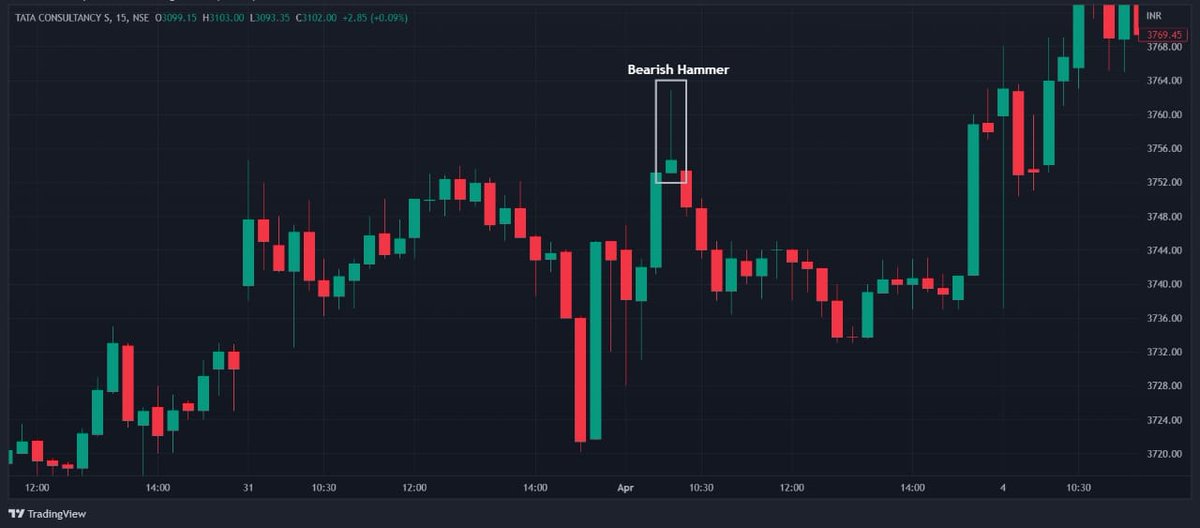
Note: A bullish hammer can be red while a bearish hammer can be green (as shown in the image above).
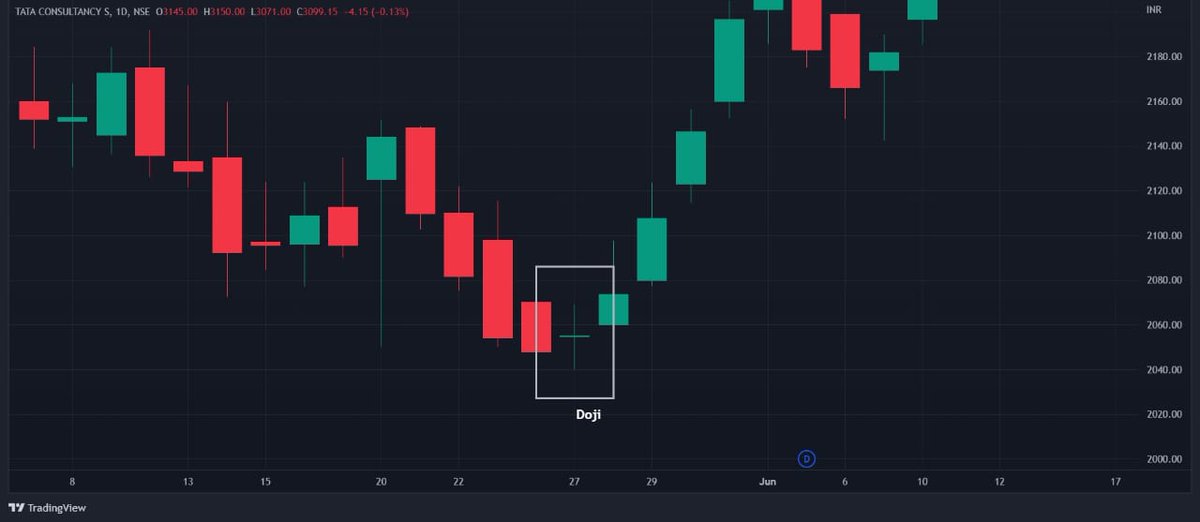
c. Doji
A standard Doji is a single candlestick whose open and close price is at same level.
There is a wick on either side but price fails to sustain above and below it's opening price.
This shows that there is uncertainty in the market between the buyers and sellers.
A standard Doji is a single candlestick whose open and close price is at same level.
There is a wick on either side but price fails to sustain above and below it's opening price.
This shows that there is uncertainty in the market between the buyers and sellers.
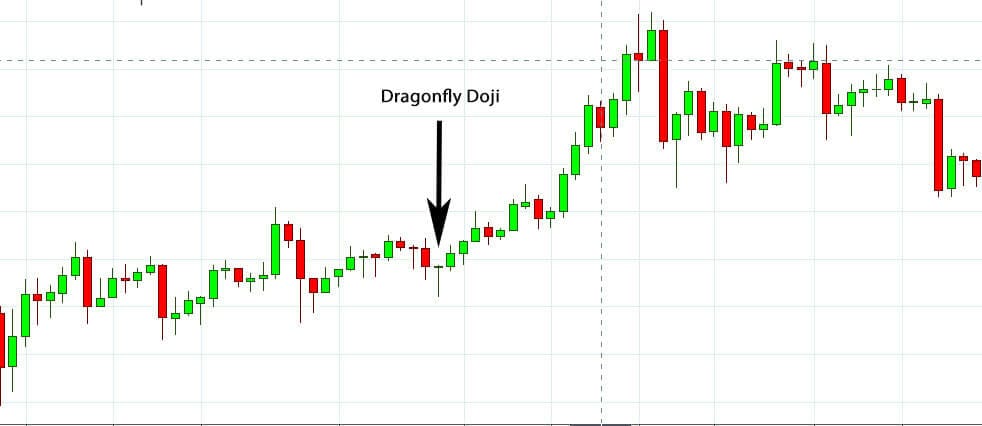
Dragonfly Doji:
A dragonfly doji does not have a wick at the upper end which signifies that the prices did not move above it's opening price.
If the dragonfly doji appears at bottom of the move to the downside, it's a bullish signal.
A dragonfly doji does not have a wick at the upper end which signifies that the prices did not move above it's opening price.
If the dragonfly doji appears at bottom of the move to the downside, it's a bullish signal.
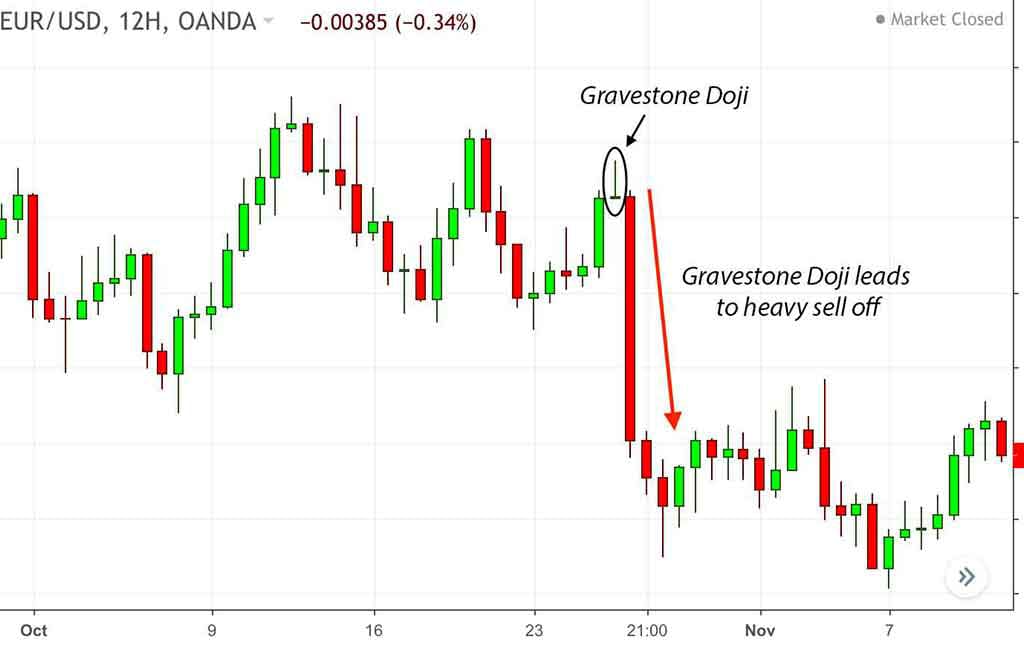
Gravestone Doji:
A gravestone Doji is the opposite of a dragonfly doji ie. it does not have a wick at the lower end, signifying that prices did not move below the opening price.
If the gravestone doji appears at top of the move to the upside, it's a bearish signal.
A gravestone Doji is the opposite of a dragonfly doji ie. it does not have a wick at the lower end, signifying that prices did not move below the opening price.
If the gravestone doji appears at top of the move to the upside, it's a bearish signal.
Note: The candlesticks should not be observed in isolation. The past patterns are crucial when it comes to candlestick analysis.
3. Price Action
Price action is the movement of a price plotted over time.
3. Price Action
Price action is the movement of a price plotted over time.
Price action forms the basis for all technical analyses of a stock, commodity or other asset charts.
Many short-term traders rely exclusively on price action and the formations and trends extrapolated from it to make trading decisions.
Many short-term traders rely exclusively on price action and the formations and trends extrapolated from it to make trading decisions.
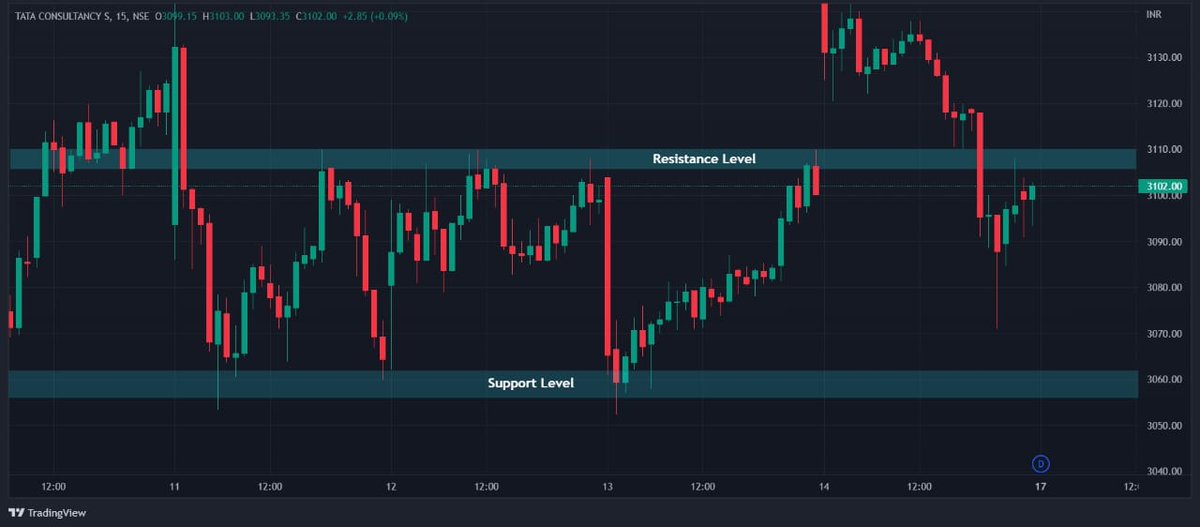
a. Support / Resistance (S/R)
Let's keep this very short and simple:
When price approaches an important level from above, it is called support
Whereas, if it approaches that level from below, the level is called resistance level.
Let's keep this very short and simple:
When price approaches an important level from above, it is called support
Whereas, if it approaches that level from below, the level is called resistance level.
Now if the support level is broken with power, the very level becomes a resistance level and vice versa.
But what exactly is a support/ resistance level and how do I identify it?
Support/Resistance levels are formed based on supply and demand zones. Let's break it down for you:
But what exactly is a support/ resistance level and how do I identify it?
Support/Resistance levels are formed based on supply and demand zones. Let's break it down for you:
-Support is a price level where a downtrend can be expected to come to a halt due to a concentration of demand or buying interest.
-Resistance is a price level where an uptrend can be expected to come to a halt due to a concentration of supply or selling interest.
-Resistance is a price level where an uptrend can be expected to come to a halt due to a concentration of supply or selling interest.
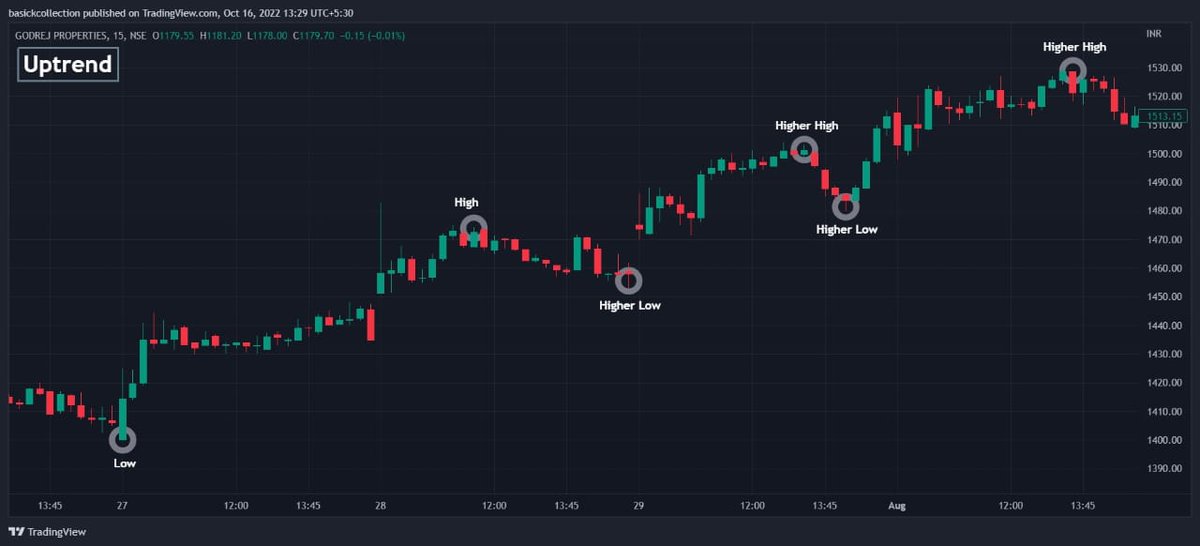
b. Trends
A trend is simply a broad upward or downward movement of price over time.
Uptrend: A stock can be said to be in an uptrend when the overall price movement is upwards.
A trend is simply a broad upward or downward movement of price over time.
Uptrend: A stock can be said to be in an uptrend when the overall price movement is upwards.
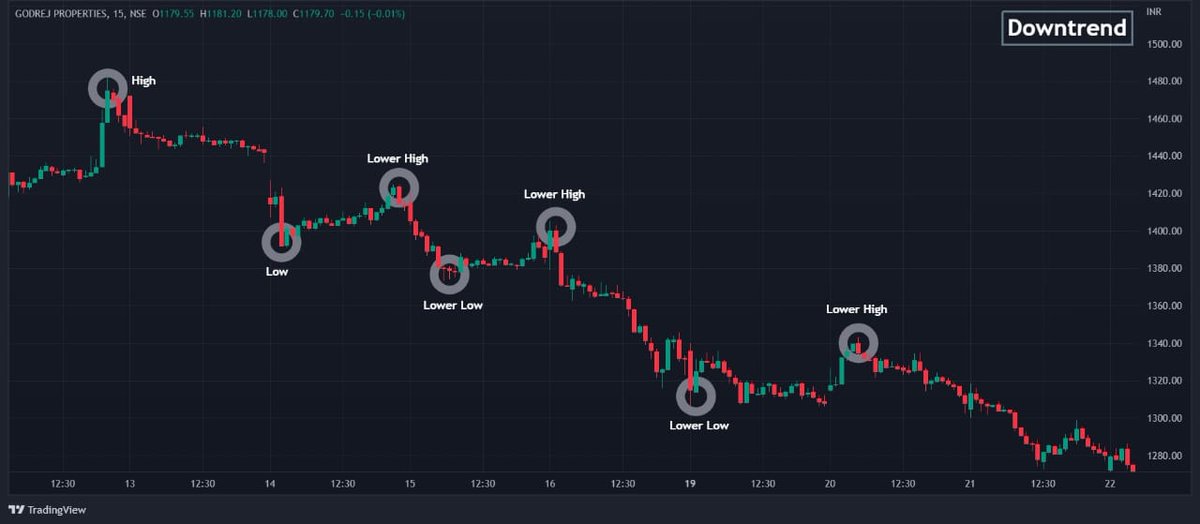
Downtrend: A stock can be said to be in a downtrend when the overall price movement is downwards.
It can be identified when the price makes a higher low and lower low and then the two steps repeat over and over again.
It can be identified when the price makes a higher low and lower low and then the two steps repeat over and over again.
Besides the two mentioned above, you will sometimes see the price to be continuously having multiple rejections from Support and Resistance zones.
Such behavior can be seen when there is uncertainty in the market regarding the price of a stock.
Such behavior can be seen when there is uncertainty in the market regarding the price of a stock.
And hence the price tends to remain in a range forming a Range bound/ Consolidation market.
The price can breakout on either side and a strong movement can be seen towards the break.
The price can breakout on either side and a strong movement can be seen towards the break.
c. Trendline
A trendline is a bounding line for the movement of price.
It is formed when a diagonal line can be drawn between a minimum of three or more price pivot points.
A line can be drawn between any two points, but it does not qualify as a trend line until tested.
A trendline is a bounding line for the movement of price.
It is formed when a diagonal line can be drawn between a minimum of three or more price pivot points.
A line can be drawn between any two points, but it does not qualify as a trend line until tested.
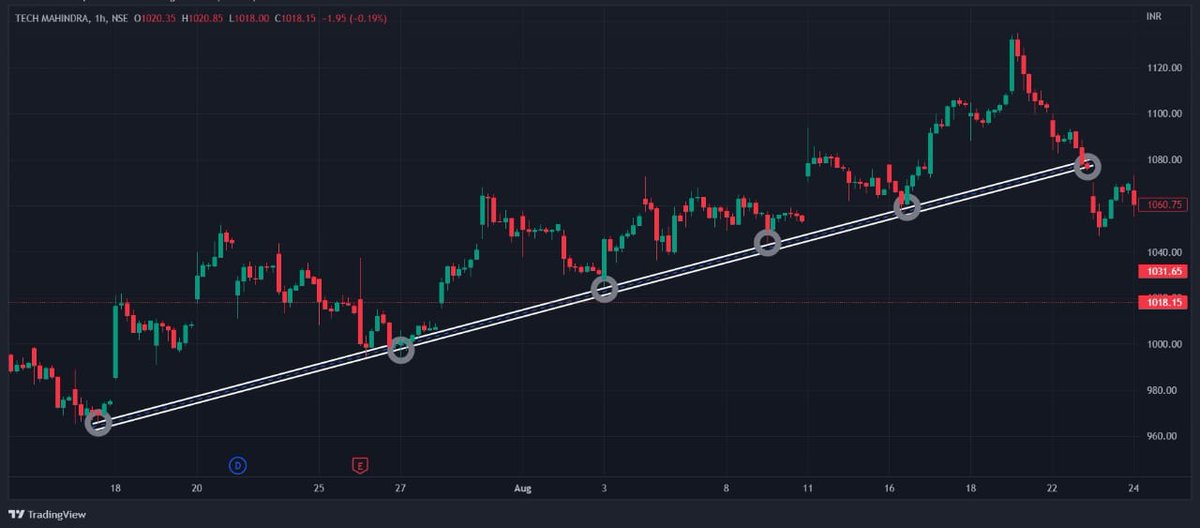
To simplify it, the trendline acts as a Diagonal S/R from which price makes a rejection.
Enjoyed learning this much? Then we're not going to send you in information overload.
This was the end of part 1 of this thread. Part 2 is coming next Wednesday.
This was the end of part 1 of this thread. Part 2 is coming next Wednesday.
If you liked this thread, do Retweet the 1st tweet and follow us @FinFloww for the next one!
Get part 2 before everyone else. Join the 4189 WhatsApp Newsletter community members who receive content regularly:
chat.whatsapp.com
chat.whatsapp.com
Here's the PART 2:
Loading suggestions...