

One of the best tools for Options Traders is @iChartsIndia
9 things Icharts can do, you'll wish you knew yesterday:
Collaborated with @niki_poojary
🧵
9 things Icharts can do, you'll wish you knew yesterday:
Collaborated with @niki_poojary
🧵
By the end of this thread, you'll learn 7 features with uses:
1. Option Chain (Advanced) features
2. Total PE - CE OI
3. Options Intraday OI Breakup
4. Cumulative OI change
5. Backtesting historical Data
6. Data in different intervals
7. Straddle/Strangle Charts
Let's go ↓
1. Option Chain (Advanced) features
2. Total PE - CE OI
3. Options Intraday OI Breakup
4. Cumulative OI change
5. Backtesting historical Data
6. Data in different intervals
7. Straddle/Strangle Charts
Let's go ↓
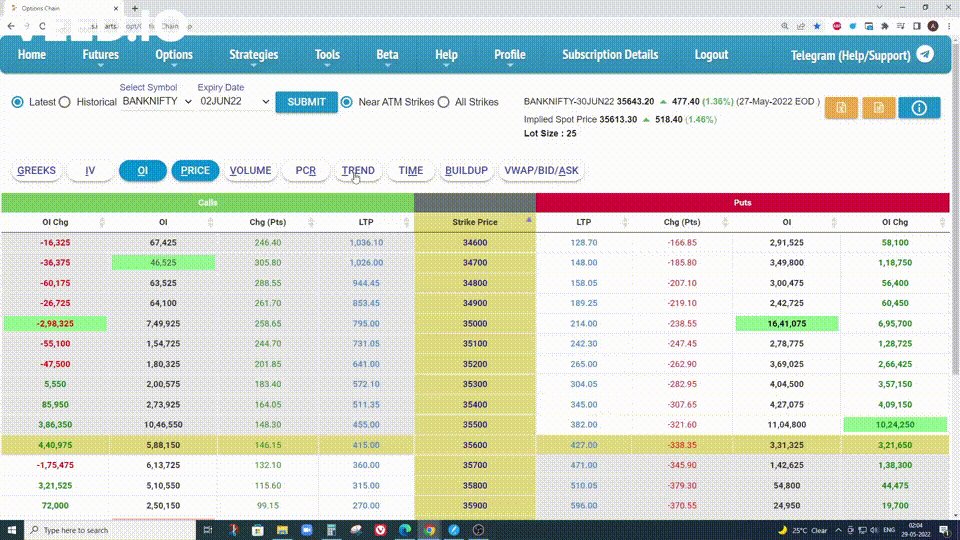
1. Option Chain (Advanced):
Uses:
• Understand the options chain better
• Know the correct market direction and
• Sell the right options with a higher probability of success.
Open Option Chain on Icharts and then click on:
• Trend
• Buildup
• Vwap
Like this:
Uses:
• Understand the options chain better
• Know the correct market direction and
• Sell the right options with a higher probability of success.
Open Option Chain on Icharts and then click on:
• Trend
• Buildup
• Vwap
Like this:
2. Total PE - CE OI
Most popular and powerful feature, even used by experts like @nitinmurarkasmc heavily.
Observe the intraday Change in OI difference and align your trades with where writing is happening.
Can check it only for nearer strikes, or all strikes.
Here's how:
Most popular and powerful feature, even used by experts like @nitinmurarkasmc heavily.
Observe the intraday Change in OI difference and align your trades with where writing is happening.
Can check it only for nearer strikes, or all strikes.
Here's how:

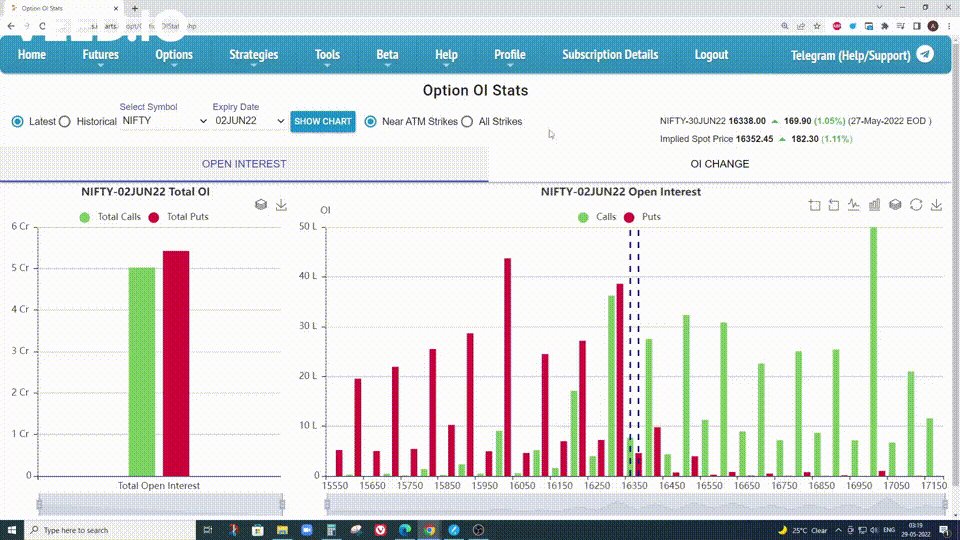
3. Option OI stats
Shows you Total OI and Change in OI in bar chart format.
Can segregate from Near Atm strikes to all strikes.
Historical Data of past expiries is also available to make backtesting easier.
Shows you Total OI and Change in OI in bar chart format.
Can segregate from Near Atm strikes to all strikes.
Historical Data of past expiries is also available to make backtesting easier.
4. Options snapshot
Option Chain with charts and Price and Open Interest showing in them.
Can look where open interest changes are happening.
Know quickly about multiple strikes Oi behaviors.
Option Chain with charts and Price and Open Interest showing in them.
Can look where open interest changes are happening.
Know quickly about multiple strikes Oi behaviors.

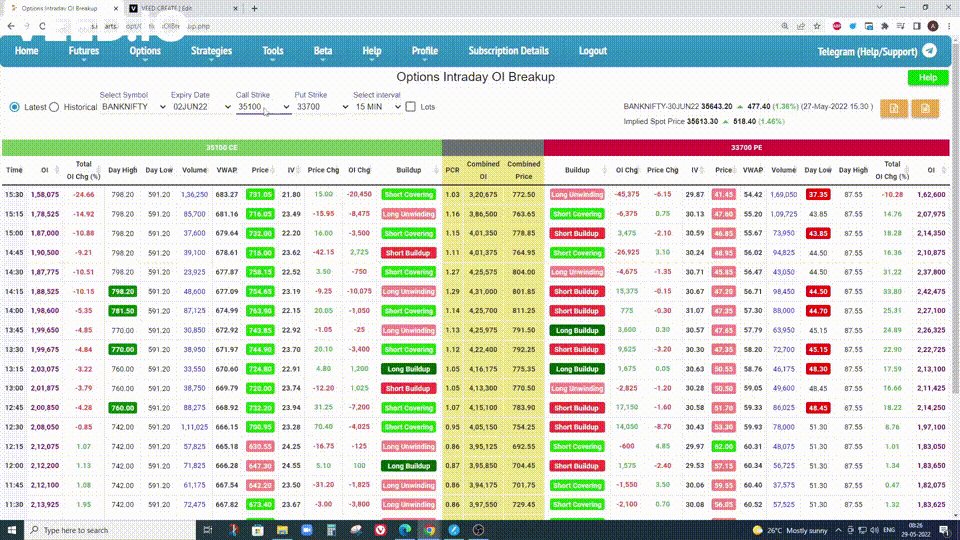
5. Options Intraday OI Breakup
Can see the individual data of any strike at any interval you want as per your liking.
I have seen a few scalper traders recommending this to their followers.
Can see the individual data of any strike at any interval you want as per your liking.
I have seen a few scalper traders recommending this to their followers.
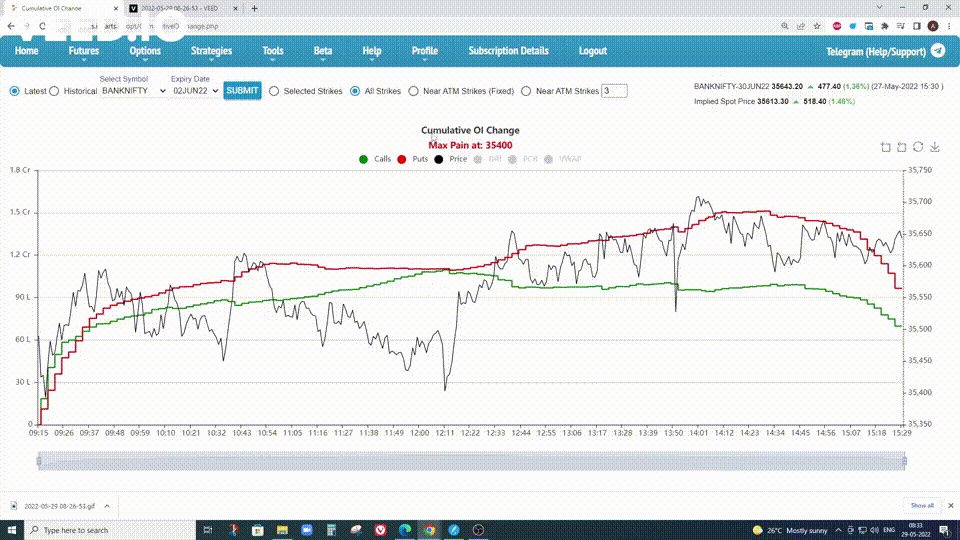
6. Cumulative OI change
Compare the total Open interest of the whole option chain amongst Calls and Puts.
Can also see this only for the near ATM strikes.
Can check historical data as well.
Compare the total Open interest of the whole option chain amongst Calls and Puts.
Can also see this only for the near ATM strikes.
Can check historical data as well.
7. Backtesting historical Data
The most powerful feature of Icharts is the ability to backtest historical options data with ease.
Nearly all features have this feature enabled in them.
For eg, on Gap days can see how premiums behaved on the gap side and be prepared next time.
The most powerful feature of Icharts is the ability to backtest historical options data with ease.
Nearly all features have this feature enabled in them.
For eg, on Gap days can see how premiums behaved on the gap side and be prepared next time.
8. Data in different time intervals
Another awesome feature of Icharts is the ability to see any data in any time interval as we see fit.
For eg 3 mins, 5 mins, 10 mins, 15 mins, etc all can be seen separately.
Another awesome feature of Icharts is the ability to see any data in any time interval as we see fit.
For eg 3 mins, 5 mins, 10 mins, 15 mins, etc all can be seen separately.
9. Strangle/Straddle Charts
Most of the people started using Icharts as they were offering strangle/straddle charts.
This is particularly useful for traders wanting to sell straddles when they are decaying (falling in premiums).
Same for strangles.
Most of the people started using Icharts as they were offering strangle/straddle charts.
This is particularly useful for traders wanting to sell straddles when they are decaying (falling in premiums).
Same for strangles.
If you enjoy such threads, here's the one I wrote yesterday:
Icharts keeps coming out with new features constantly.
Keep an eye out for all these cool new features.
You'll find relevant information on these updates on these twitter handles.
Follow them for Ichart updates:
@iamswingtrader & @iChartsIndia
Keep an eye out for all these cool new features.
You'll find relevant information on these updates on these twitter handles.
Follow them for Ichart updates:
@iamswingtrader & @iChartsIndia
@iamswingtrader from @iChartsIndia and his team have done a great job in providing a one-place solution for data readers and data lovers.
If you have any questions for them feel free to reach out to them and if you do like the service they are providing you can take the same!
If you have any questions for them feel free to reach out to them and if you do like the service they are providing you can take the same!
That's a wrap!
If you enjoyed this thread:
1. Follow us @Adityatodmal & @niki_poojary for more threads on Price action, Option Selling & Trading growth.
We've got you covered.
2. RT the first Tweet to share it with your audience.
I appreciate it!
If you enjoyed this thread:
1. Follow us @Adityatodmal & @niki_poojary for more threads on Price action, Option Selling & Trading growth.
We've got you covered.
2. RT the first Tweet to share it with your audience.
I appreciate it!
Loading suggestions...