

No one knows what will happen tonight with the FED but the EOD data showing some sign of pause here or downmove. Lets see how they are stacked up.
Do remember this is purely based on data that was traded today and if things changes tmw we have to change the stance also
Do remember this is purely based on data that was traded today and if things changes tmw we have to change the stance also
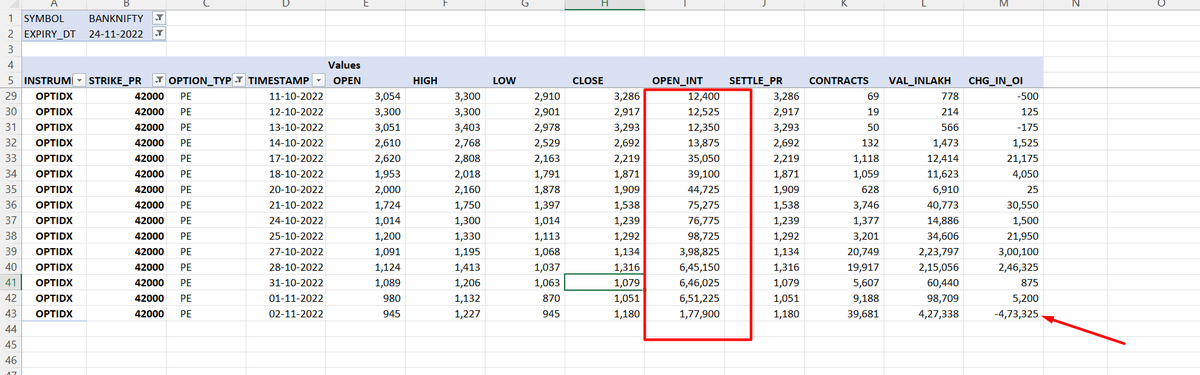
There are two pictures attached here. One contains the total EOD OI outstanding as of today and the second one shows the changes during the day.
While the total column looks still positive for in Option chain but when you go and see the trades during the day, there is unwinding
While the total column looks still positive for in Option chain but when you go and see the trades during the day, there is unwinding
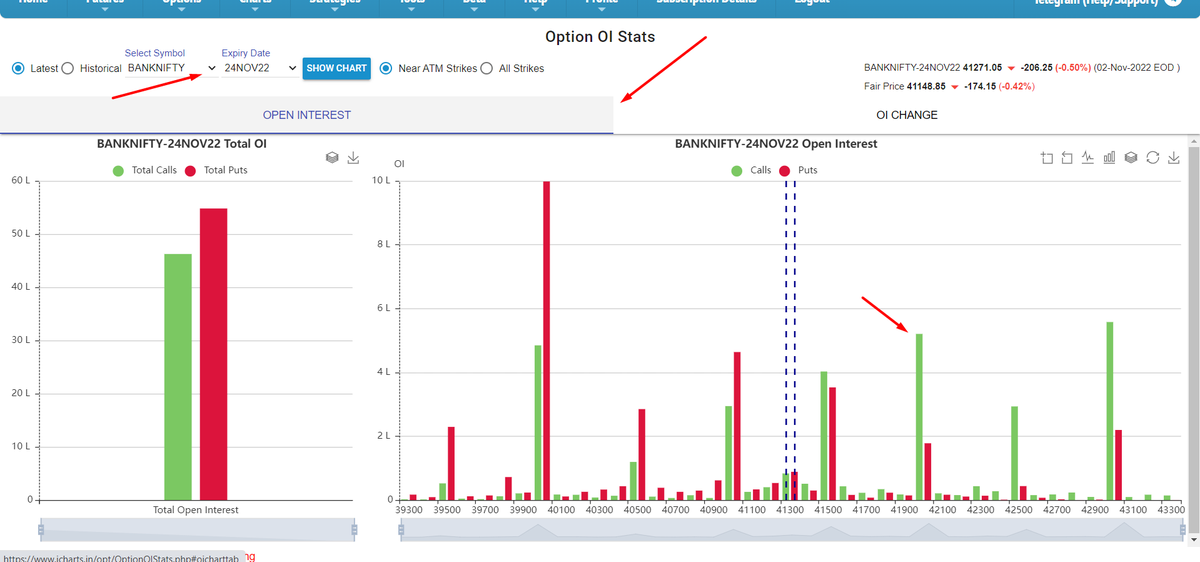
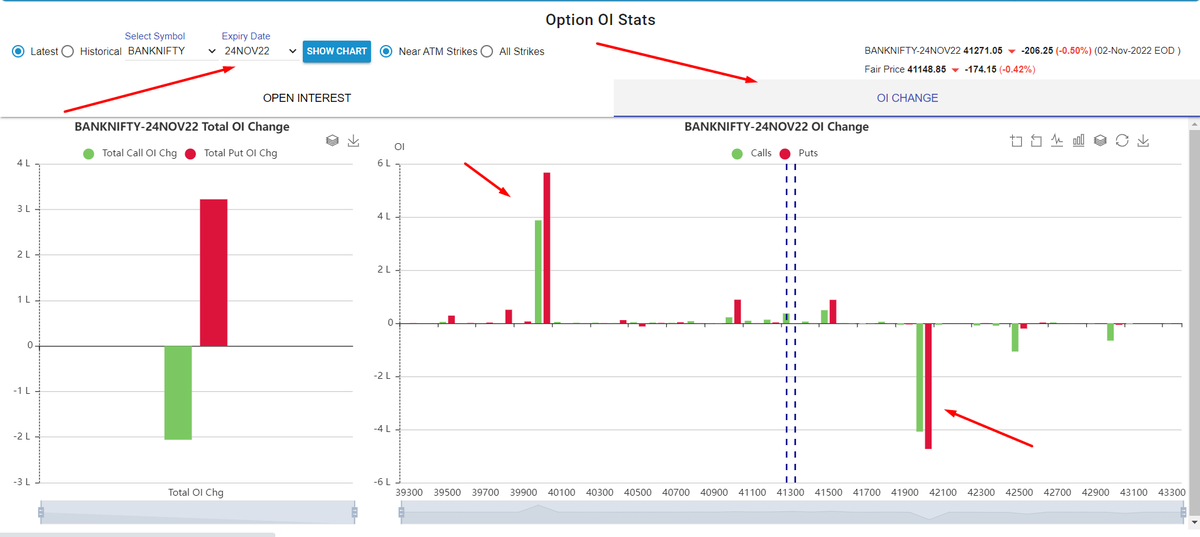
in 42000PE and writing in 41000CE today.
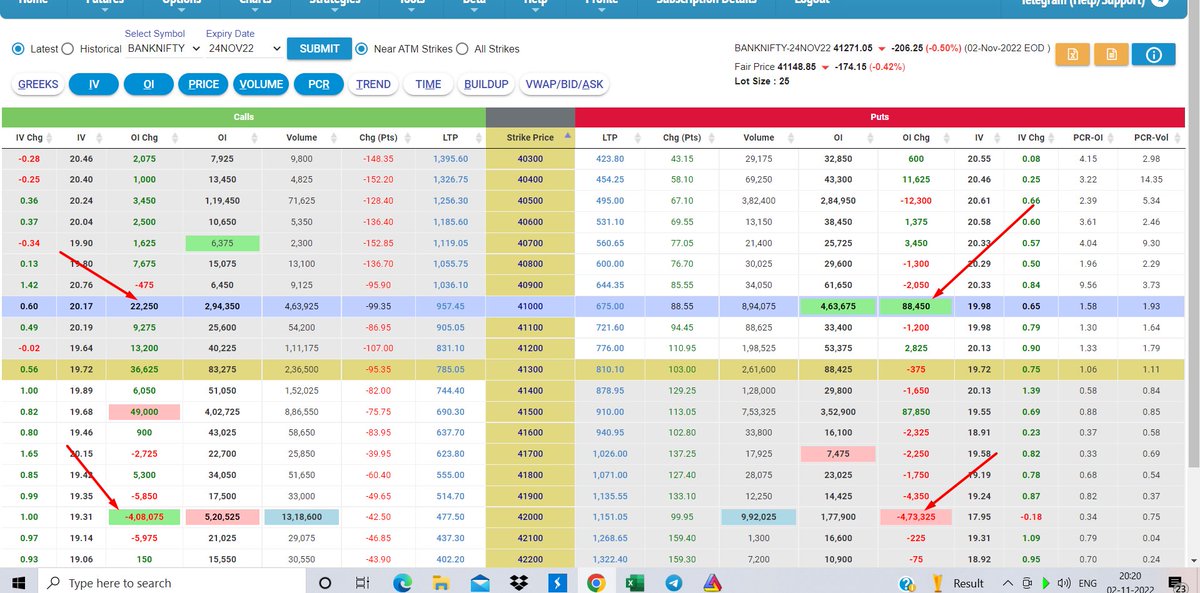
42000PE decreased OI by almost 70% today while there is small rise in 41000CE today.
42000PE decreased OI by almost 70% today while there is small rise in 41000CE today.
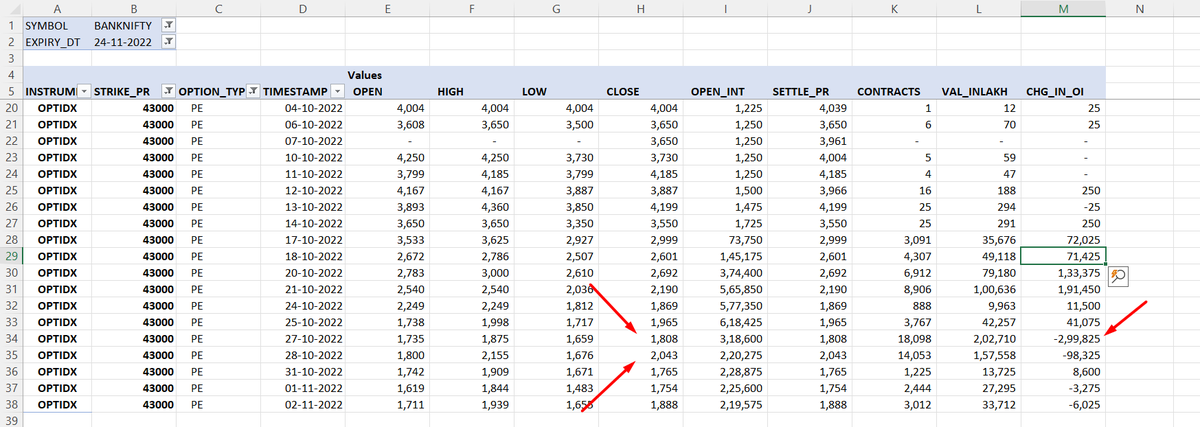
See the chart of 43000PE monthly. It gave a big fall from 2670 to 1500 during 21/10 to 1/11. If u draw AVWAP from that 2670 level it comes to around 1880 levels(say 1900) and today this PE closed at 1915.
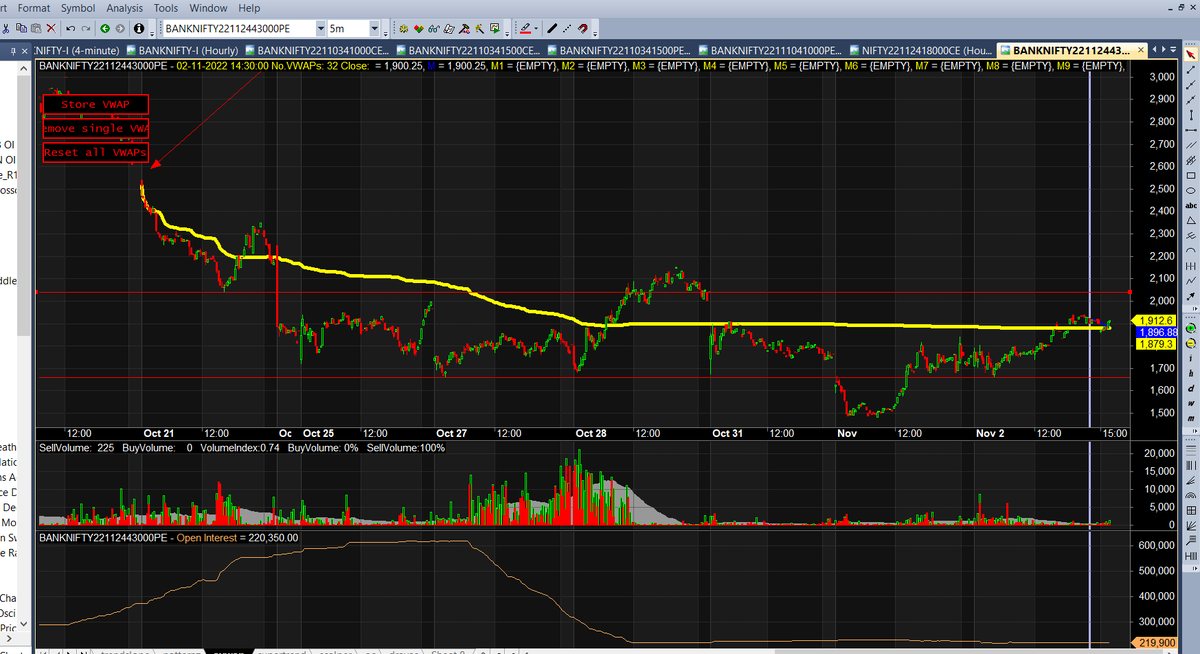
This PE made a big Red candle of 2250-1885 on 24/10(Diwali day) . Also there was small support around 2050 levels in this PE on 21/10. So if this PE starts to trade above 2050, then we can expect good fall in BNF.
For me, if this PE is trading between 1850-2050, that will classify as NO TRADING ZONE and below 1850 we can again expect some bullish moves.
Plz note these AVWAP levels changes daily and hence the levels will keep revising based on market move but this PE chart can be used to
Plz note these AVWAP levels changes daily and hence the levels will keep revising based on market move but this PE chart can be used to
gauge next move of market.
You can find the history of 42000PE/43000PE of this expiry in below SS and can see what happened when 43000PE exited last time.
You can find the history of 42000PE/43000PE of this expiry in below SS and can see what happened when 43000PE exited last time.
As I dont trade events and hence not carrying any trade. Also I know few idiots will make fun of this data, but I appreciate that they follow all my tweets under false name . Rest choice is yours whether you learn or troll and get blocked immediately.
Loading suggestions...