

PRICE ACTION is the movement of a security’s price over time
It is the data source off which most indicators are built
Master price action and you can analyse just about any chart accurately and confidently
Let's know more about it…..
Thread 🧵 (bonus at the end)
It is the data source off which most indicators are built
Master price action and you can analyse just about any chart accurately and confidently
Let's know more about it…..
Thread 🧵 (bonus at the end)
You can interpret a lot from price action and prepare your plan for ahead.
It ignores the factors that influence a market’s movement, and instead it looks primarily at the security’s price history. 📈
It ignores the factors that influence a market’s movement, and instead it looks primarily at the security’s price history. 📈
A price action pattern is a shape that helps to suggest what prices might do, based on what they have done.
A few patterns which continue to prove themselves right repeatedly (with rare exceptions ) are listed below 👇
A few patterns which continue to prove themselves right repeatedly (with rare exceptions ) are listed below 👇
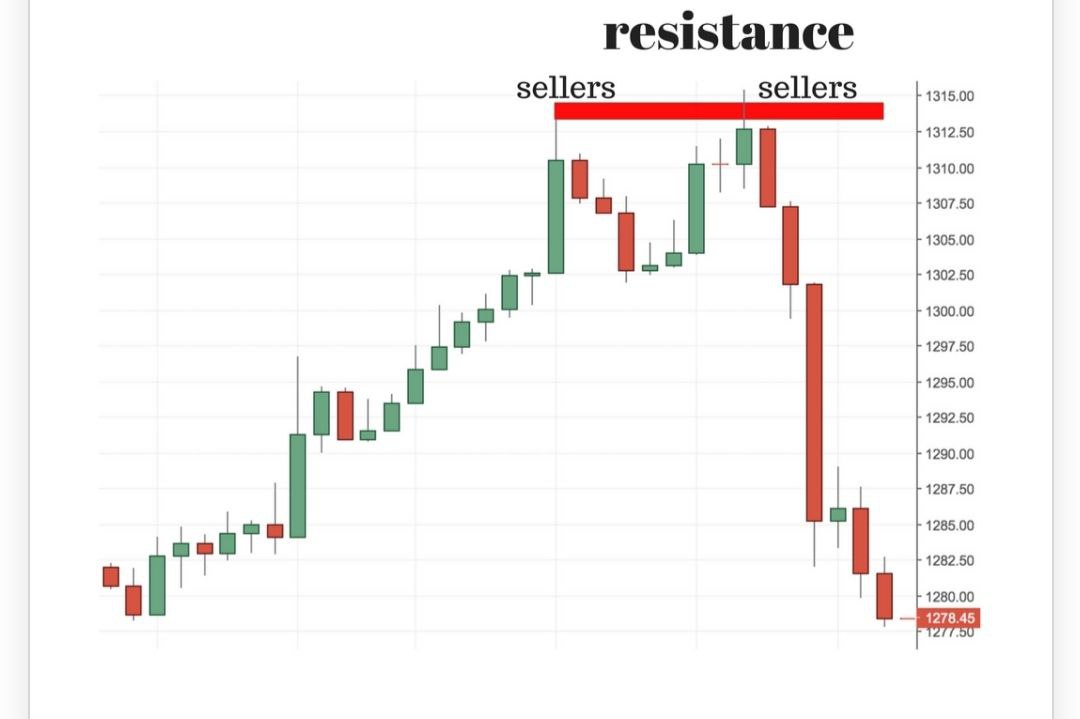
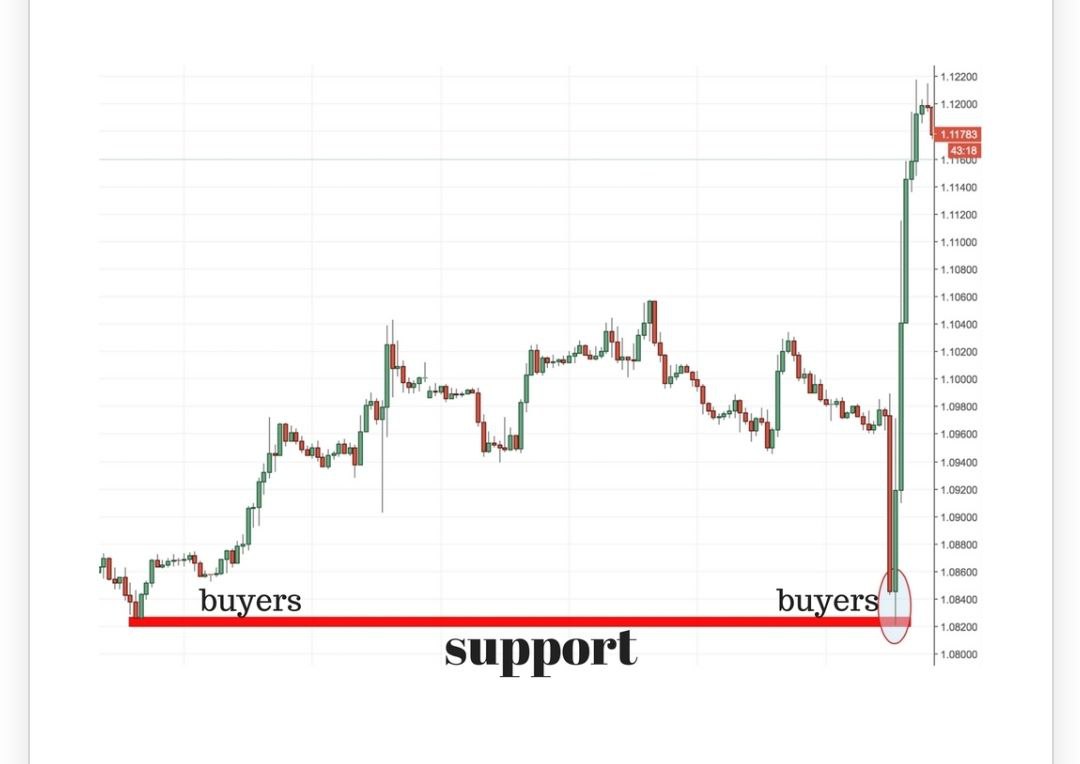
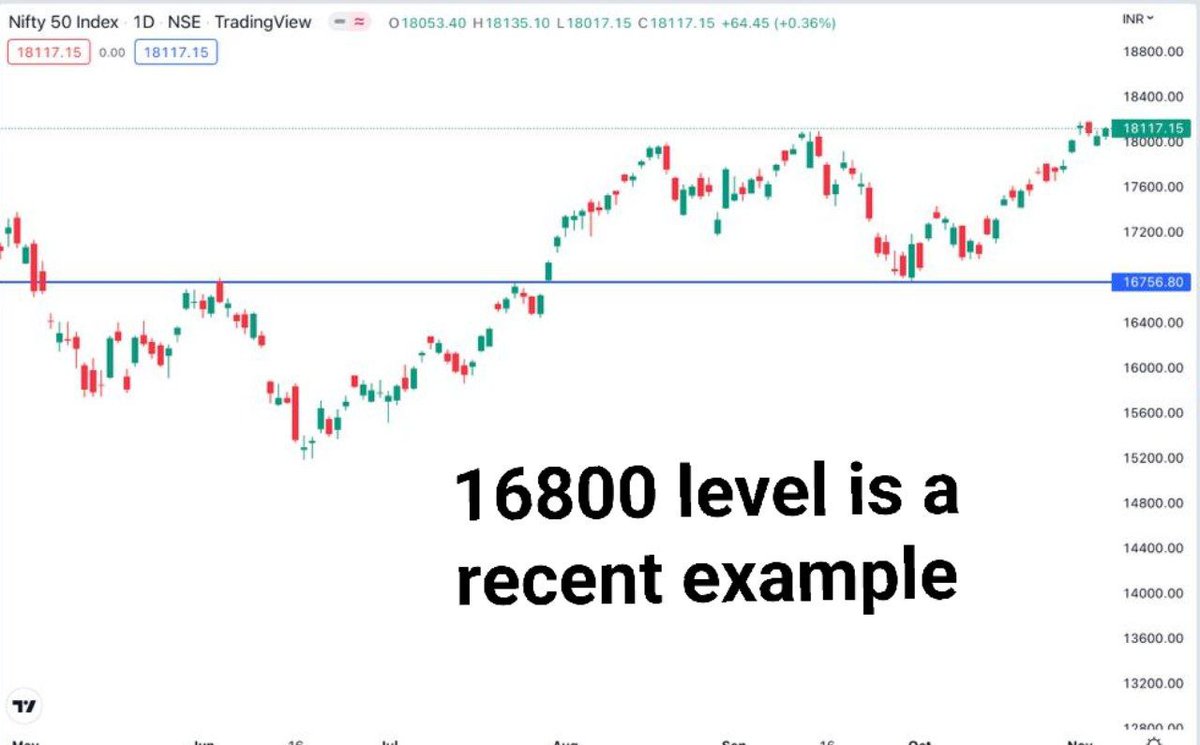
1. SUPPORTS AND RESISTANCES
• Most important tools
• Highly reliable
• Simple to spot and plot
• IMPORTAN thing to keep in mind
Levels drawn on higher time frames tend to be more important and reliable and can give trades with HIGH risk to reward ratio
• Most important tools
• Highly reliable
• Simple to spot and plot
• IMPORTAN thing to keep in mind
Levels drawn on higher time frames tend to be more important and reliable and can give trades with HIGH risk to reward ratio
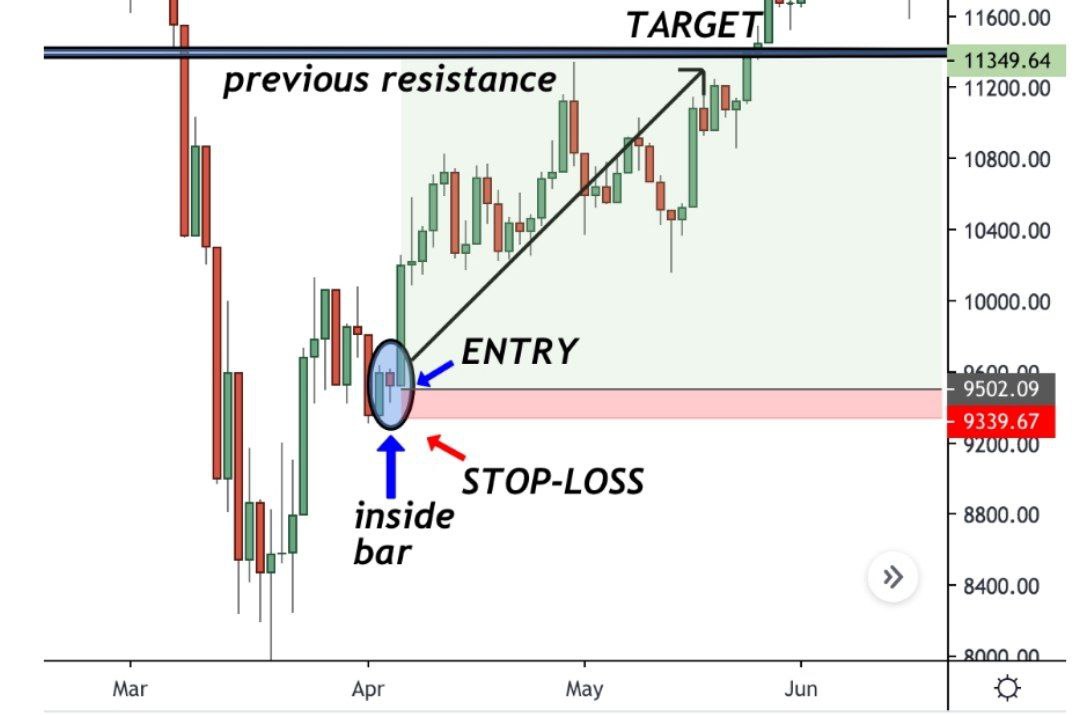
2. INSIDE CANDLE IN A TREND
• Very high risk to reward ratio
• Tight SL is defined
• Very high risk to reward ratio
• Tight SL is defined
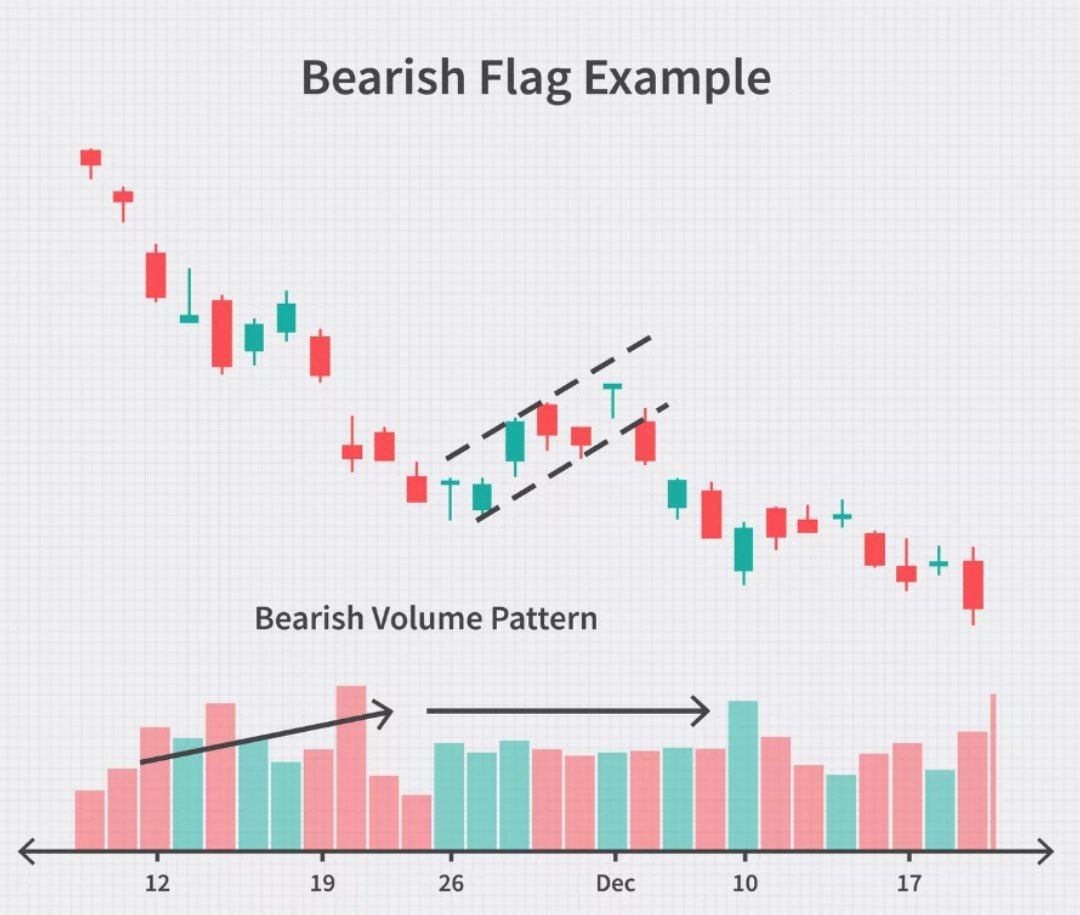
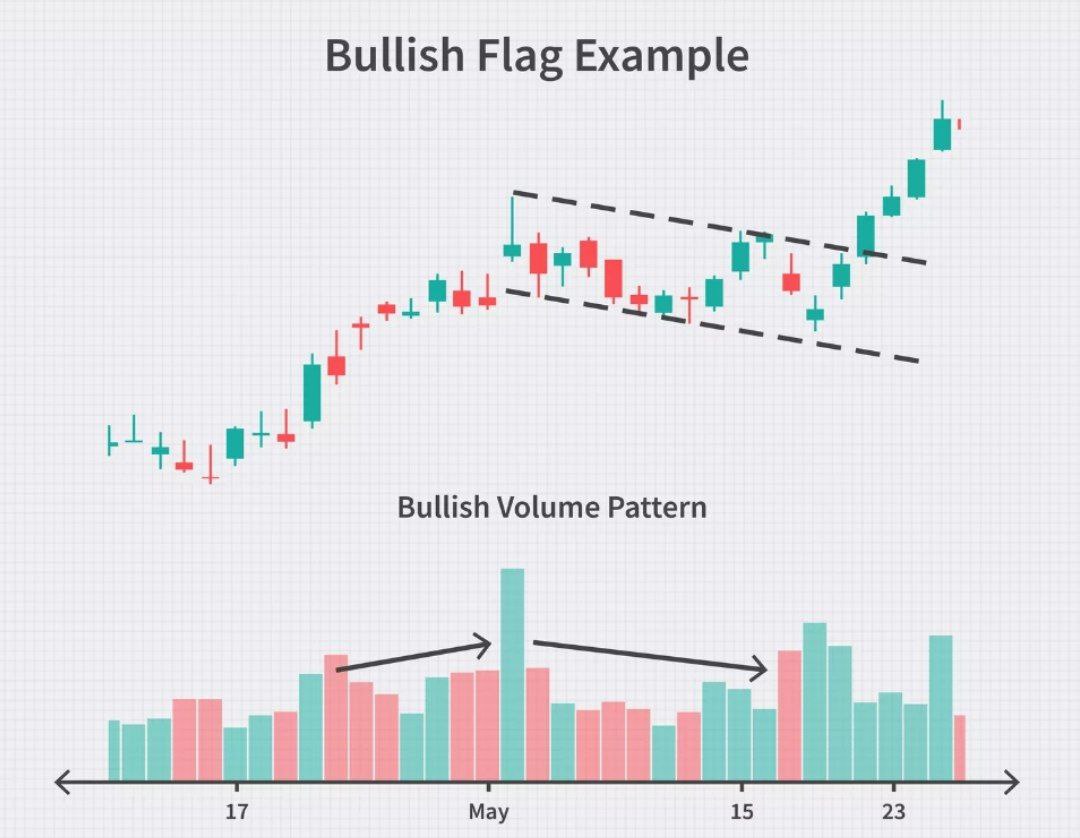
3. FLAG PATTERNS
• Continuation pattern
• Occurs after a strong rally, these patterns are small hesitations in a big trend
• The flag pattern appears as a small rectangle that is usually tilted against the prevailing trend in price
• Continuation pattern
• Occurs after a strong rally, these patterns are small hesitations in a big trend
• The flag pattern appears as a small rectangle that is usually tilted against the prevailing trend in price
• Bearish flag :- higher highs and higher lows
When the price pauses its downward movement, the increasing volume may not decline, but rather hold at a level, implying a pause in the anxiety levels
When the price pauses its downward movement, the increasing volume may not decline, but rather hold at a level, implying a pause in the anxiety levels
• Bullish flag :- lower highs and lower lows
The volume does not always decline during the consolidation.
Because downward trending price moves are usually driven by investor fear and anxiety over falling prices
The volume does not always decline during the consolidation.
Because downward trending price moves are usually driven by investor fear and anxiety over falling prices
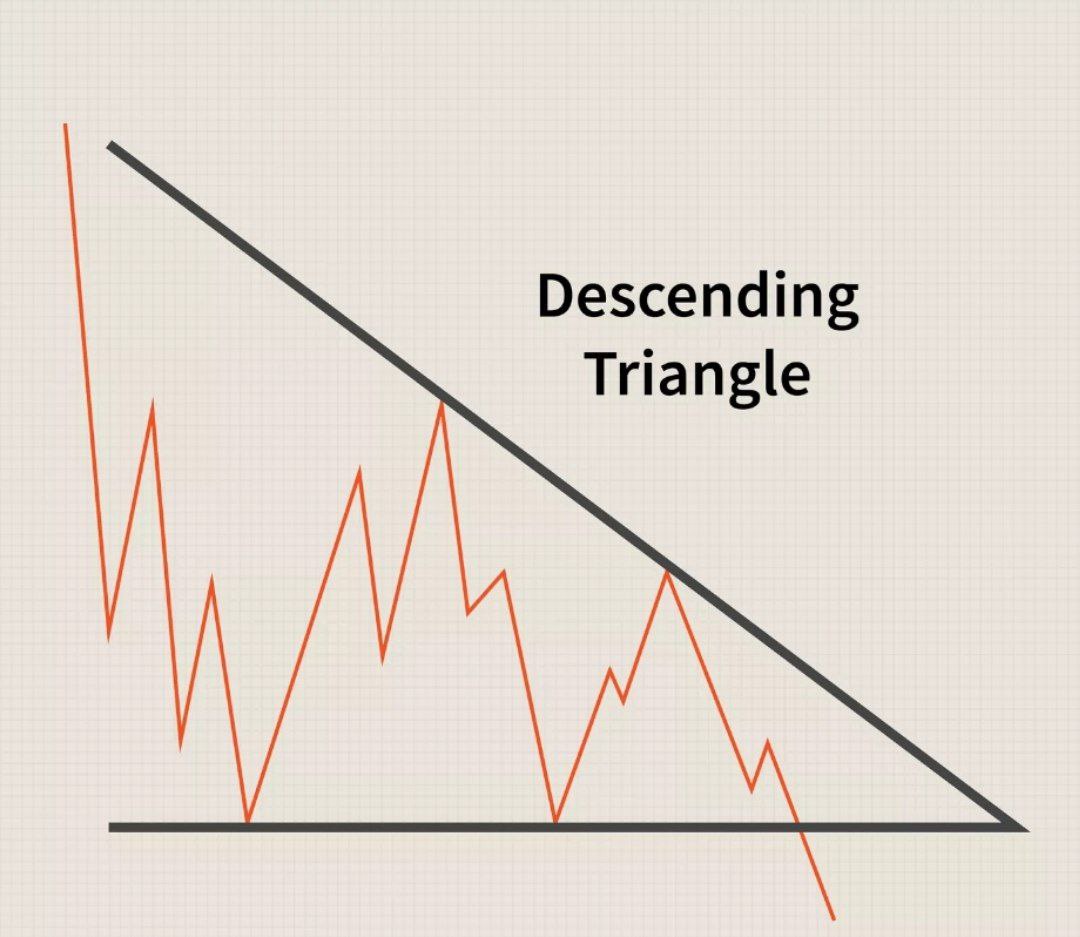
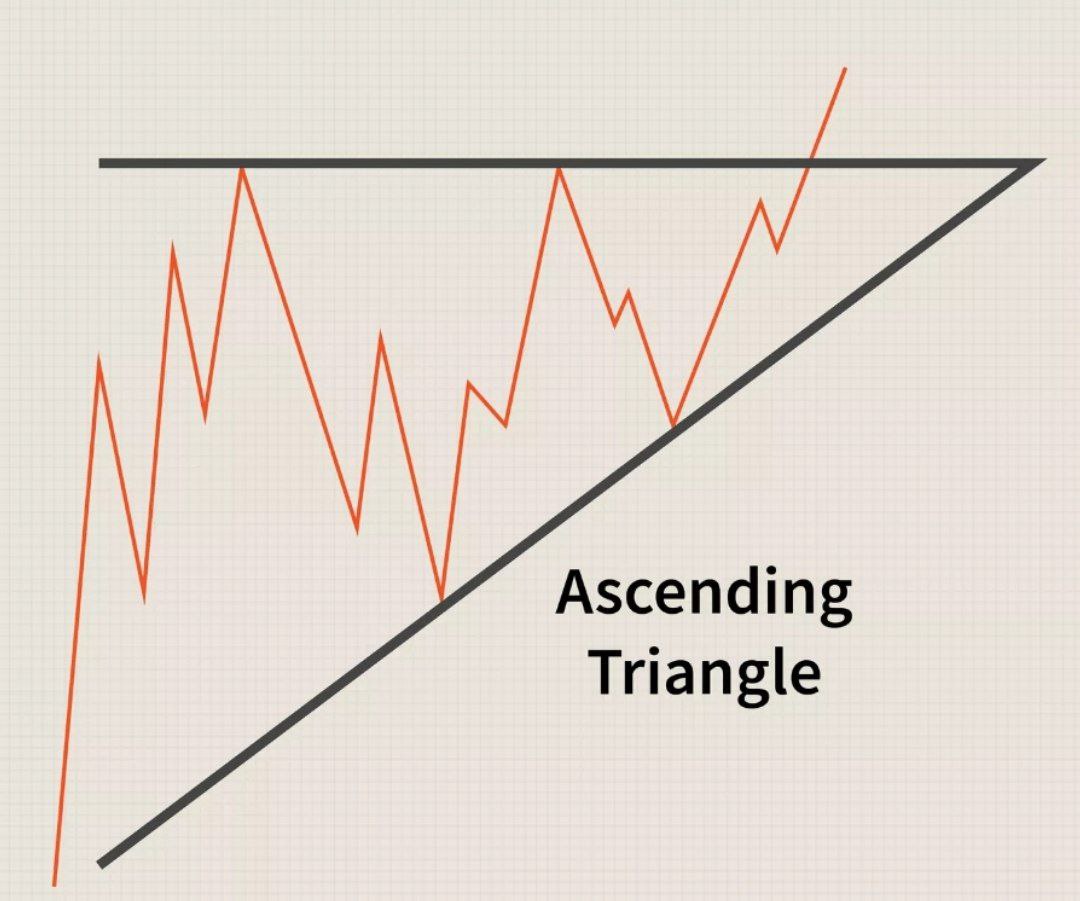
4. TRIANGLE PATTERNS
• Continuation pattern
• Easier to spot on the chart
• Ascending triangle :- two or more equal highs and higher low
• Descending triangle :- two or more equal lows with a series of lower highs
• Continuation pattern
• Easier to spot on the chart
• Ascending triangle :- two or more equal highs and higher low
• Descending triangle :- two or more equal lows with a series of lower highs
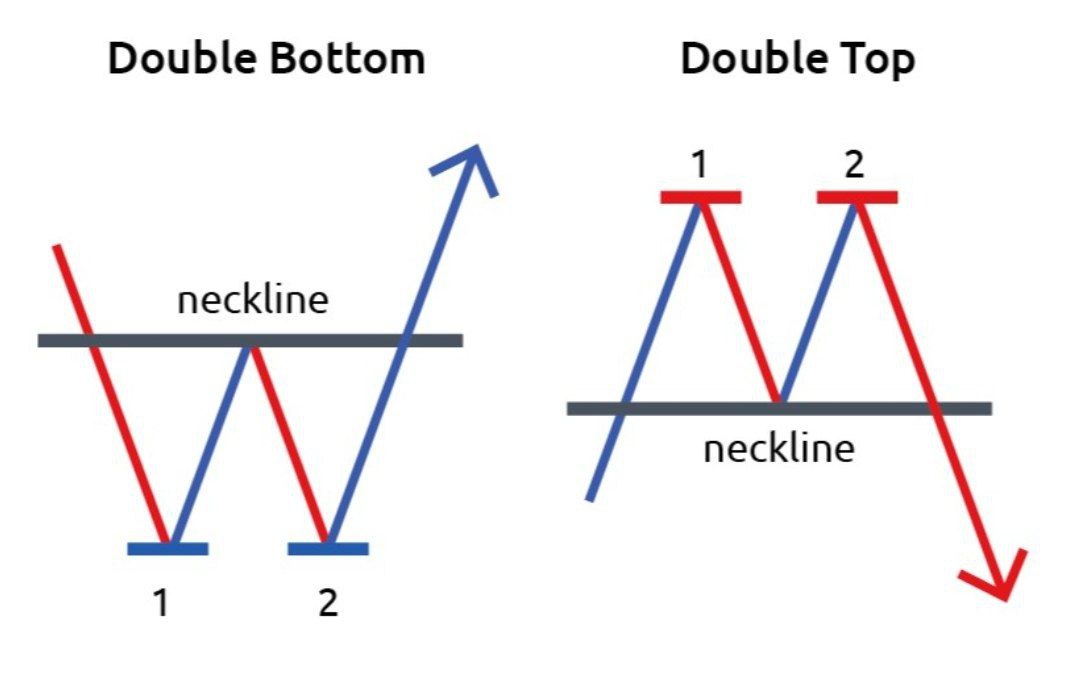
5. DOUBLE TOP / BOTTOM
• One of the most common reversal price patterns
• Generally, the wider the gap between touches the more powerful the pattern becomes
• Risk to reward ratio is good
• SL is defined [ bottom or top ]
• One of the most common reversal price patterns
• Generally, the wider the gap between touches the more powerful the pattern becomes
• Risk to reward ratio is good
• SL is defined [ bottom or top ]
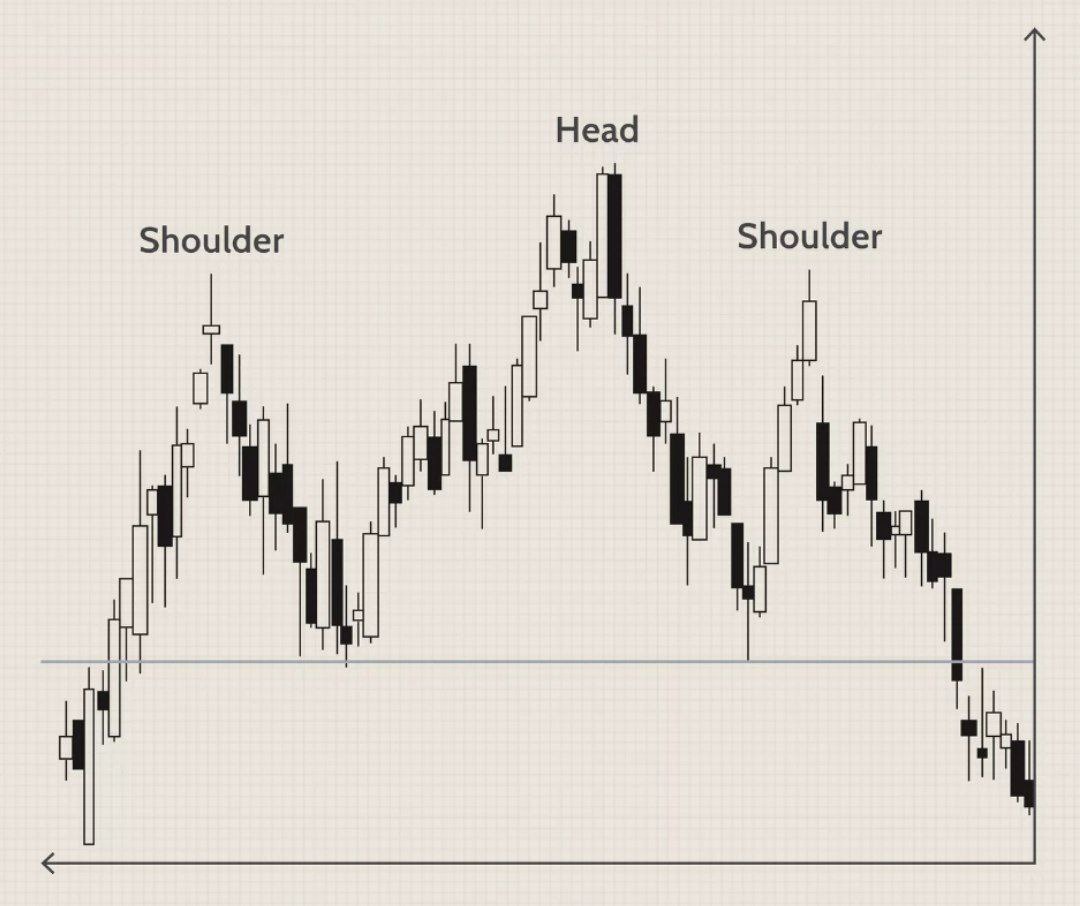
6. HEAD AND SHOULDERS PATTERN
• Very statistically accurate pattern
• The regular head and shoulders pattern is defined by two swing highs (the shoulders) with a higher high (the head) between them
• Very statistically accurate pattern
• The regular head and shoulders pattern is defined by two swing highs (the shoulders) with a higher high (the head) between them
The two outer swing highs don't have to be at the same price, but the closer they are the stronger the pattern generally becomes
The bearish counterpart of the head and shoulders pattern is the inverted head and shoulders
The bearish counterpart of the head and shoulders pattern is the inverted head and shoulders
7. BONUS
Any level which is considered important will prove itself to be important, like a self fulfilling prophecy
Any level which is considered important will prove itself to be important, like a self fulfilling prophecy
If you like this thread, do give a read to this thread I recently wrote on MENTAL TRAPS traders occasionally fall into.
I hope you've found this thread helpful. ❤️
Follow me @mohitsharmadl for more.
Like/Retweet the first tweet below if you can:
Follow me @mohitsharmadl for more.
Like/Retweet the first tweet below if you can:
Loading suggestions...