

Market Breadth: 🧵🧵🧵
A thread on the various secondary indicators of market health I use.
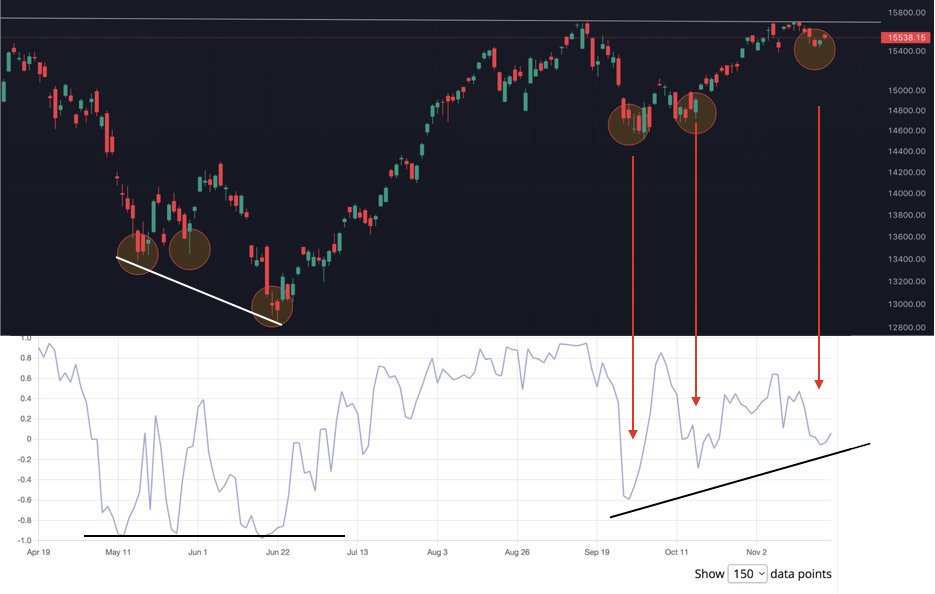
1. High Low Index:
(No. of stocks at 52 week high - No. of stocks at 52-week low)/ (No. of stocks 52 week high + No. of stocks 52 week low)
see June bottom divergence with price.
1/n
A thread on the various secondary indicators of market health I use.
1. High Low Index:
(No. of stocks at 52 week high - No. of stocks at 52-week low)/ (No. of stocks 52 week high + No. of stocks 52 week low)
see June bottom divergence with price.
1/n
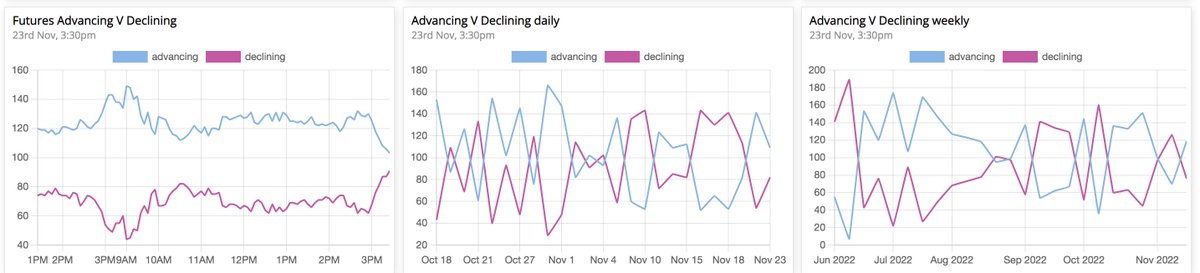
2. Advance Decline line:
No. of stocks advancing vs No. of stocks declining.
You can simply look at the 2 curves separately or plot the AD line which is (No. of advances - no of decline) + previous days value.
I find looking at the curves separately easier.
2/n
No. of stocks advancing vs No. of stocks declining.
You can simply look at the 2 curves separately or plot the AD line which is (No. of advances - no of decline) + previous days value.
I find looking at the curves separately easier.
2/n
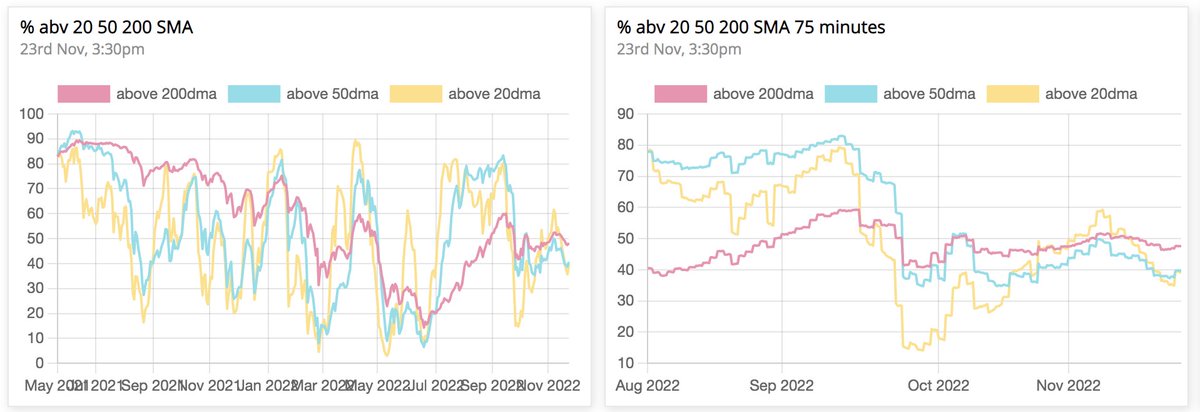
3. % stocks above key MAs (200, 50, 20 MA):
A very simple indicator that gauges LT, MT and ST breadth.
All in HH-HL formation.
i will only be worried if the 200DMA curve is broken to the downside.
3/n
A very simple indicator that gauges LT, MT and ST breadth.
All in HH-HL formation.
i will only be worried if the 200DMA curve is broken to the downside.
3/n
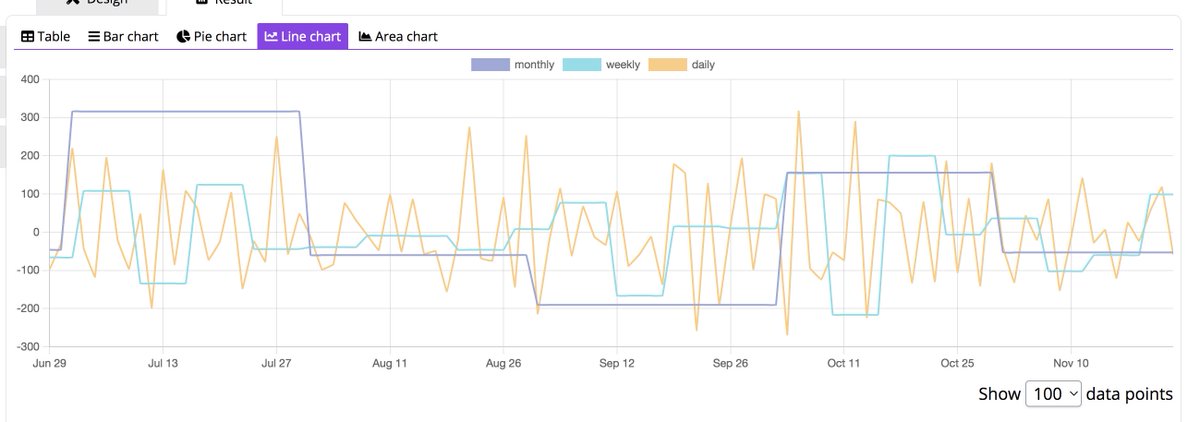
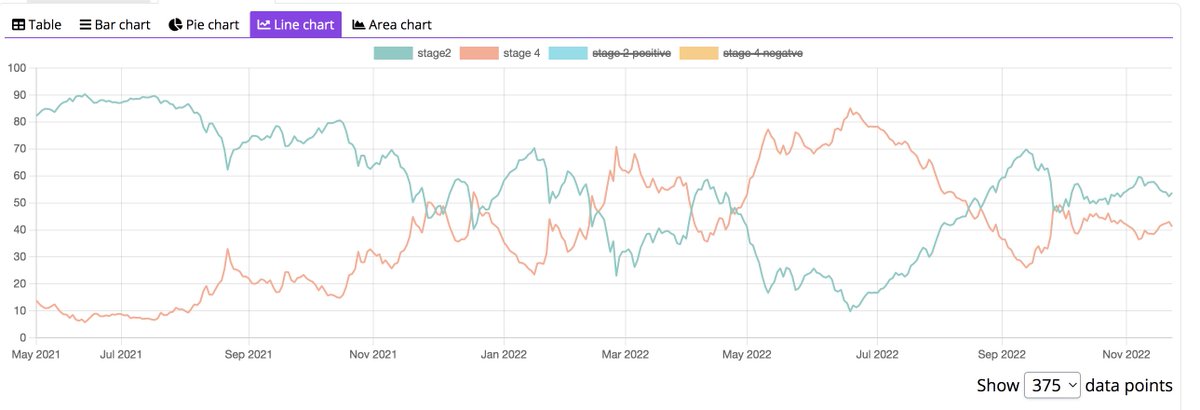
4. Stag 2/4 indicator:
No. of stocks that are in stage 2 and stage 4.
This is built by me and I think it has the potential to serve as an excellent breadth indicator.
4/n
No. of stocks that are in stage 2 and stage 4.
This is built by me and I think it has the potential to serve as an excellent breadth indicator.
4/n
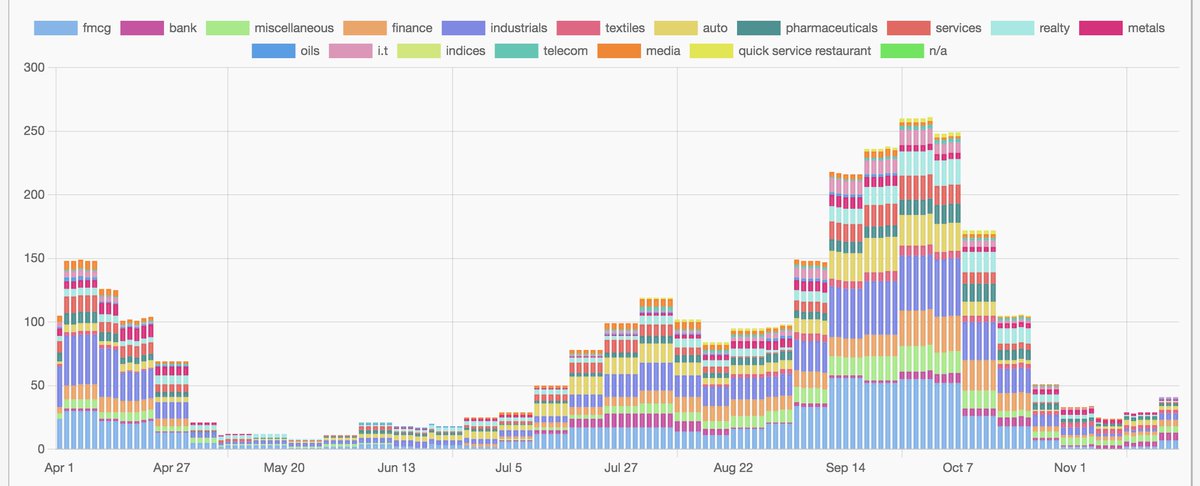
5. Stage 2 breakout indicator:
Again custom built. Slightly different from the one above, it gives the no. of stocks that are moving to stage2 from stage1.
It has the potential to serve as a leading indicator of upward momentum.
This indicator turned bullish on monday.
see
5/n
Again custom built. Slightly different from the one above, it gives the no. of stocks that are moving to stage2 from stage1.
It has the potential to serve as a leading indicator of upward momentum.
This indicator turned bullish on monday.
see
5/n
6. Weekly 52-week close indicator:
No. of stocks making a 52-week high weekly close.
divergences of top and bottom with cnx500 can be vital.
Anticipating an HL and Breakout to the upside.
6/n
No. of stocks making a 52-week high weekly close.
divergences of top and bottom with cnx500 can be vital.
Anticipating an HL and Breakout to the upside.
6/n

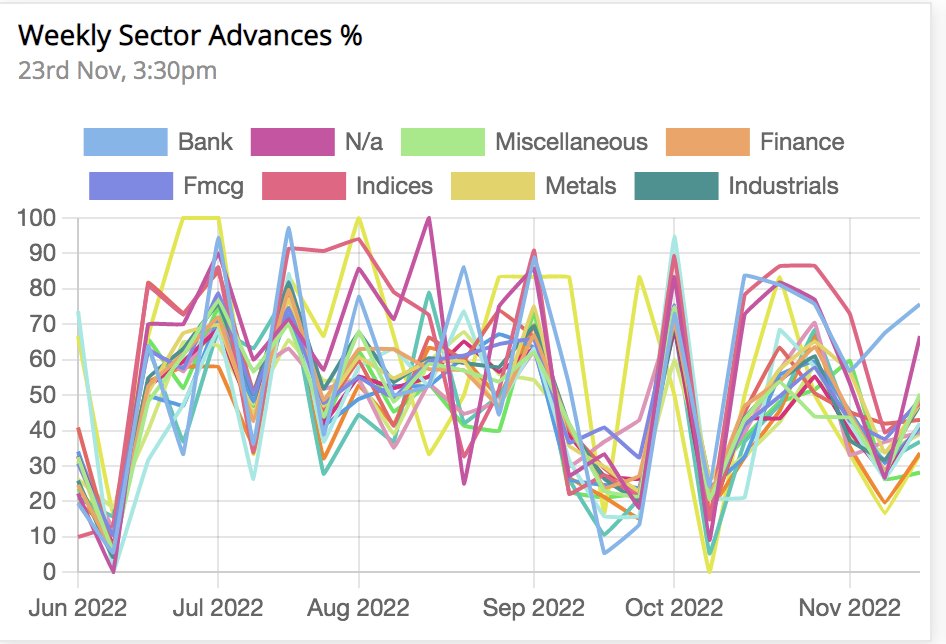
7. Weekly sectoral advances:
Gives you information on sector rotation, topping and bottoming.
7/n
Gives you information on sector rotation, topping and bottoming.
7/n
That is all.
Remember these are not to be used in isolation and only in conjunction with Price.
Price will always remain the Supreme indicator of all.
8/8
Like the 1st tweet if this was helpful and follow @sakatashomma for more such threads.
cheers
Remember these are not to be used in isolation and only in conjunction with Price.
Price will always remain the Supreme indicator of all.
8/8
Like the 1st tweet if this was helpful and follow @sakatashomma for more such threads.
cheers
@AnsuAgarwal3
This was an early indication which could probably signalled broader market participation was starting to come in.
This was an early indication which could probably signalled broader market participation was starting to come in.
Loading suggestions...