
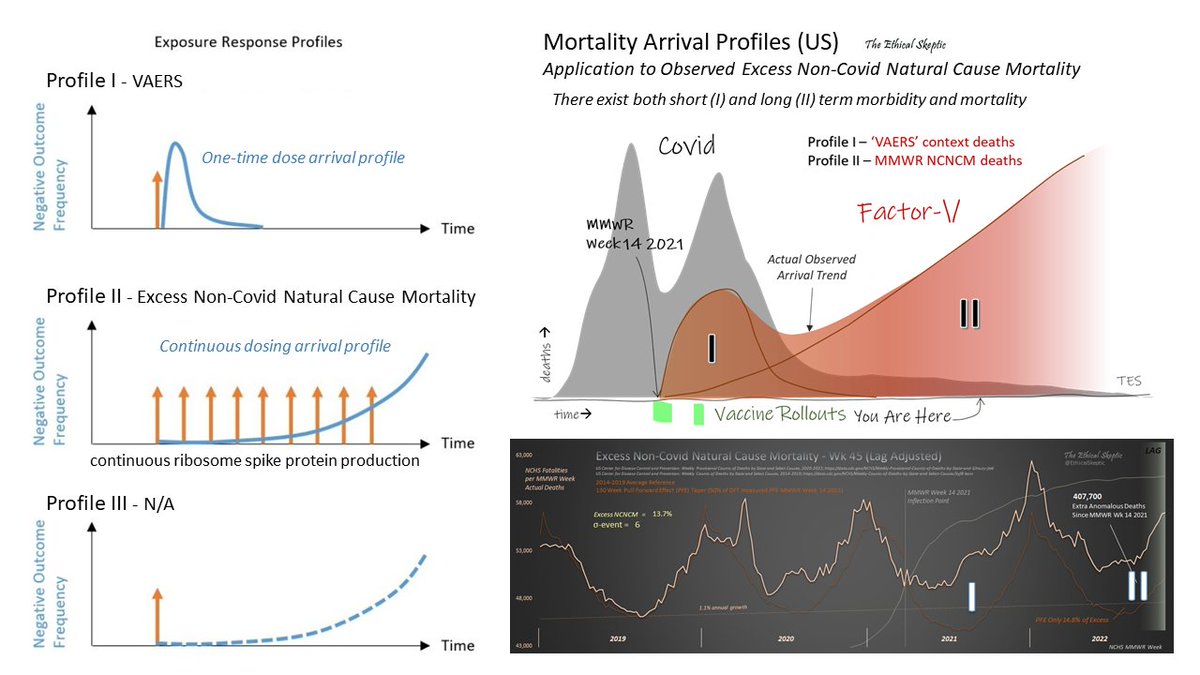
Rev 1.3 phasing profile chart explaining what we are seeing in the Excess Non-Covid Natural Cause Mortality arrival function.
Today served to confirm solidly that Profile II is well underway.
The list of candidates causing Profile II, is down to one.
You're not gonna like it.
Today served to confirm solidly that Profile II is well underway.
The list of candidates causing Profile II, is down to one.
You're not gonna like it.
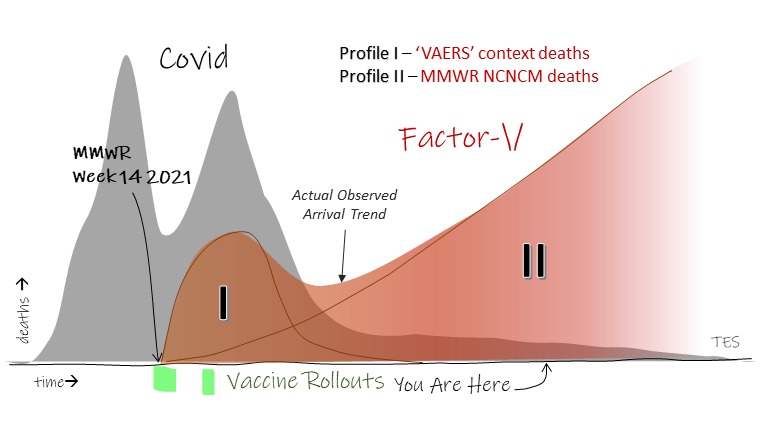
Then the revised cartoon-chart which is part of the overall concept chart. Hopefully colors stand out and message communicates more effectively.
Loading suggestions...