

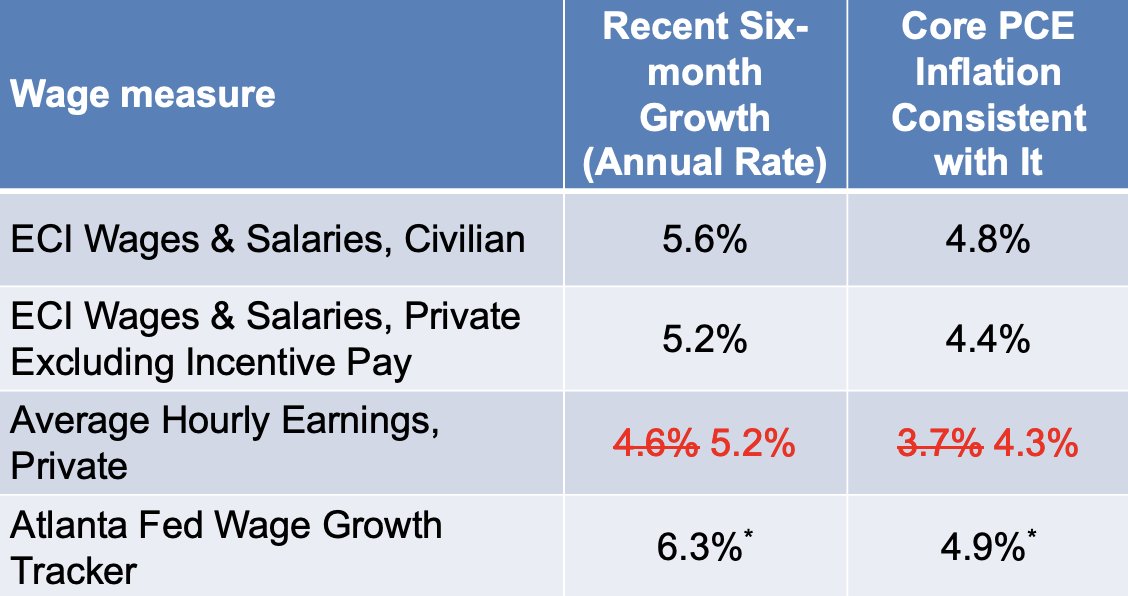
Revised a table for a talk I'm giving on Monday. Note all of these (except Atlanta Fed) are averaged over six months.
I want to address a few points in a short thread: (1) was Nov wages an anomaly, (2) are wages causing inflation, and (3) is this bad.
The 🧵.
I want to address a few points in a short thread: (1) was Nov wages an anomaly, (2) are wages causing inflation, and (3) is this bad.
The 🧵.
1. How much to revised based on one data point?
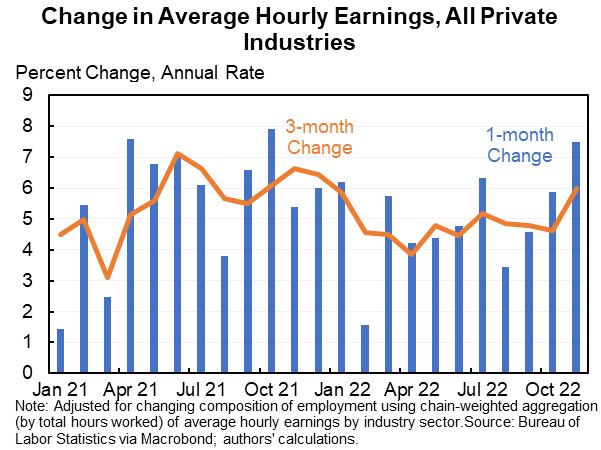
In November average hourly earnings grew at a 7.8% annual rate. Fastest pace since January. And almost certainly spuriously high due to hours down other factors.
Which is why I focus on the 3-month (6.0%) or 6-month change (5.2%).
In November average hourly earnings grew at a 7.8% annual rate. Fastest pace since January. And almost certainly spuriously high due to hours down other factors.
Which is why I focus on the 3-month (6.0%) or 6-month change (5.2%).
But, usually when a number is unusually high it is part measurement noise and part signal. Don't want to totally explain it away as an anomaly.
And importantly wage growth for previous months was revised up.
Sep / Oct (annual rate)
Original: 3.8% / 4.5%
Revised: 4.9% / 5.7%
And importantly wage growth for previous months was revised up.
Sep / Oct (annual rate)
Original: 3.8% / 4.5%
Revised: 4.9% / 5.7%
2. Why does this matter if wage growth not causing price growth?
I don't agree with the premise and am reasonably convinced that wage growth has played a role in price growth.
Regardless, that doesn't matter. The question is going forward...
I don't agree with the premise and am reasonably convinced that wage growth has played a role in price growth.
Regardless, that doesn't matter. The question is going forward...
...Going forward IF nominal wages grow at a 6% annual rate over the next three years it is very, very, very likely that core inflation will be above 4%. Best guess is 5%.
Yes, could have margin compression or productivity boom. But could also have the opposite.
Yes, could have margin compression or productivity boom. But could also have the opposite.
3. Is this bad?
Unfortunately I believe the answer is yes. For any given desired inflation rate (mine is 3% if we can manage the transition, a big if), this means a higher expected unemployment rate next year and fewer jobs next year.
Unfortunately I believe the answer is yes. For any given desired inflation rate (mine is 3% if we can manage the transition, a big if), this means a higher expected unemployment rate next year and fewer jobs next year.
The favorable stories about the Fed being able to ease off and inflation coming down including from people like @paulkrugman, @JustinBloesch, @IrvingSwisher, @mtkonczal have all involved some slowdown in wage growth (for the reasons explained in the last tweet). Less likely now.
The indicators are all now telling a similar story. A variety of wage measures are all saying underlying inflation is around 4.5%. A variety of price measures is saying ~5%. Some reason to believe this will fall but less than I thought before.
We'll get more and better data (like the Employment Cost Index on January 31). But this is where we are now.
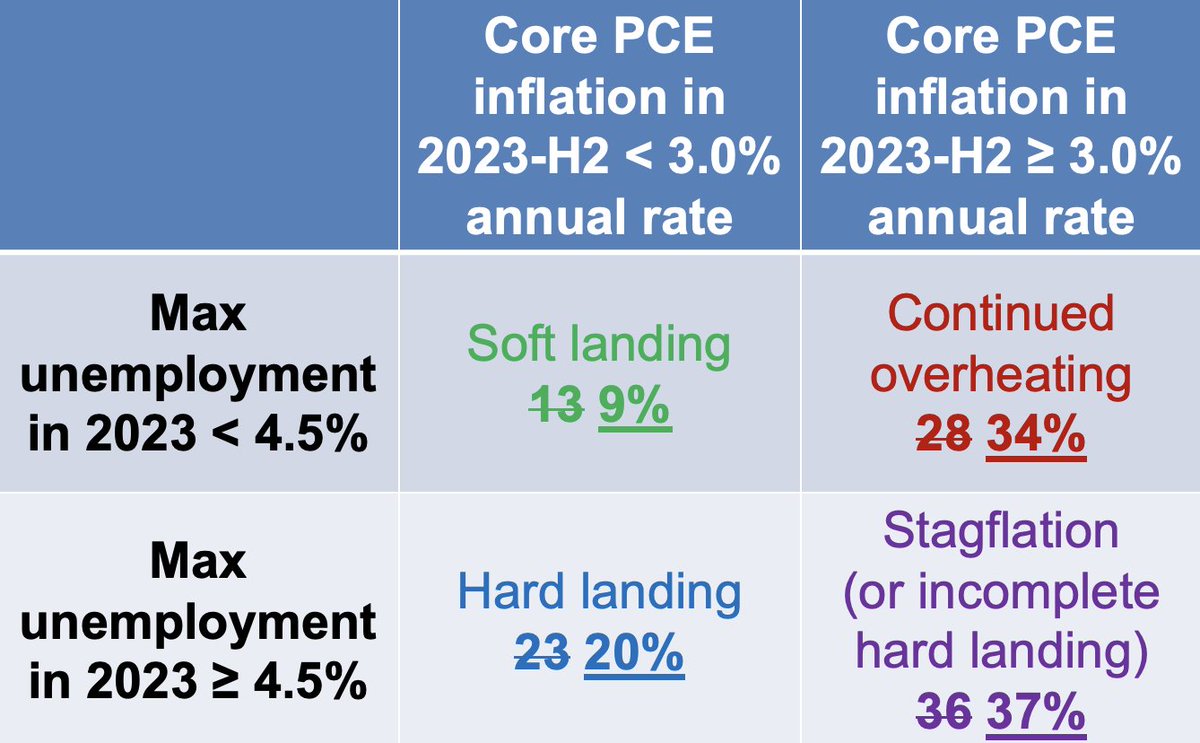
And based on the last week's data and additional reflection my Monday presentation includes this other updated slide.
And based on the last week's data and additional reflection my Monday presentation includes this other updated slide.
Loading suggestions...