

Island Reversal Pattern Guide
A thread 🧵
A thread 🧵

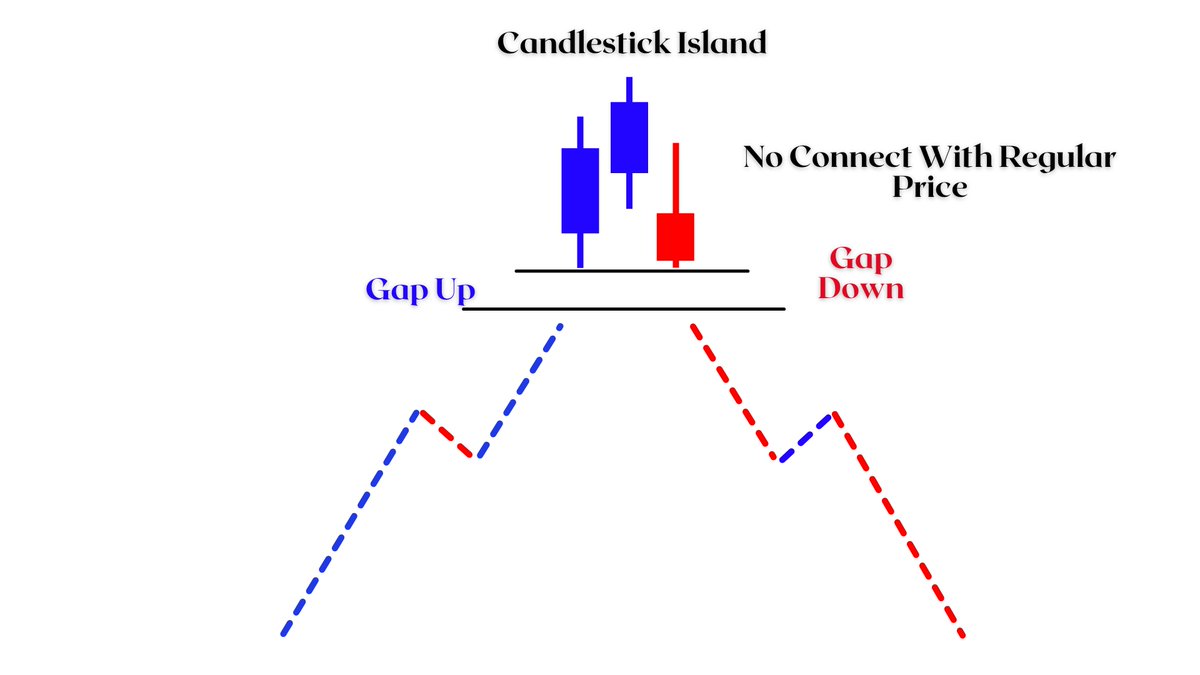
Island Gap
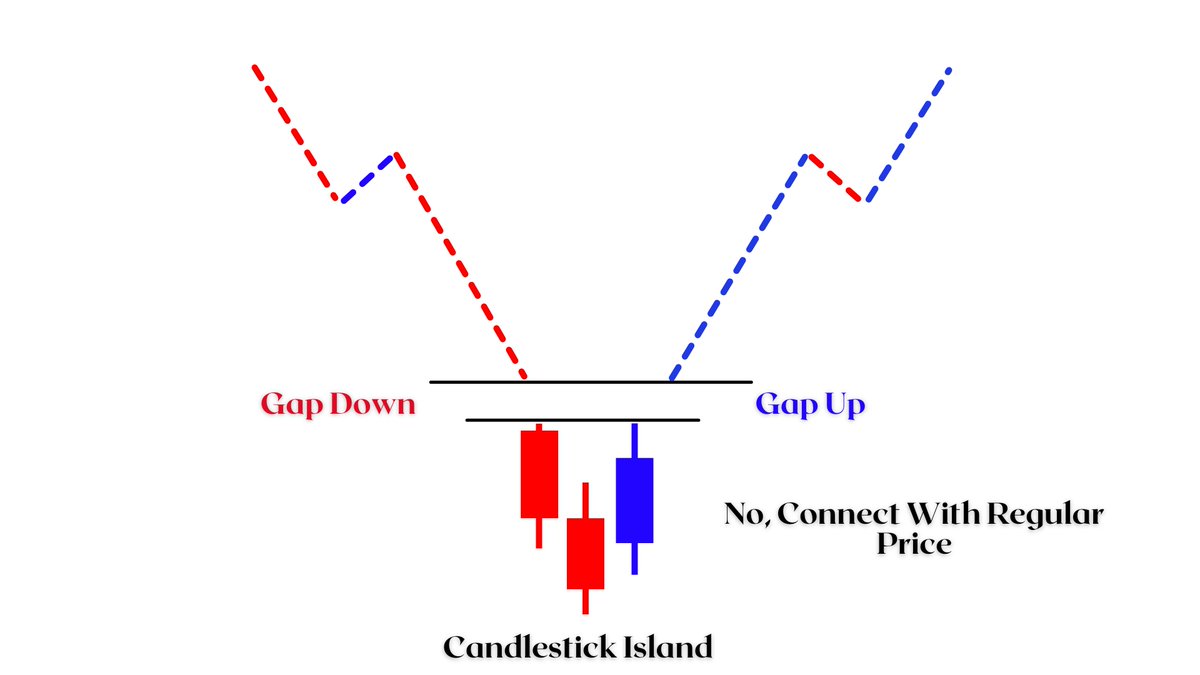
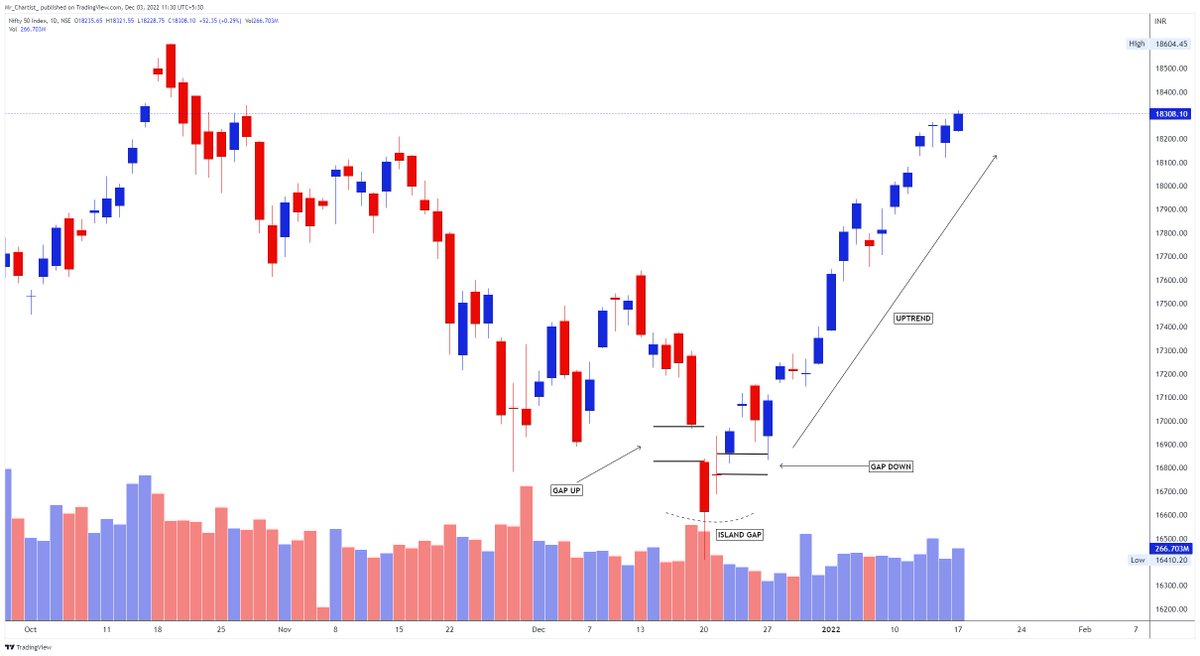
An island reversal is a short-term reversal pattern that forms two overlapping gaps. A bullish island reversal forms with a gap down short consolidation in prices and a gap up. A bearish island reversal forms with a gap up short consolidation in prices and a gap down.
An island reversal is a short-term reversal pattern that forms two overlapping gaps. A bullish island reversal forms with a gap down short consolidation in prices and a gap up. A bearish island reversal forms with a gap up short consolidation in prices and a gap down.
Technically, both gaps should overlap to create an empty space above or below the island. Traders with positions between the two gaps are stuck with losing positions.
Common Ways to Improve the Island Reversal
1. Volume- By watching whether the volume of the market is increasing or decreasing throughout the island, we may gain some clues about whether the pattern is worth taking or not.
1. Volume- By watching whether the volume of the market is increasing or decreasing throughout the island, we may gain some clues about whether the pattern is worth taking or not.
Many traders will regard increasing volume as a sign that the market is preparing for the coming trend reversal. Thus, they take an island reversal forming under increasing volume more seriously than one where volume is falling.
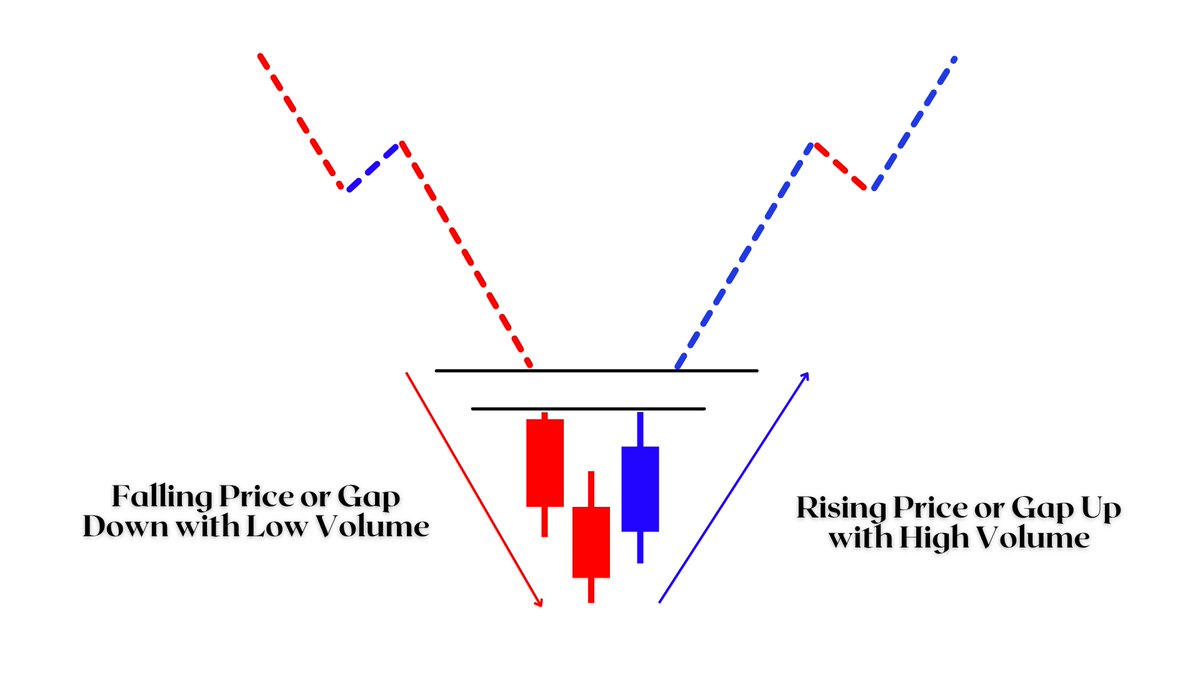
Volume in Bullish Island Gap
Volume in Bullish Island Gap
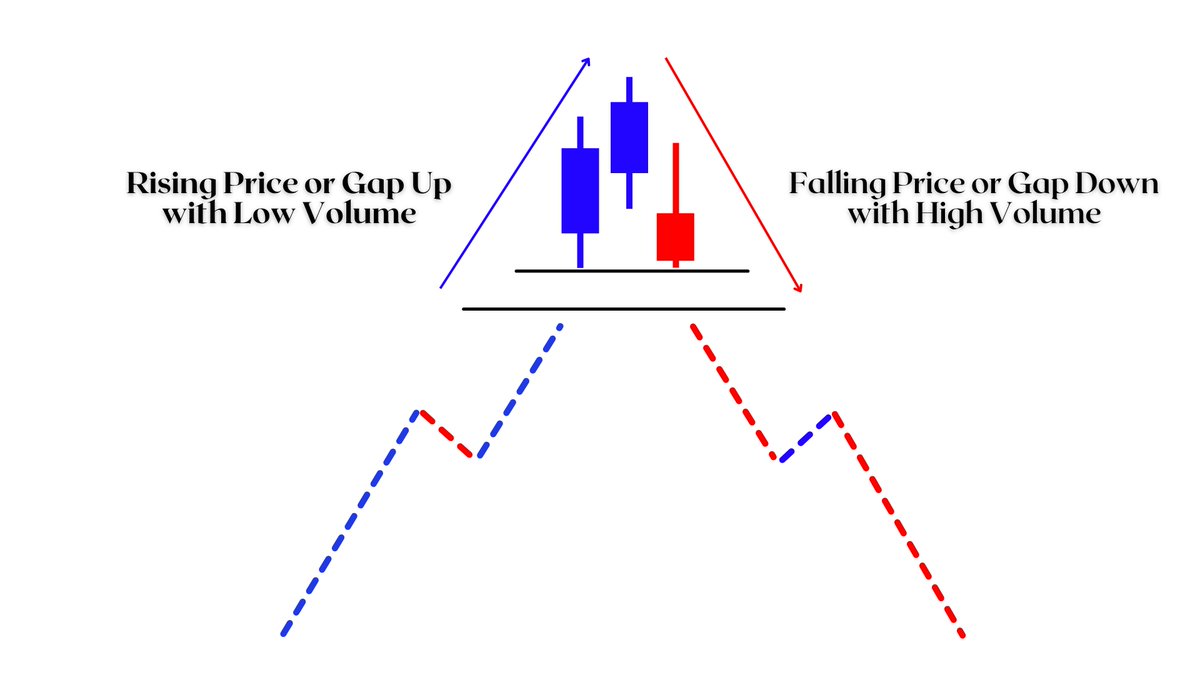
Volume in Bearish Island Gap
2. The Size of the Gaps

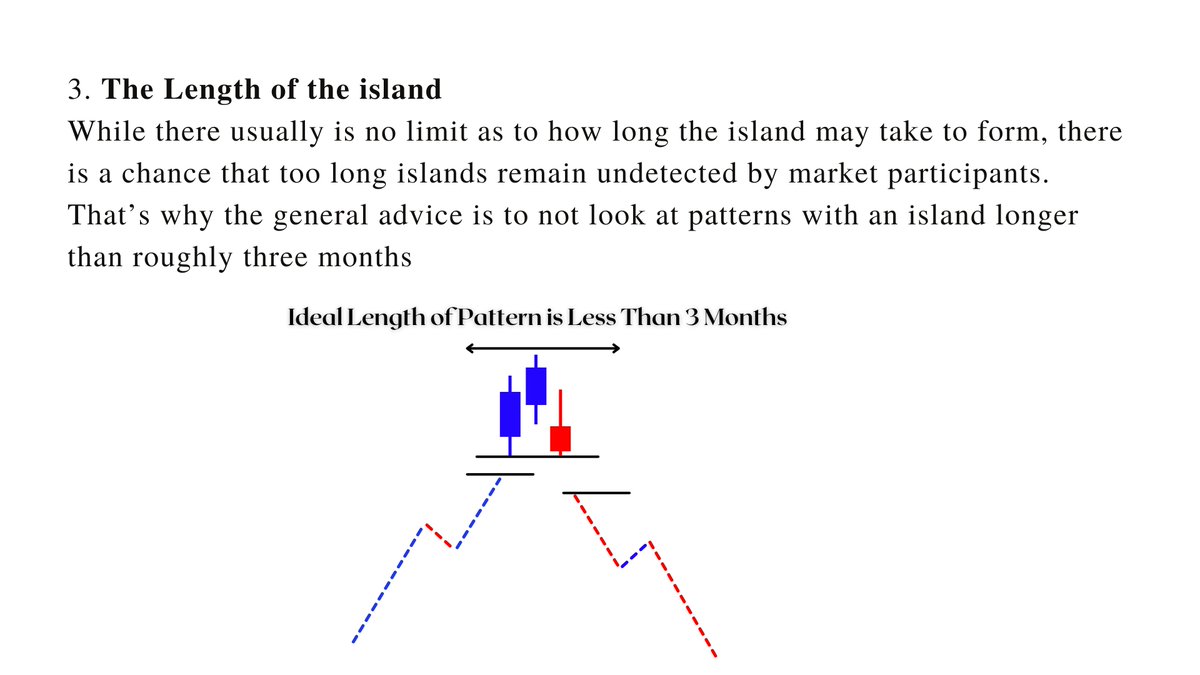
3. The Length of the Island
Bullish Island Gap:-
Setup- Bullish island is a Candlestick pattern and the major Candlestick pattern is a reversal this also comes under the reversal and this formed under the downtrend and after that stock formed an abandoned candlestick and this indicates the reversal on
Setup- Bullish island is a Candlestick pattern and the major Candlestick pattern is a reversal this also comes under the reversal and this formed under the downtrend and after that stock formed an abandoned candlestick and this indicates the reversal on
the chart. When the stock bounced and opened with Gap Up we can see a major reversal in the chart pattern.
Stop Loss- Can be placed below the recent opening or swing low of the candlestick pattern. This area generally acts as a support level, though the price will sometimes dip below the candlestick, and that abandoned area works as a strong support level.
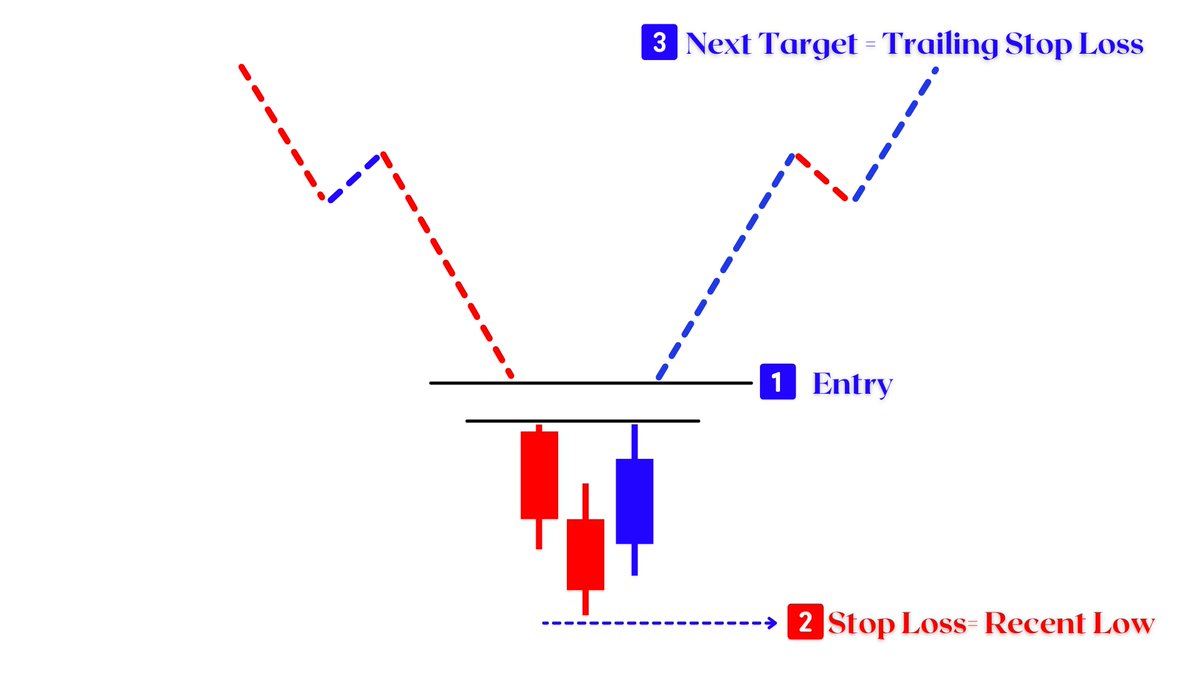
Targets- this is a major reversal pattern formed in stock and we can see some strong reversals like V-shape recovery this type of pattern provides high risk and return level. We need to trail stop loss with the trend or better find the next resistance line.
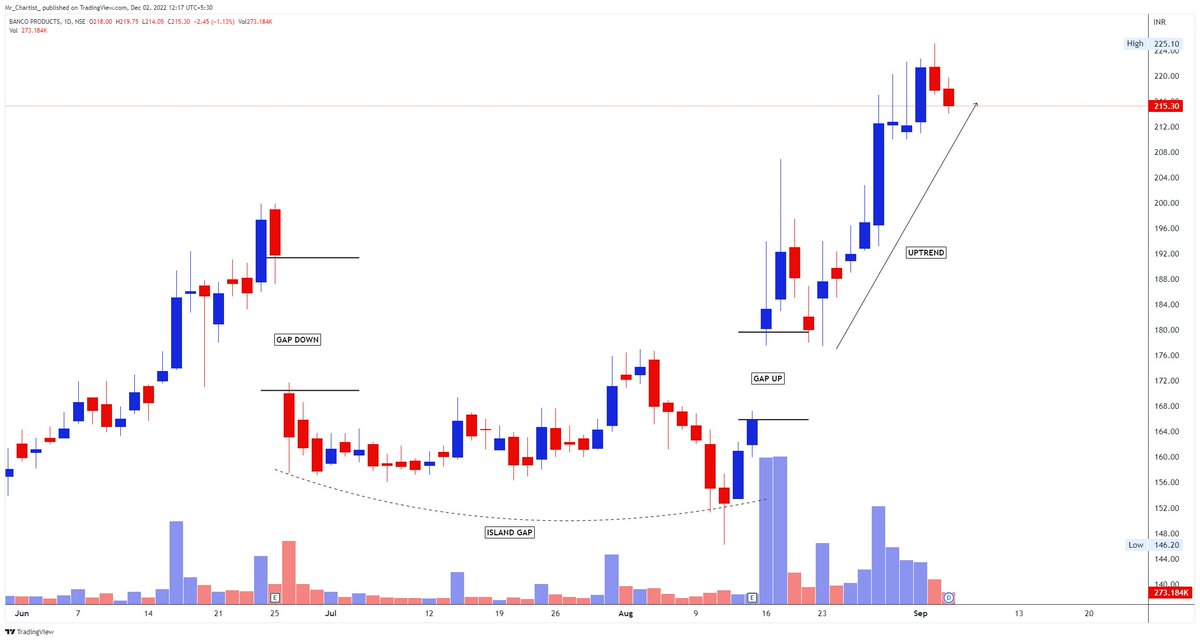
Example 1- Banco India
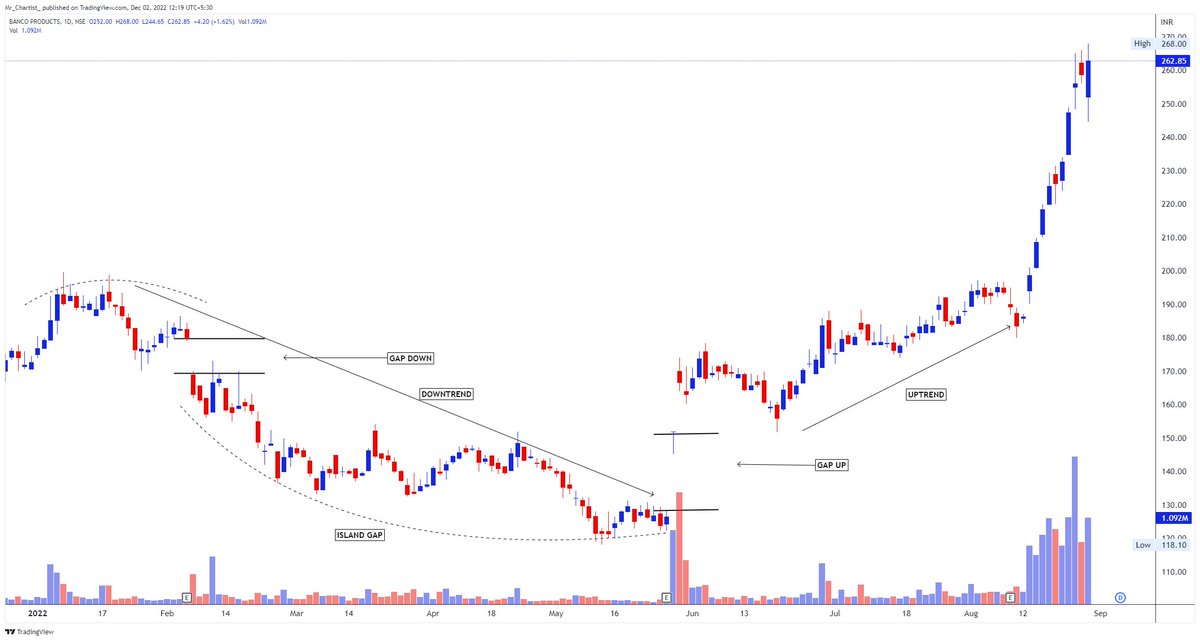
Example 2- Banco India
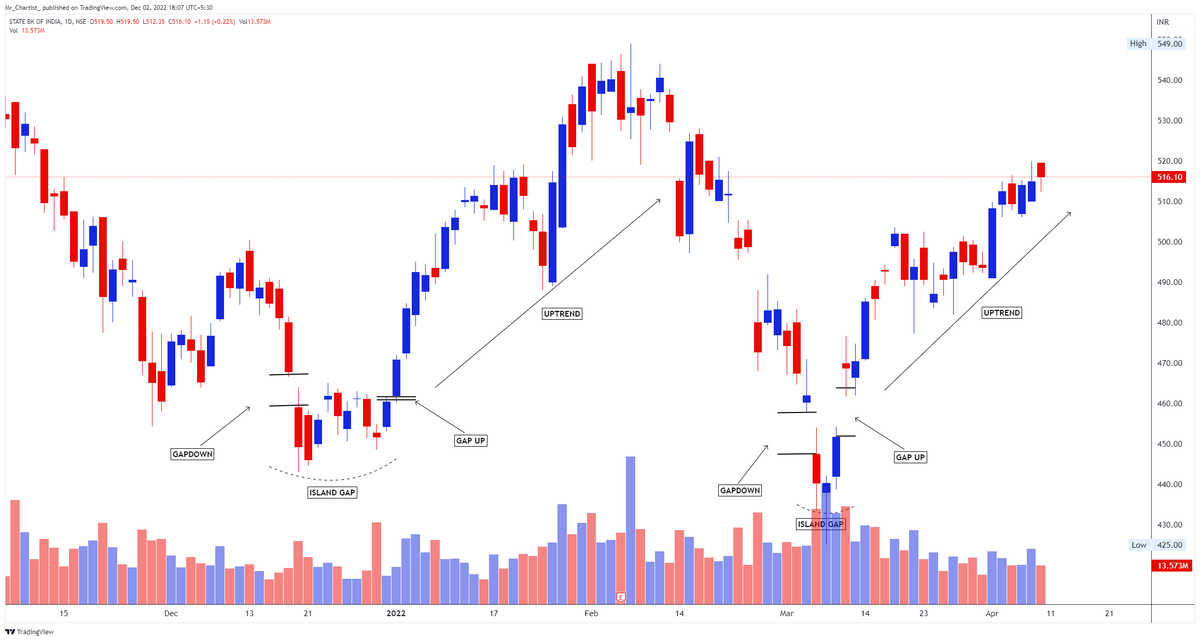
Example 3- SBIN
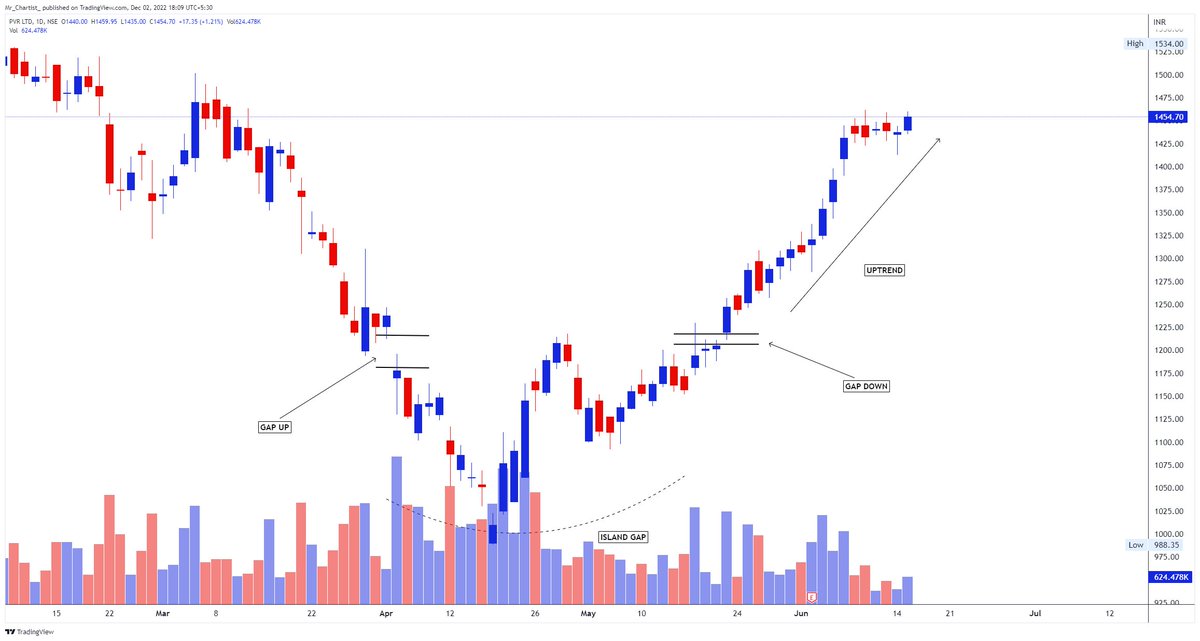
Example 4- PVR
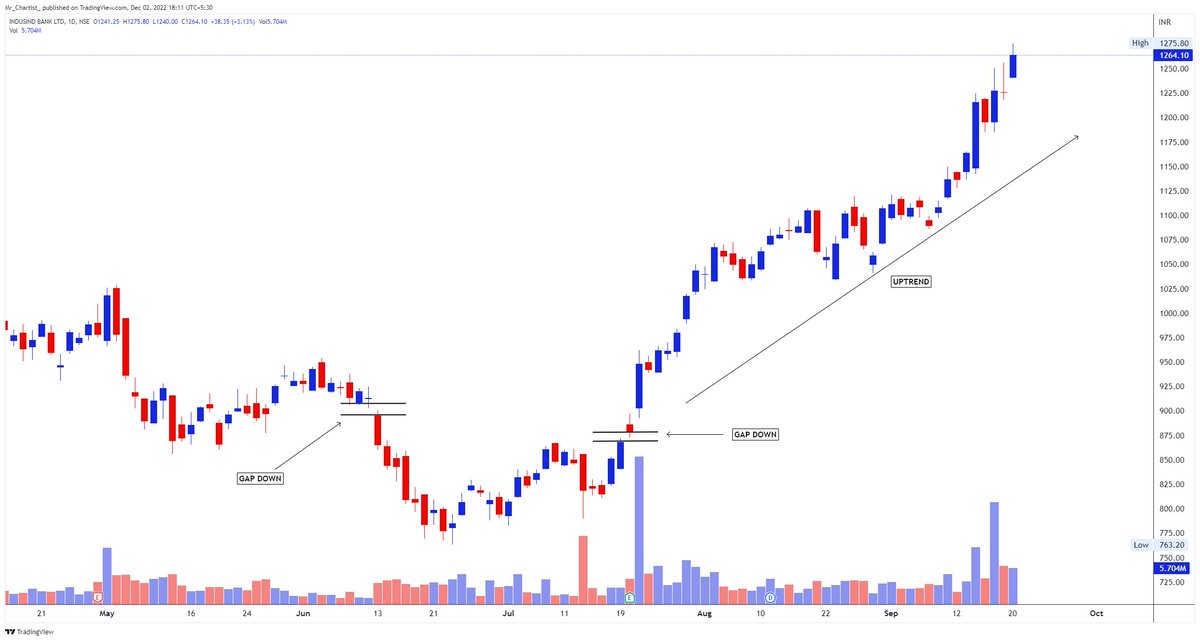
Example 5- Indusindbk
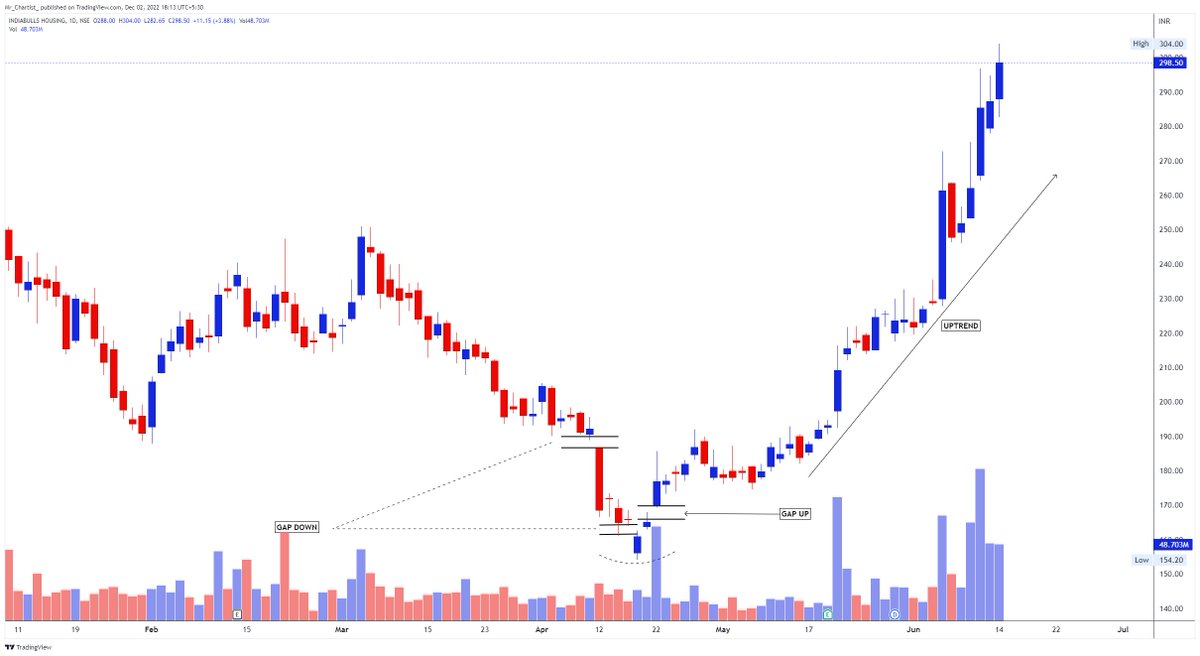
Example 6- Ibulhsgfin
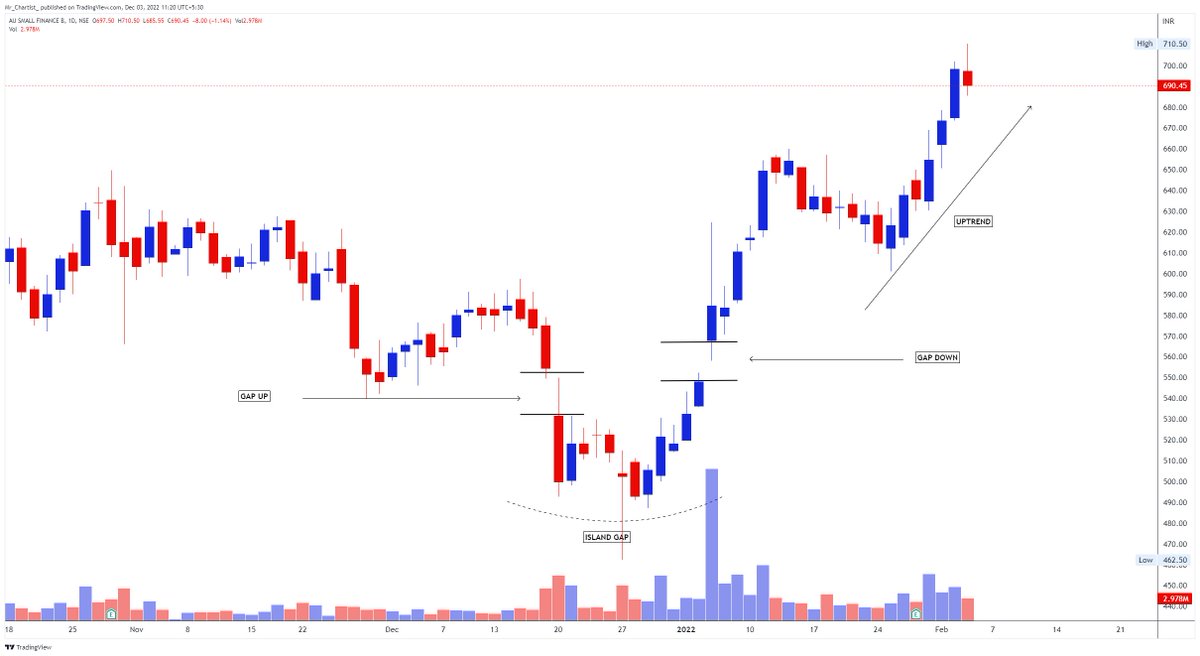
Example 7- Aubank
Example 8- Nifty
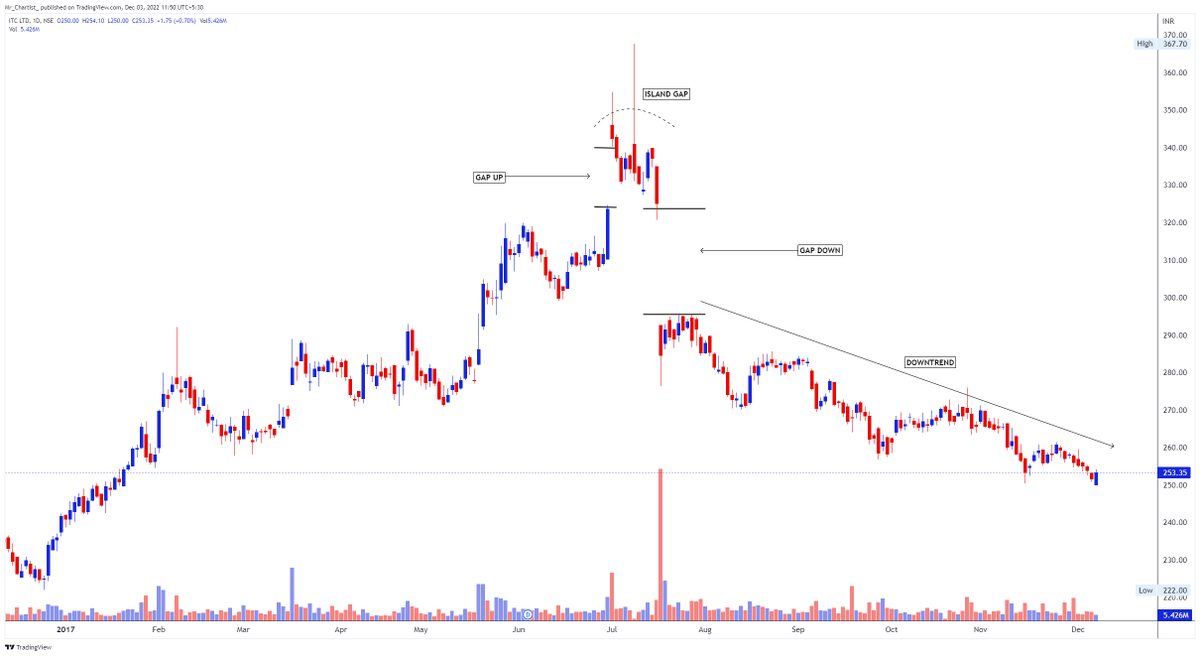
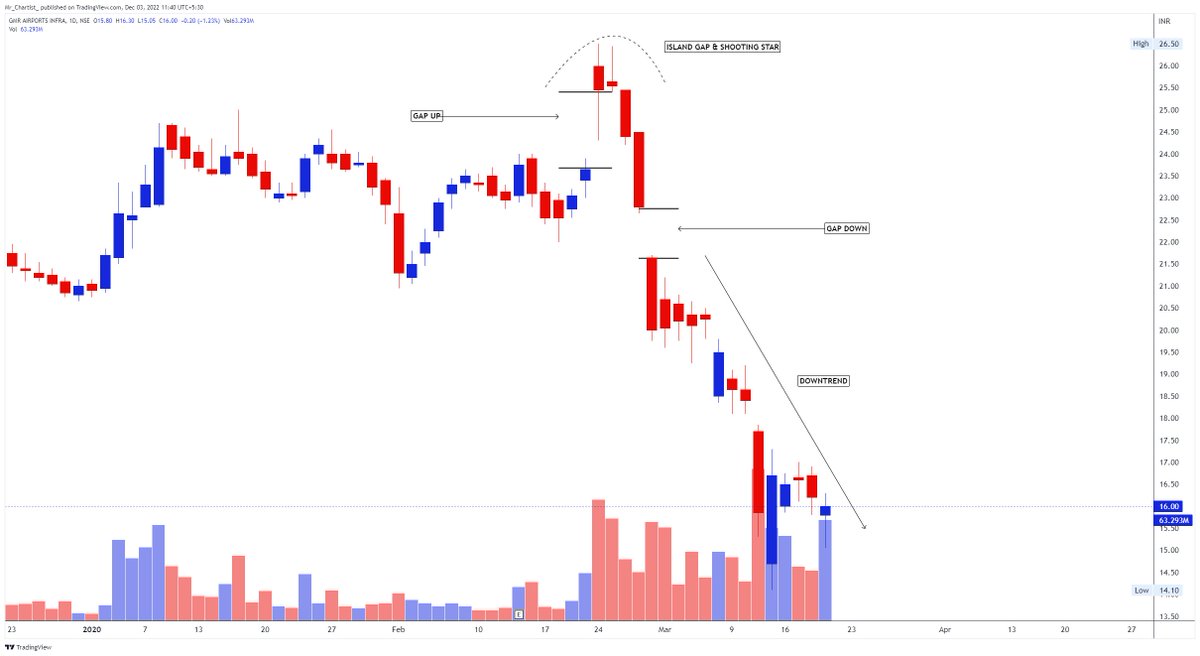
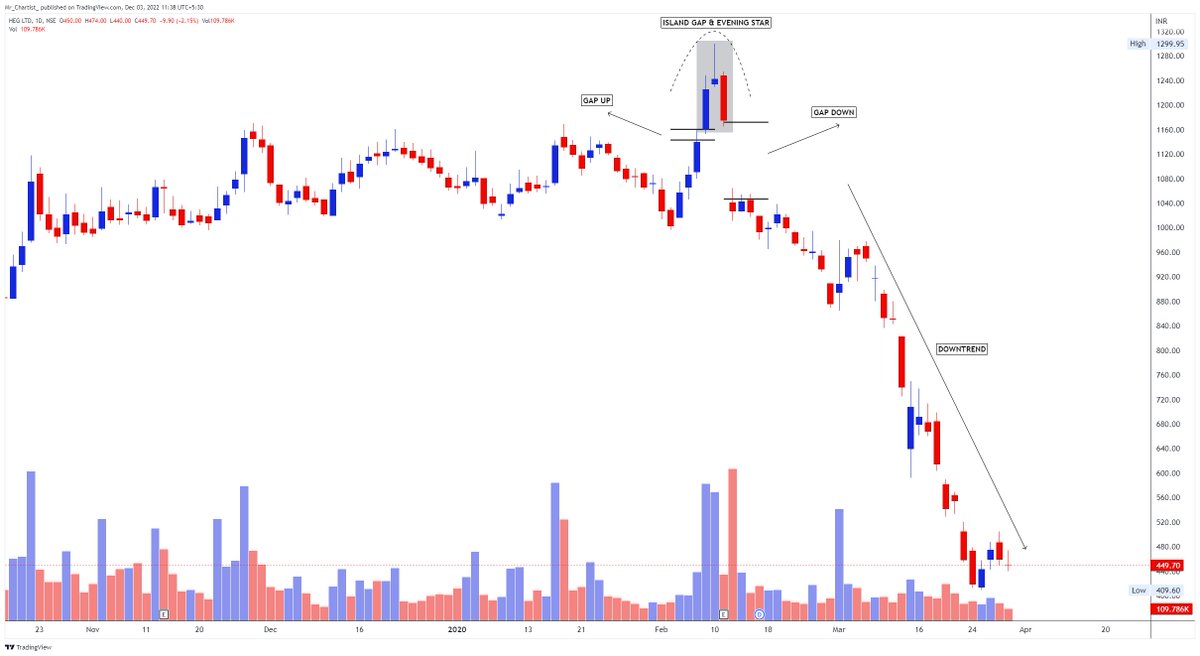
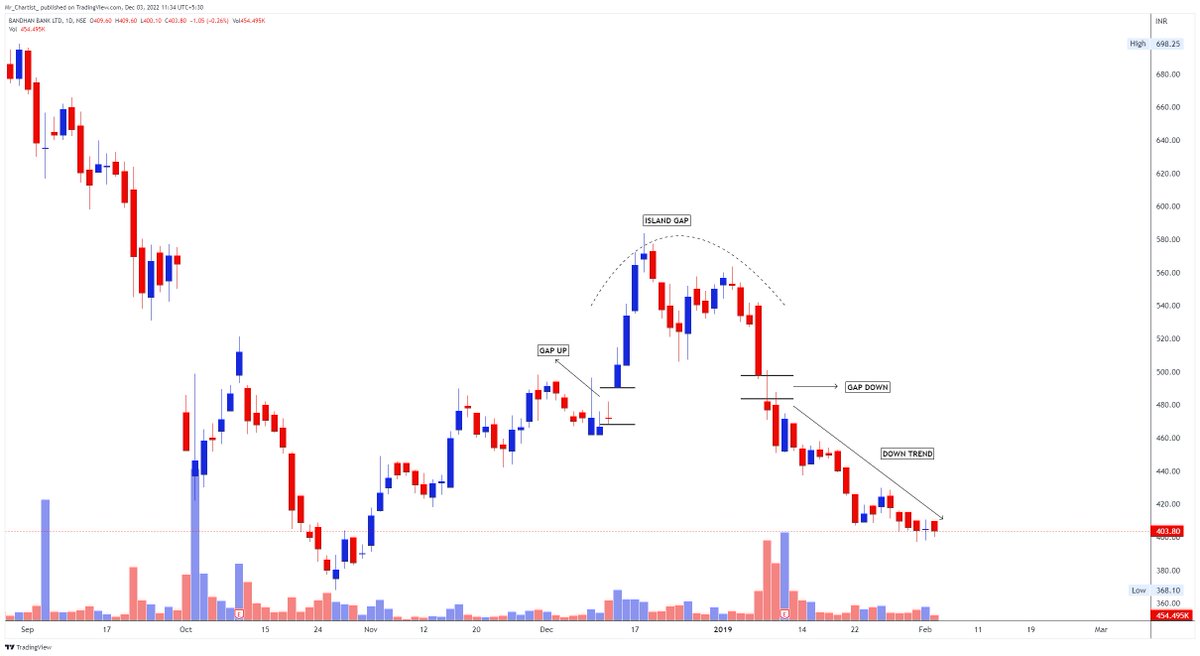
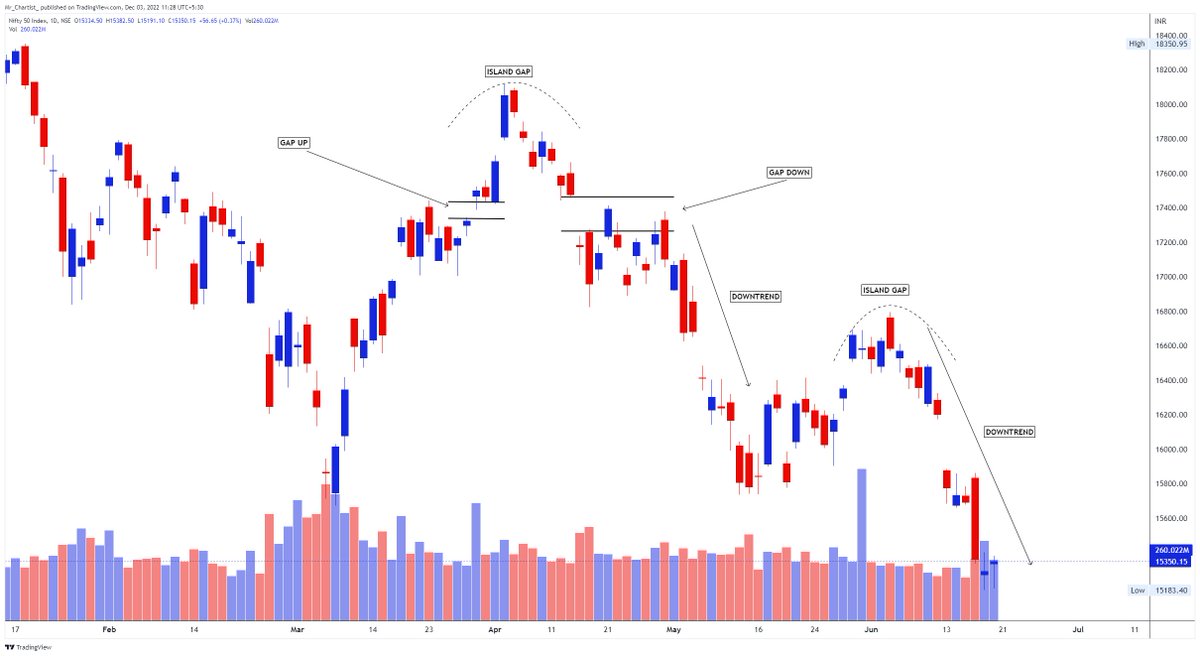
Bearish Island Gap:-
Setup- Bearish island is a Candlestick pattern and major Candlestick patterns are reversals this also comes under the reversal and this formed under the uptrend and after that stock formed an abandoned candlestick and this indicates the reversal on the chart
Setup- Bearish island is a Candlestick pattern and major Candlestick patterns are reversals this also comes under the reversal and this formed under the uptrend and after that stock formed an abandoned candlestick and this indicates the reversal on the chart
When the stock has fallen and opened with Gap down we can see a major reversal on the chart pattern.
Stop Loss- Can be placed below the recent opening or swing high of the candlestick pattern. This area generally acts as a resistance level, though the price will sometimes dip below the candlestick, and that abandoned area works as a strong resistance level.
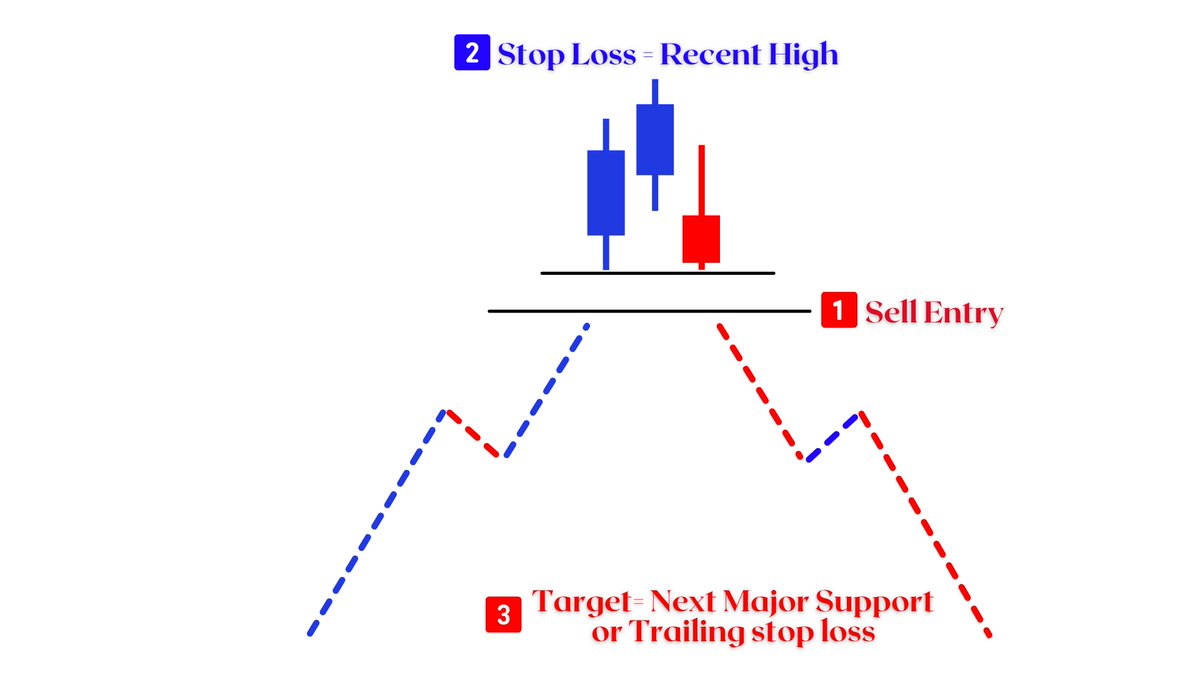
Targets- this is a major reversal pattern formed in stock and we can see some strong reversals like V-shape sliding. This type of pattern provides high risk and return levels. We need to trail stop loss with the trend or better to find the next support.
Example 1- ITC
Example 2- Gmr Infra
Example 3- Heg
Example 4- Bandhan Bank
Example 5- Nifty
Loading suggestions...