

Many investors today overlook the Balance Sheet, which can be a huge mistake
The Balance Sheet tells you the HEALTH of the company
Here is a QUICK walk thru on how to read a Balance Sheet:
The Balance Sheet tells you the HEALTH of the company
Here is a QUICK walk thru on how to read a Balance Sheet:

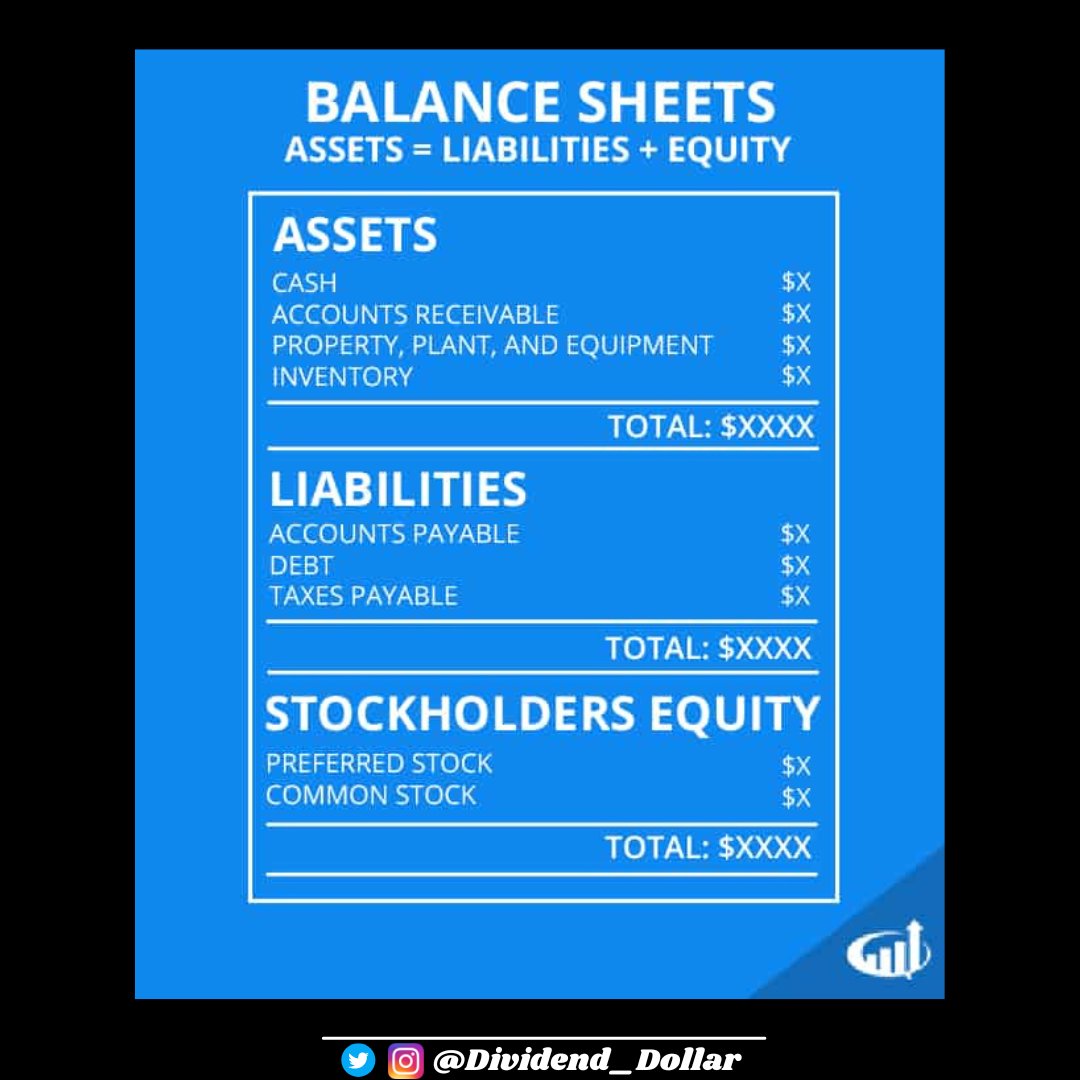
1/ A Balance Sheet is a snapshot of a company's financial health
All Balance Sheets MUST balance using the following formula:
Assets = Liabilities + Owner's Equity
All Balance Sheets MUST balance using the following formula:
Assets = Liabilities + Owner's Equity
2/ Unlike an Income Statement, which is reported over a period of time (3-months, 6-months, 9-months,etc), a Balance Sheet is continuously updating
Let's take a look at the MAIN components of a Balance Sheet
Let's take a look at the MAIN components of a Balance Sheet
3/ Assets
- Cash
- Accts Receivable: Money you are owed by customers
- Inventory: Product you have to sell
- Prepaids: Amounts you paid in advance
- Fixed Assets: Buildings, Equipment, Vehicles, etc.
- Intangible Assets: Trademarks, Goodwill, etc.
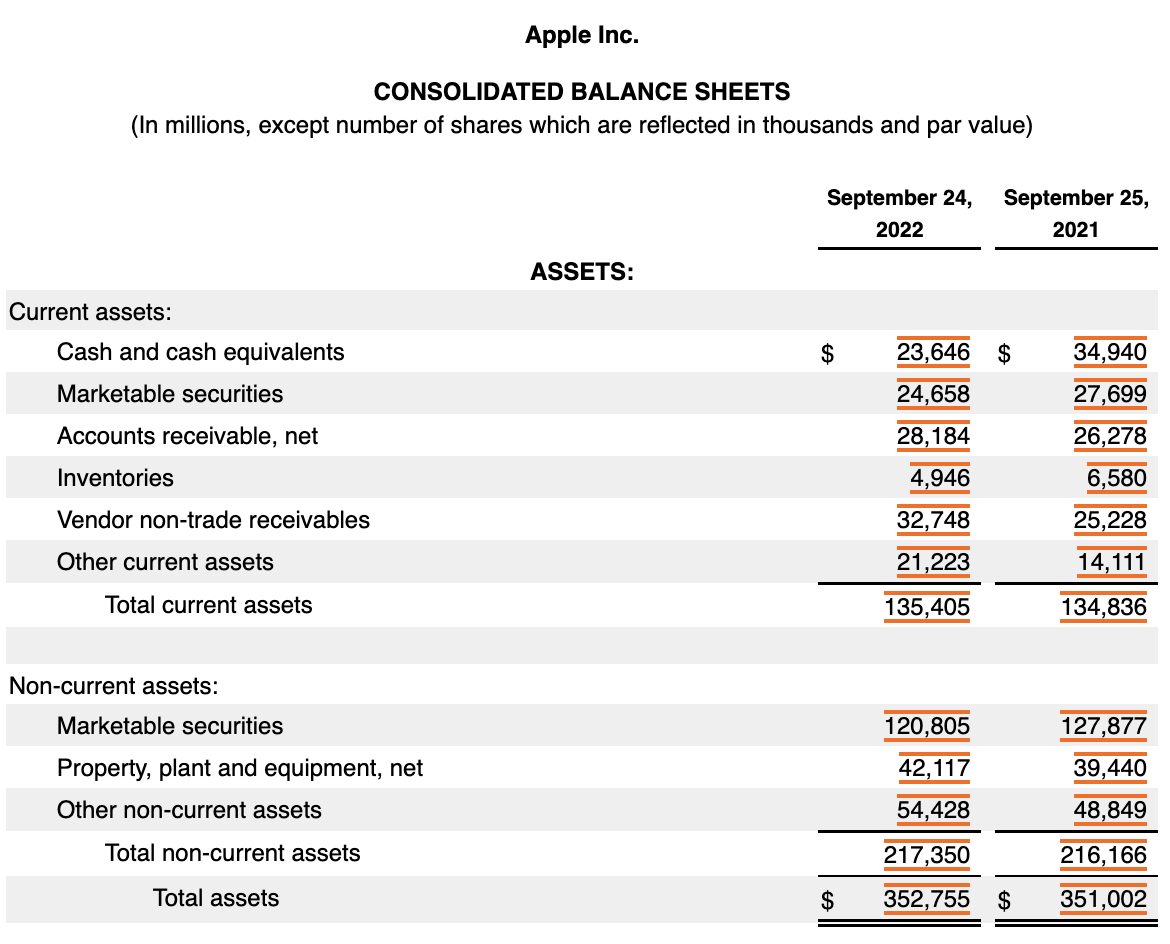
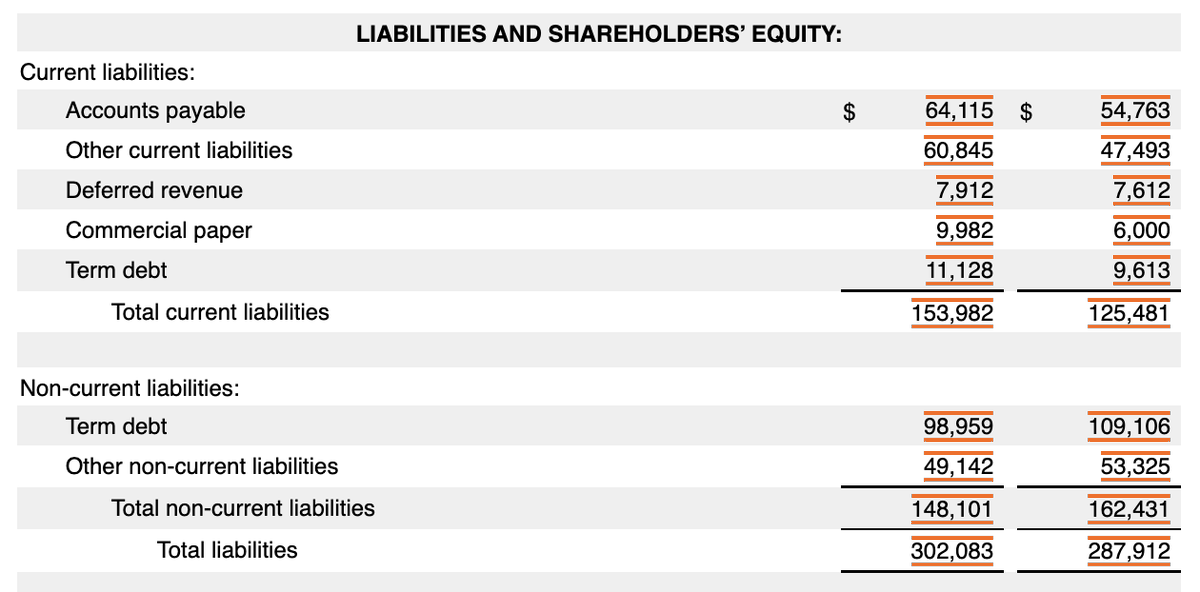
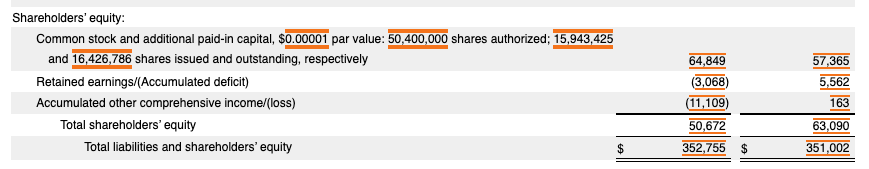
Here is the $AAPL B/S
- Cash
- Accts Receivable: Money you are owed by customers
- Inventory: Product you have to sell
- Prepaids: Amounts you paid in advance
- Fixed Assets: Buildings, Equipment, Vehicles, etc.
- Intangible Assets: Trademarks, Goodwill, etc.
Here is the $AAPL B/S
4/ Liabilities
These are costs you owe
- Accts Payable: Money you owe to vendors
- Deferred Revenue: Sales made but not earned (Customer pays, but product not yet delivered)
- Current Portion Debt: Debt that is owed within 12mo
- Long-Term Debt: Remaining Debt owed
These are costs you owe
- Accts Payable: Money you owe to vendors
- Deferred Revenue: Sales made but not earned (Customer pays, but product not yet delivered)
- Current Portion Debt: Debt that is owed within 12mo
- Long-Term Debt: Remaining Debt owed
5/ Equity
This is the value of the company according to the books
- Common Stock (initial capital outlay)
- Contributions
- Distributions
- Retained Earnings (Cumulative view of Net Earnings)
This is the value of the company according to the books
- Common Stock (initial capital outlay)
- Contributions
- Distributions
- Retained Earnings (Cumulative view of Net Earnings)
6/ Analyzing
Those are the main components of the Balance Sheet, and they can differ depending on the type of business
Now let's move onto analyzing the B/S
Here are a few common metrics:
- Current Ratio
- Quick Ratio
- Net Debt to EBITDA
- Debt to Equity
Those are the main components of the Balance Sheet, and they can differ depending on the type of business
Now let's move onto analyzing the B/S
Here are a few common metrics:
- Current Ratio
- Quick Ratio
- Net Debt to EBITDA
- Debt to Equity
7/ Current Ratio
Many of these metrics can be found on various sites or can be manually calculated using the likes of Microsoft Excel, which can be a powerful tool when analyzing
Current Ratio = Current Assets / Current Liabilities
Can the company pay short term liabilities?
Many of these metrics can be found on various sites or can be manually calculated using the likes of Microsoft Excel, which can be a powerful tool when analyzing
Current Ratio = Current Assets / Current Liabilities
Can the company pay short term liabilities?
8/ Current Ratio (Cont'd)
A current ratio above 1 tells you the company is healthy
A current ratio below 1 tells you the company may have trouble paying near-term bills
A current ratio above 1 tells you the company is healthy
A current ratio below 1 tells you the company may have trouble paying near-term bills
9/ Quick Ratio
Quick Ratio = (Cash + A/R) / Current Liabilities
Similar to the current ratio, but this ratio is more focused on how quickly the company can pay short-term bills
Above 1 is good
Below 1 would require further investigation
Quick Ratio = (Cash + A/R) / Current Liabilities
Similar to the current ratio, but this ratio is more focused on how quickly the company can pay short-term bills
Above 1 is good
Below 1 would require further investigation
10/ Net Debt to EBITDA
This metric utilizes the Balance Sheet AND the Income Statement
EBITDA = Earnings Before Income Taxes Depreciation & Amortization
EBITDA can be viewed as the true operating earnings of a business
Net Debt = Total Debt - Cash
This metric utilizes the Balance Sheet AND the Income Statement
EBITDA = Earnings Before Income Taxes Depreciation & Amortization
EBITDA can be viewed as the true operating earnings of a business
Net Debt = Total Debt - Cash
11/ Net Debt to EBITDA
This metric tells us how many times EBITDA needs to turn over to pay off the net debt amount
This metric tells us how many times EBITDA needs to turn over to pay off the net debt amount
12/ Debt to Equity
Total Liabilities / Total Equity
This metric shows how leveraged the company is
A higher reading, means higher leverage, which could be unhealthy
I look for a reading BELOW 1.5
Total Liabilities / Total Equity
This metric shows how leveraged the company is
A higher reading, means higher leverage, which could be unhealthy
I look for a reading BELOW 1.5
13/ There are other metrics out there that could be more sector specific, especially when discussing inventory
14/ Conclusion
The B/S can tell you a lot about the health of a business
The health of a business is important, especially in slow economic times
As an investor, you want to know:
- How much debt a co has
- Debt can be paid off
- How leveraged a co is
- How efficient a co is
The B/S can tell you a lot about the health of a business
The health of a business is important, especially in slow economic times
As an investor, you want to know:
- How much debt a co has
- Debt can be paid off
- How leveraged a co is
- How efficient a co is
Hopefully you found this thread educational and helpful
This week I will detail out the Statement of Cash Flows and the Income Statement as well
Make sure you follow me so you do not miss those: @dividend_dollar
This week I will detail out the Statement of Cash Flows and the Income Statement as well
Make sure you follow me so you do not miss those: @dividend_dollar
If you are looking for more investing content, every Monday morning I put out my weekly newsletter
The Newsletter covers:
- Weekly Recap
- A Look Ahead
- Stock Deep Dives
- Monthly Portfolio Updates
- Notable Stock Upgrades/Downgrades
- And MORE
roussinfinancial.substack.com
The Newsletter covers:
- Weekly Recap
- A Look Ahead
- Stock Deep Dives
- Monthly Portfolio Updates
- Notable Stock Upgrades/Downgrades
- And MORE
roussinfinancial.substack.com
Loading suggestions...