

If you ignore risk management in #crypto, you will get rekt.
This is my ultimate beginner's guide to risk management 👇
1/37
This is my ultimate beginner's guide to risk management 👇
1/37
Has anybody told you "risk 1% per trade"? That advice is at best severely limiting and at worst, damaging. In crypto, people pay lip service to risk management but rarely discuss how to do it right.
So allow me 😘
2/37
So allow me 😘
2/37
There's a lot of maths involved in this and I suck at maths. If you do too, don't worry, I've had my team put together a spreadsheet that does the math for you. To fill in this spreadsheet you will need a few numbers:
3/37
3/37
◆◆ Your Strike Rate ◆◆
This is how many trades are closed in profit vs loss. You can calculate this by looking at your trading history. If you took 200 trades closed 120 in profit and 80 in loss your strike rate is 60% and loss rate 40%.
4/37
This is how many trades are closed in profit vs loss. You can calculate this by looking at your trading history. If you took 200 trades closed 120 in profit and 80 in loss your strike rate is 60% and loss rate 40%.
4/37
◆◆ Your Risk-to-Reward Ratio (RR ratio) ◆◆
This is the ratio of how much you risk on a trade and how much you gain once the trade is closed. If you enter a trade and risk -$1239 but close it out with $2042 profit your RR ratio on that trade is:
2042/1239 = 1.64
5/37
This is the ratio of how much you risk on a trade and how much you gain once the trade is closed. If you enter a trade and risk -$1239 but close it out with $2042 profit your RR ratio on that trade is:
2042/1239 = 1.64
5/37
This makes RR ratio 1:1.64 for that trade or 1.64R. If you calculate your ratio for every winning trade then you can get an average R for your wins. Look over your past trades and calculate your average "Winning R".
6/37
6/37
Using the above method your average "Losing R" will always be 1R because you divide your win by your loss. In future, we will discuss r-multiples but for the time being assume your losing R is always 1R.
Now you have the two main numbers you need for the spreadsheet 👀
7/37
Now you have the two main numbers you need for the spreadsheet 👀
7/37
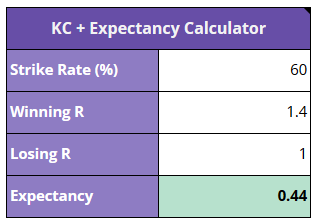
◆◆ Expectancy ◆◆
The first step will be to check the expectancy of your strategy to see if you are profitable. There is an expectancy calc in the spreadsheet but for those interested, this is the formula:
Expectancy = (Strike rate x Winning R) - (Loss rate x Losing R).
8/37
The first step will be to check the expectancy of your strategy to see if you are profitable. There is an expectancy calc in the spreadsheet but for those interested, this is the formula:
Expectancy = (Strike rate x Winning R) - (Loss rate x Losing R).
8/37
So if your strike rate is 60%, your average winning R is 1.8 the formula looks like this:
(0.6*1.4)-(0.4*1) = 0.44
Any number above 1 indicates you are profitable. If you get over 1, you are good to go! If you are lower than 1 your strategy has some issues.
9/37
(0.6*1.4)-(0.4*1) = 0.44
Any number above 1 indicates you are profitable. If you get over 1, you are good to go! If you are lower than 1 your strategy has some issues.
9/37
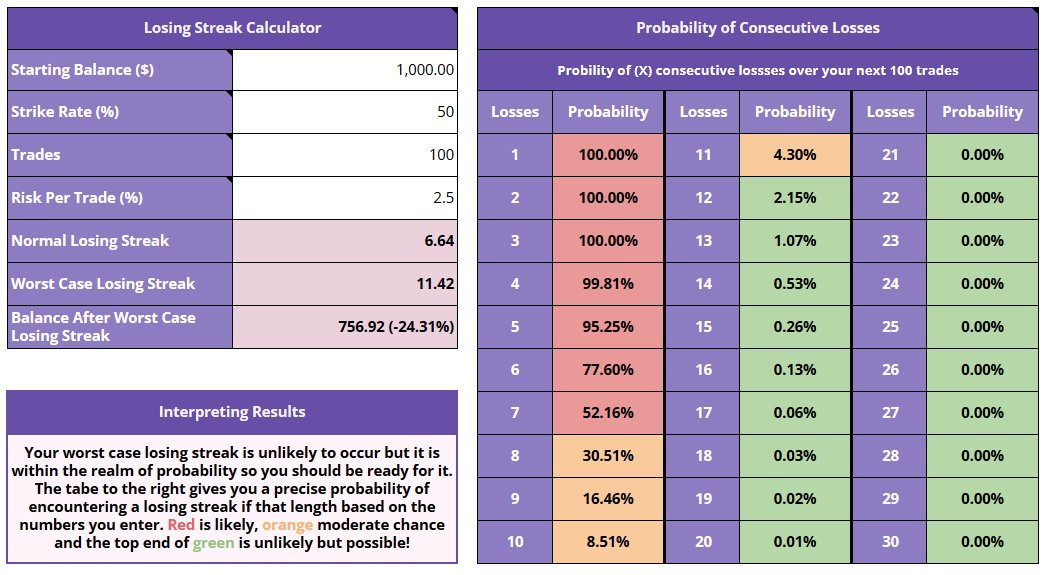
◆◆ Losing Streaks ◆◆
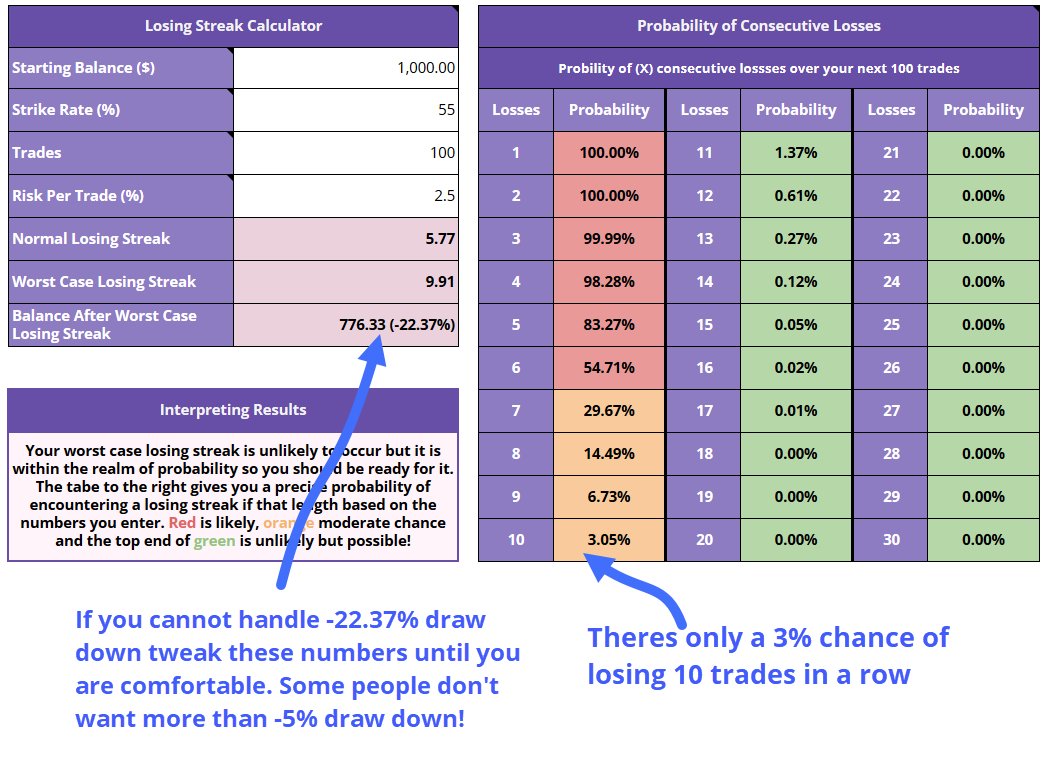
Managing your risk means being prepared for the worst-case scenario. Most traders don't know what the worst-case scenario is, but there's a formula for calculating your probable losing streak over (X) trades. The spreadsheet does this for you!
10/37
Managing your risk means being prepared for the worst-case scenario. Most traders don't know what the worst-case scenario is, but there's a formula for calculating your probable losing streak over (X) trades. The spreadsheet does this for you!
10/37
If your strike rate is 50% over the course of 100 trades it is statistically normal to lose 7 trades in a row. However, if you're unlucky, it's probable to lose up to 11. This formula works by calculating the probability of hitting a long losing streak.
11/37
11/37
The table to the right shows you the probability of encountering (X) losses over the trades you specified. The red highlighted cells indicate a high chance, orange a moderate and green is extremely unlikely!
12/37
12/37
Now that you know how long a losing streak can be it might hurt a little less when you are in the middle of one. And more importantly, you can put safeguards in place to ensure a losing streak doesn’t take you out. Like risking less per trade. This brings us to KC.
13/37
13/37
◆◆ Kelly Criterion ◆◆
Kelly Criterion is a useful tool for calculating the maximum amount of risk it is safe to take on a trade based on your strike rate and your win/loss ratio.
14/37
Kelly Criterion is a useful tool for calculating the maximum amount of risk it is safe to take on a trade based on your strike rate and your win/loss ratio.
14/37
KC does not account for real-world variables like trading fees, slippage, black swan events, etc. When first using KC most people are shocked at the suggested % risk i.e. With a strike rate of 60% and an average RR of 1.5 your KC suggests a 33.3% risk 👀
15/37
15/37
But is 33.3% risk really that insane? In most cases, yes. But what if you are a position trader? A position trader holds trades for months and may only take a few trades per year, usually spot. As a position trader, a 1% risk is low. Is 33.3% acceptable in this case?
16/37
16/37
Well, it depends on the trader but even if it’s too high it is much closer to the mark than 1% is. Let me prove it. I ran the chart above 1000 times and 33.3% risk outperformed 1% 979 times. Check it out:
17/37
17/37
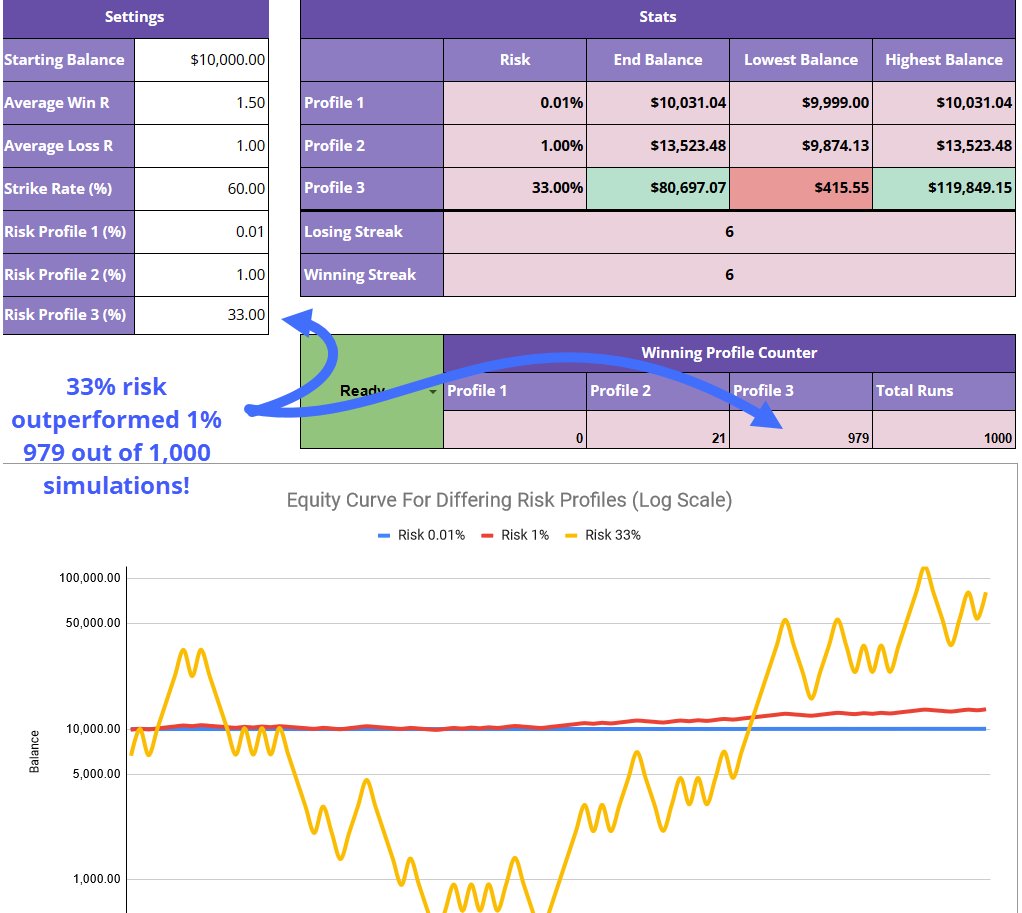
WARNING!!! There were many times when you would have had to endure over 95% drawdown, which most traders could not handle. Add in fees and you'd be rekt. However, half the KC suggestion at 16.67% didn’t hit extreme drawdown as often and still greatly outperformed 1% risk.
18/37
18/37
◆◆ Don't Risk 33% ◆◆
I'm not saying you should ever risk 33%, in real-world trading that would be insane. The point I am making is that risking more than 1% of per trade makes sense mathematically and in practice.
But what is your optimal risk per trade?
19/37
I'm not saying you should ever risk 33%, in real-world trading that would be insane. The point I am making is that risking more than 1% of per trade makes sense mathematically and in practice.
But what is your optimal risk per trade?
19/37
◆◆ Optimal Risk ◆◆
I can’t answer this as it varies based on many factors but I will say to err on the side of caution when using the KC calculator and use one of the lower fractions 1/10 or 1/16 to start with. Here's an example:
20/37
I can’t answer this as it varies based on many factors but I will say to err on the side of caution when using the KC calculator and use one of the lower fractions 1/10 or 1/16 to start with. Here's an example:
20/37
- Example: Day Trader -
If you’re a day trader and your strategy has a 55% strike rate with a winning R of 1.5 you might want to start with 1.56% or 2.5% risk per trade and work your way up.
21/37
If you’re a day trader and your strategy has a 55% strike rate with a winning R of 1.5 you might want to start with 1.56% or 2.5% risk per trade and work your way up.
21/37

Be sure to use the losing streak calculator to calculate your probable worst-case losing streak (10) and how much you'd be down in a losing streak that long(-22.37%) and finally the equity curve simulator to see the difference between 1% and the KC suggested risk.
22/37
22/37
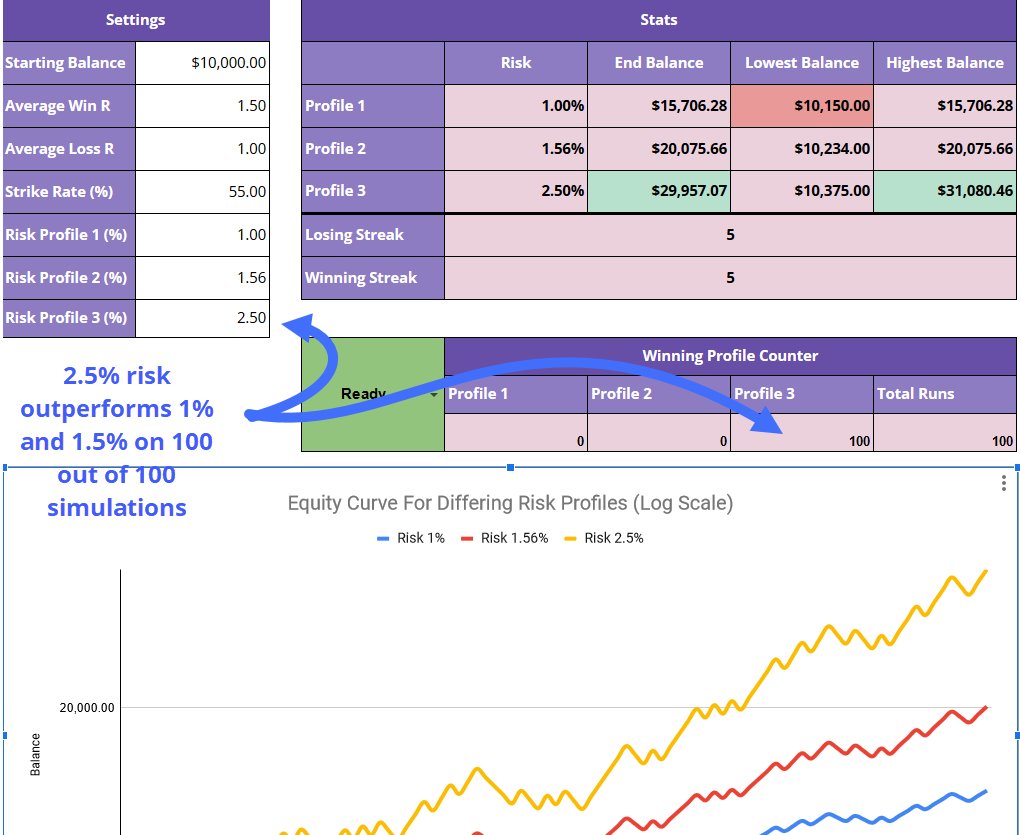
So as long as your as comfortable with the draw down in a losing streak you could consider 2.5%, if you want less draw down 1.56% is the better option and for a minimal draw down go for 1%. But this comes at the cost of growth!
23/37
23/37
◆◆ Risking Over 1% ◆◆
Imo, the maths tells us that if you have a positive expectancy and you can handle a draw down of 20% you should be able to handle over 1% risk per trade. How much risk depends on your drawdown tolerance, trade frequency and countless other factors
24/37
Imo, the maths tells us that if you have a positive expectancy and you can handle a draw down of 20% you should be able to handle over 1% risk per trade. How much risk depends on your drawdown tolerance, trade frequency and countless other factors
24/37
My goal isn't to get you to risk more than 1%, it's to show you that it's not necessarily a bad thing and to arm you with the tools you need in order to make an informed decision on your % risk per trade.
Now, let's look at another common but flawed piece of advice.
25/37
Now, let's look at another common but flawed piece of advice.
25/37
◆◆ Taking Partial Profit ◆◆
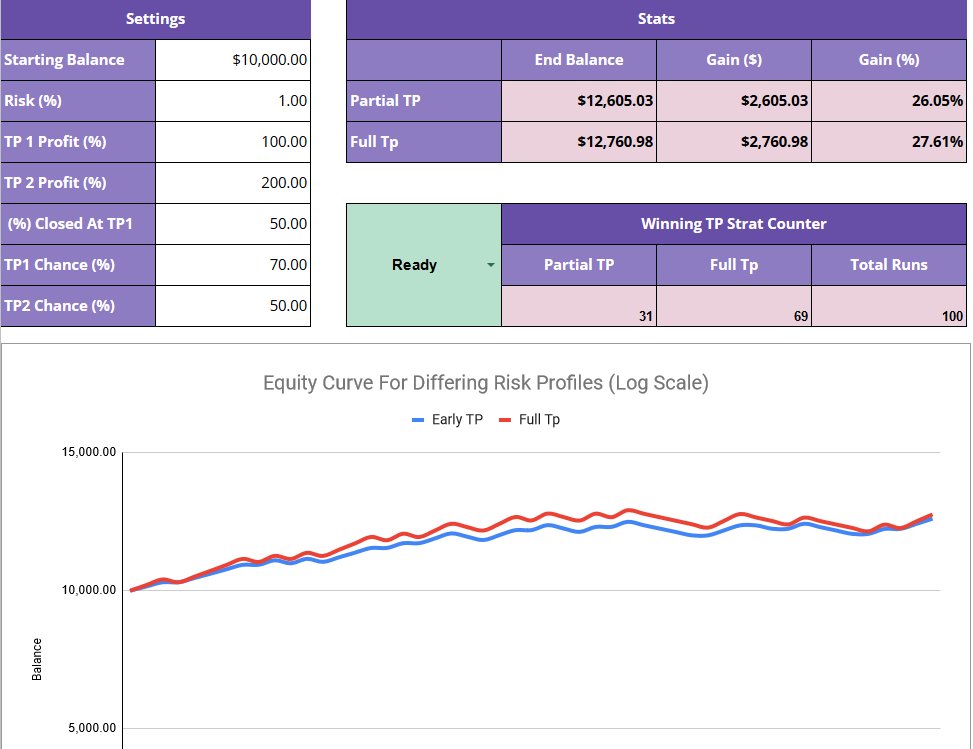
Partial TPs seem like the sensible thing to do but in most cases, it comes at a significant cost. In the example below, a trader taking partial TPs would leave 12.36% of profit on the table after 50 trades 👀
26/37
Partial TPs seem like the sensible thing to do but in most cases, it comes at a significant cost. In the example below, a trader taking partial TPs would leave 12.36% of profit on the table after 50 trades 👀
26/37

Is this a one-off? No. I ran this simulation 100 times and full TP came out on top 69% of the time. Sometimes just barely and other times by a significant margin.
27/37
27/37
There are scenarios in which taking profit early makes sense (I do it) but you need to know the costs.
In the spreadsheet, you will find a tab that lets you play around with different strategies for taking profit early.
You can go one step deeper with taking profits:
28/37
In the spreadsheet, you will find a tab that lets you play around with different strategies for taking profit early.
You can go one step deeper with taking profits:
28/37
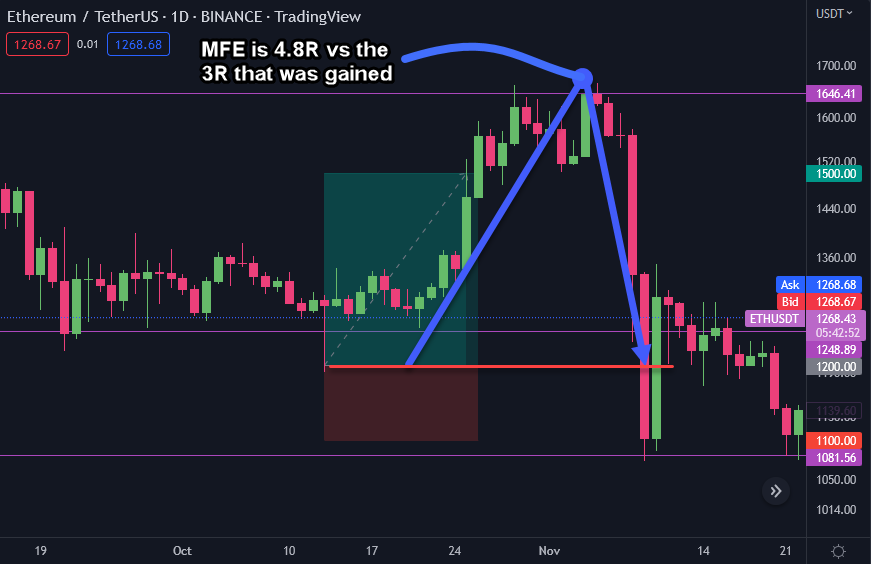
◆◆ Maximum Favourable Excursion (MFE) ◆◆
Setting targets is a major part of risk management and most traders don't set the right targets. A powerful metric for assessing how good your targets are is MFE, but what is it?
29/37
Setting targets is a major part of risk management and most traders don't set the right targets. A powerful metric for assessing how good your targets are is MFE, but what is it?
29/37
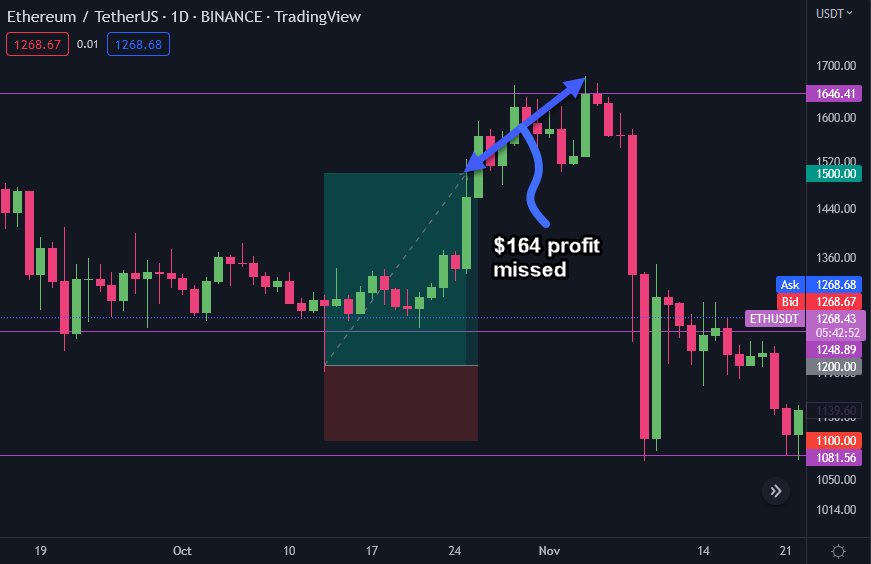
The trade below shows a ETH long at $1.2k recently with a $1.5k n a stop at $1.1k, it's a successful trade. But after hitting target ETH went to $1.6k.
Big deal, it happens. As a trader you can't focus on how much you could have made, you need to follow your strategy.
30/37
Big deal, it happens. As a trader you can't focus on how much you could have made, you need to follow your strategy.
30/37
But, using MFE you might be able to catch some of these extra moves.
MFE is the distance between your entry and the peak level price hits before hitting your stop. If you calculate the MFE for all of your trades, you can use that data to optimise your targets. How?
31/37
MFE is the distance between your entry and the peak level price hits before hitting your stop. If you calculate the MFE for all of your trades, you can use that data to optimise your targets. How?
31/37
If you have a lot of trades where the MFE extends beyond your targets you should investigate why. Maybe your targets are set at weak support/resistance, maybe your entry signals are so good they often blast past what you expect.
32/37
32/37
Once you assess exactly why you can consider extending your targets on all your trades.
This also works the opposite way. Tracking MFE on all your trades you might find that you would be more profitable with smaller targets if the MFE is often below your actual target.
33/37
This also works the opposite way. Tracking MFE on all your trades you might find that you would be more profitable with smaller targets if the MFE is often below your actual target.
33/37
◆◆ Summary ◆◆
I hope this guide shows you that you shouldn't blindly follow the standard generic risk management advice!
Your personal risk management rules will evolve as you become a better trader.
34/37
I hope this guide shows you that you shouldn't blindly follow the standard generic risk management advice!
Your personal risk management rules will evolve as you become a better trader.
34/37
If you keep on top of optimising it you can increase your portfolio exponentially vs using the same 1% risk on every trade for the next decade.
In the next risk management thread, we will delve deeper into risk management and discuss some advanced strategies.
35/37
In the next risk management thread, we will delve deeper into risk management and discuss some advanced strategies.
35/37
◆◆ Spreadsheet ◆◆
The spreadsheet below was manually ported by my team from JS code into excel so there may be errors. If you find any please report them to me! Click "File" then "Download" don't request edit access.
#gid=764082729" target="_blank" rel="noopener" onclick="event.stopPropagation()">docs.google.com
36/37

I hope you've found this thread helpful.
Follow me @LadyofCrypto1 for more.
Like/Retweet the first tweet below if you can:
37/37
Follow me @LadyofCrypto1 for more.
Like/Retweet the first tweet below if you can:
37/37
Loading suggestions...