

How to use orderflow to find strong trending days:
A thread 🧵
(1/n)
A thread 🧵
(1/n)
Opening of the market is important. Where we open and how we move in opening 5 mins shows the intent and aggression of large players.
Today we opened right at previous week value area low and started moving up.
(2/n)
Today we opened right at previous week value area low and started moving up.
(2/n)

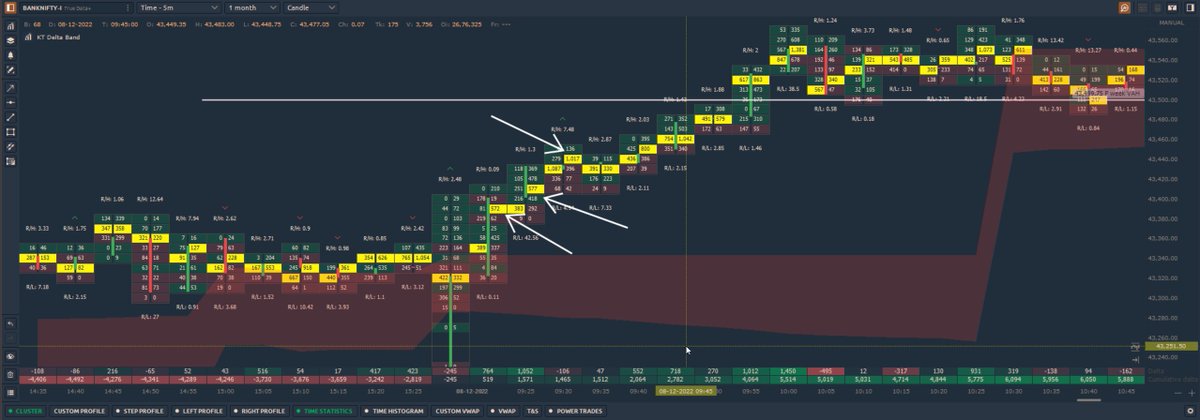
We also broke out of delta bands area (delta bands signify the location where most aggressive large positions are present)
See orderflow on ask side
(3/n)
See orderflow on ask side
(3/n)
Longs took control right from open and see the strength of long orders at market prices. It shows long mean serious business.
This is inspite of neutral closing yesterday after a fall from highs.
(4/n)
This is inspite of neutral closing yesterday after a fall from highs.
(4/n)
In the opening one hr itself, we broke previous week value area high. It is a very important level and break of it signifies range expansion.
Again, see the strength of the longs orders at market price during breakout (ask side)
(5/n)
Again, see the strength of the longs orders at market price during breakout (ask side)
(5/n)
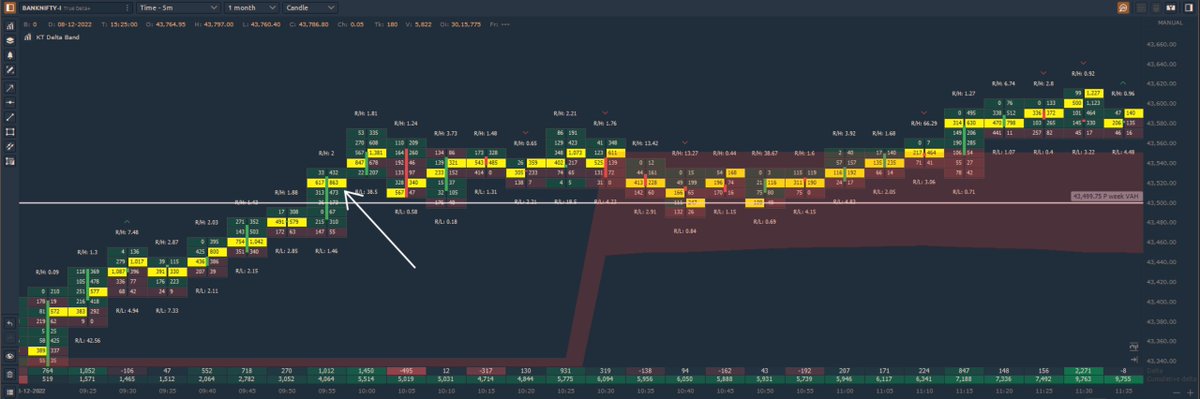
This is a further confirmation that longs are serious today.
Delta bands shifted up indicating volumes at highs are> longs at lows.
This defined a little risk of liquidation but longs never gave up control
Shift in bands seen below
(6/n)
Delta bands shifted up indicating volumes at highs are> longs at lows.
This defined a little risk of liquidation but longs never gave up control
Shift in bands seen below
(6/n)
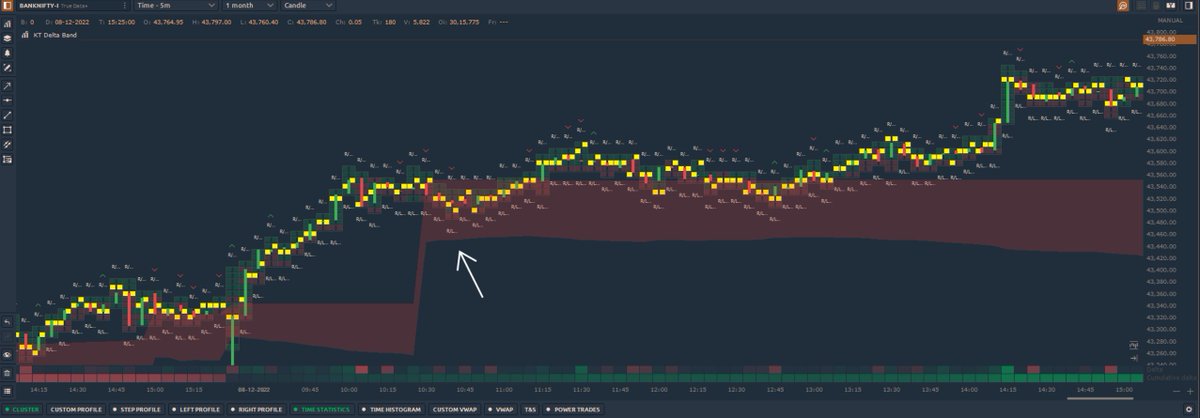
Using a few data pointers like this, one can identify the kind of day we are trading and avoid going against it.
However, expecting a trend move is one thing but gauging the range of trend (esp on super trending days of 2x ATR is very very difficult).
(7/n)
However, expecting a trend move is one thing but gauging the range of trend (esp on super trending days of 2x ATR is very very difficult).
(7/n)
As a trader, keep expectations realistic.
If you found this info useful, follow @KillerTrader_ for more such knowledge.
Make sure to like and re-tweet this thread.
For live market updates, join t.me
Charts are powered by @QuantowerIndia
#StockMarket
If you found this info useful, follow @KillerTrader_ for more such knowledge.
Make sure to like and re-tweet this thread.
For live market updates, join t.me
Charts are powered by @QuantowerIndia
#StockMarket

Loading suggestions...