

1/
Get a cup of coffee.
In this thread, we'll explore the question:
As investors, how often should we check stock prices?
To answer this, we'll draw on key ideas and concepts from many different fields -- probability, information theory, psychology, etc.
Get a cup of coffee.
In this thread, we'll explore the question:
As investors, how often should we check stock prices?
To answer this, we'll draw on key ideas and concepts from many different fields -- probability, information theory, psychology, etc.

2/
Imagine we have a stock: ABC, Inc.
Every day that the market is open, our stock either:
- Goes UP 1%, or
- Goes DOWN 1%.
For simplicity, let's say these are the only 2 possible outcomes on any given trading day.
Imagine we have a stock: ABC, Inc.
Every day that the market is open, our stock either:
- Goes UP 1%, or
- Goes DOWN 1%.
For simplicity, let's say these are the only 2 possible outcomes on any given trading day.

3/
Suppose we think ABC is a "good" investment.
That is, the company has a wide moat, good returns on capital, decent growth prospects, etc. And the stock trades at a reasonable price.
So, we buy the stock -- expecting to make a very good return on it. Say, ~15% per year.
Suppose we think ABC is a "good" investment.
That is, the company has a wide moat, good returns on capital, decent growth prospects, etc. And the stock trades at a reasonable price.
So, we buy the stock -- expecting to make a very good return on it. Say, ~15% per year.
4/
Now, there are about 250 trading days in a year. That's ~365 days minus weekends, holidays, etc.
So, if we're right about our ~15% per year estimate:
- On how many of these 250 days will we be UP 1%?
- And on how many days will we be DOWN 1%?
Now, there are about 250 trading days in a year. That's ~365 days minus weekends, holidays, etc.
So, if we're right about our ~15% per year estimate:
- On how many of these 250 days will we be UP 1%?
- And on how many days will we be DOWN 1%?
5/
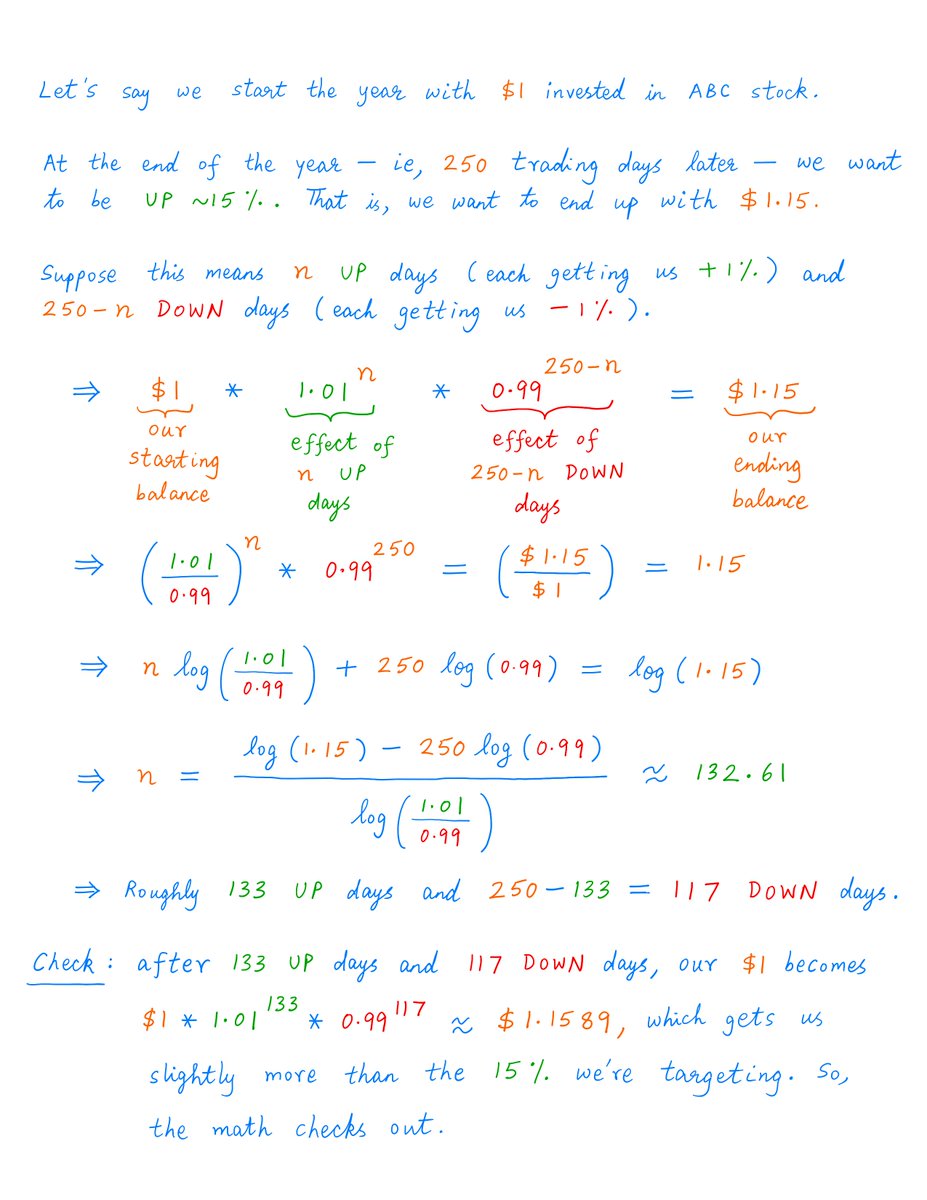
This is a fairly simple math exercise.
It turns out: we'll need about 133 UP days.
And the other 250 - 133 = 117 can be DOWN days.
Calculations:
This is a fairly simple math exercise.
It turns out: we'll need about 133 UP days.
And the other 250 - 133 = 117 can be DOWN days.
Calculations:
6/
This means, to get ~15% per year, we need about 133/250 = 53.2% of our days to be UP days.
The other 100 - 53.2 = 46.8% can be DOWN days.
So, yes, we need *more* UP days than DOWN days.
But NOT by a huge margin. We just need the odds to be 53.2 vs 46.8 in our favor.
This means, to get ~15% per year, we need about 133/250 = 53.2% of our days to be UP days.
The other 100 - 53.2 = 46.8% can be DOWN days.
So, yes, we need *more* UP days than DOWN days.
But NOT by a huge margin. We just need the odds to be 53.2 vs 46.8 in our favor.
7/
This is a key concept in probability.
Even if the odds seem to be only *mildly* favorable (here, 53.2 vs 46.8), we can exploit them to achieve pretty stellar results (here, ~15% per year) -- IF we are allowed to play these odds *repeatedly*, day in and day out.
This is a key concept in probability.
Even if the odds seem to be only *mildly* favorable (here, 53.2 vs 46.8), we can exploit them to achieve pretty stellar results (here, ~15% per year) -- IF we are allowed to play these odds *repeatedly*, day in and day out.
8/
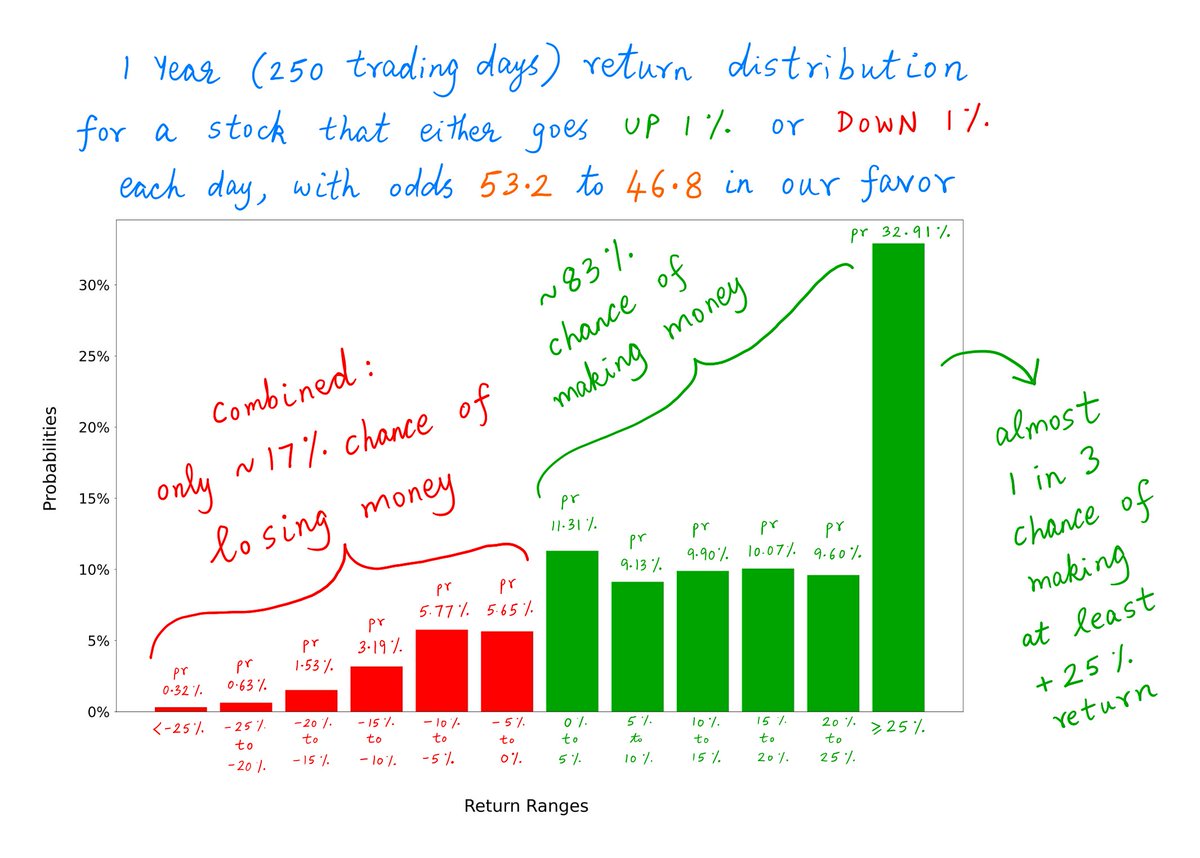
For example, with ABC stock, there's only a ~53% chance of going UP any given day. That's almost a 50/50 toss up.
But *press* that small advantage 250 times. And suddenly, we have an ~83% chance of being UP for the year.
For example, with ABC stock, there's only a ~53% chance of going UP any given day. That's almost a 50/50 toss up.
But *press* that small advantage 250 times. And suddenly, we have an ~83% chance of being UP for the year.
9/
This illustrates how even *small* advantages -- when *compounded* over *long* periods of time -- can produce truly remarkable results.
This is also closely related to a few key ideas in Information Theory -- "signal", "noise", "entropy", etc.
Let's dive into this.
This illustrates how even *small* advantages -- when *compounded* over *long* periods of time -- can produce truly remarkable results.
This is also closely related to a few key ideas in Information Theory -- "signal", "noise", "entropy", etc.
Let's dive into this.
10/
A "signal" is something like a fundamental truth.
When we study complex systems -- eg, a company, an economy, a human body, a chess playing AI -- we're searching for signals. Fundamental truths about these systems that (usually) only change slowly with time.
A "signal" is something like a fundamental truth.
When we study complex systems -- eg, a company, an economy, a human body, a chess playing AI -- we're searching for signals. Fundamental truths about these systems that (usually) only change slowly with time.
11/
For example, are ABC Inc.'s business fundamentals improving or worsening?
Is the US economy growing or shrinking?
Is a person losing or gaining weight?
Is the chess playing AI becoming better or worse over time?
These are "signals" we are searching for.
For example, are ABC Inc.'s business fundamentals improving or worsening?
Is the US economy growing or shrinking?
Is a person losing or gaining weight?
Is the chess playing AI becoming better or worse over time?
These are "signals" we are searching for.
12/
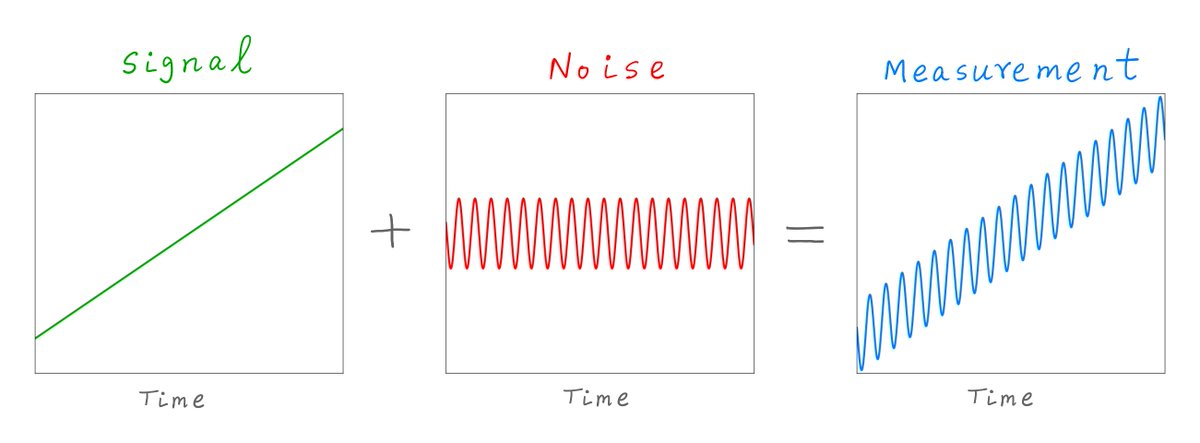
But a sad fact of life is:
"Signals" can rarely be measured exactly.
Almost all measurements of signals come with a significant amount of random fluctuations.
That's what "noise" is -- wiggles on top of a signal that make it hard to measure the signal exactly.
But a sad fact of life is:
"Signals" can rarely be measured exactly.
Almost all measurements of signals come with a significant amount of random fluctuations.
That's what "noise" is -- wiggles on top of a signal that make it hard to measure the signal exactly.
13/
For example, ABC may be a strong business that's growing its earnings at 15% per year.
But its stock may not reflect that every single day.
On a day to day basis, the stock may still look like it's fluctuating randomly.
For example, ABC may be a strong business that's growing its earnings at 15% per year.
But its stock may not reflect that every single day.
On a day to day basis, the stock may still look like it's fluctuating randomly.
14/
Similarly, a person may be following the right diet and losing weight over time.
But if we measure their weight every single day, we're likely to see "noise". They may actually *gain* weight on some days -- eg, if they step on the scale after drinking a bottle of water.
Similarly, a person may be following the right diet and losing weight over time.
But if we measure their weight every single day, we're likely to see "noise". They may actually *gain* weight on some days -- eg, if they step on the scale after drinking a bottle of water.
15/
"Entropy" is essentially the amount of randomness in the measurement of a signal.
For example, if we measure whether we made money on ABC stock since yesterday, that measurement has a lot of entropy in it. As we saw, it's almost a 50/50 toss up.
"Entropy" is essentially the amount of randomness in the measurement of a signal.
For example, if we measure whether we made money on ABC stock since yesterday, that measurement has a lot of entropy in it. As we saw, it's almost a 50/50 toss up.
16/
But suppose we wait a year before measuring whether we made money on ABC. The entropy of this measurement is much lower.
Why? Because, as we saw, this is more like an 80/20 coin toss. It contains less randomness.
*Biased* coins have LESS entropy than *fair* coins.
But suppose we wait a year before measuring whether we made money on ABC. The entropy of this measurement is much lower.
Why? Because, as we saw, this is more like an 80/20 coin toss. It contains less randomness.
*Biased* coins have LESS entropy than *fair* coins.
17/
"Information" is the resolution of uncertainty.
The MORE information we have about a signal, the LESS uncertain we are about it. The LESS room there is for randomness to play a role.
That means LESS entropy.
"Information" is the resolution of uncertainty.
The MORE information we have about a signal, the LESS uncertain we are about it. The LESS room there is for randomness to play a role.
That means LESS entropy.
18/
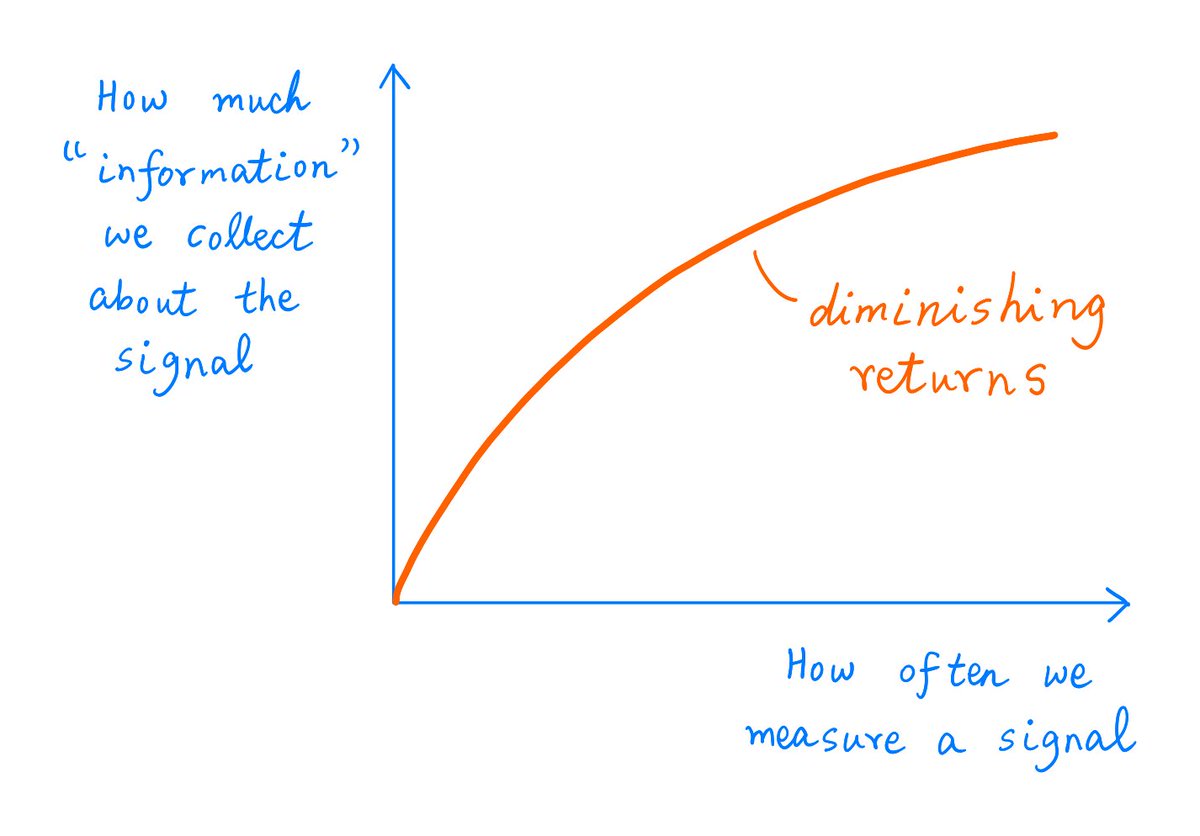
For example, suppose we are uncertain about whether ABC is a good business.
So, we check ABC's stock price every hour.
Does our 50'th such "measurement" really do anything to resolve our uncertainty -- beyond whatever information the first 49 measurements already gave us?
For example, suppose we are uncertain about whether ABC is a good business.
So, we check ABC's stock price every hour.
Does our 50'th such "measurement" really do anything to resolve our uncertainty -- beyond whatever information the first 49 measurements already gave us?
19/
This brings us to our key information theoretic insight about checking stock prices:
If "business fundamentals" are the "signals" we really care about, then checking stock prices MORE often may actually give us LESS "information" -- and MORE "noise" -- *per* measurement.
This brings us to our key information theoretic insight about checking stock prices:
If "business fundamentals" are the "signals" we really care about, then checking stock prices MORE often may actually give us LESS "information" -- and MORE "noise" -- *per* measurement.
20/
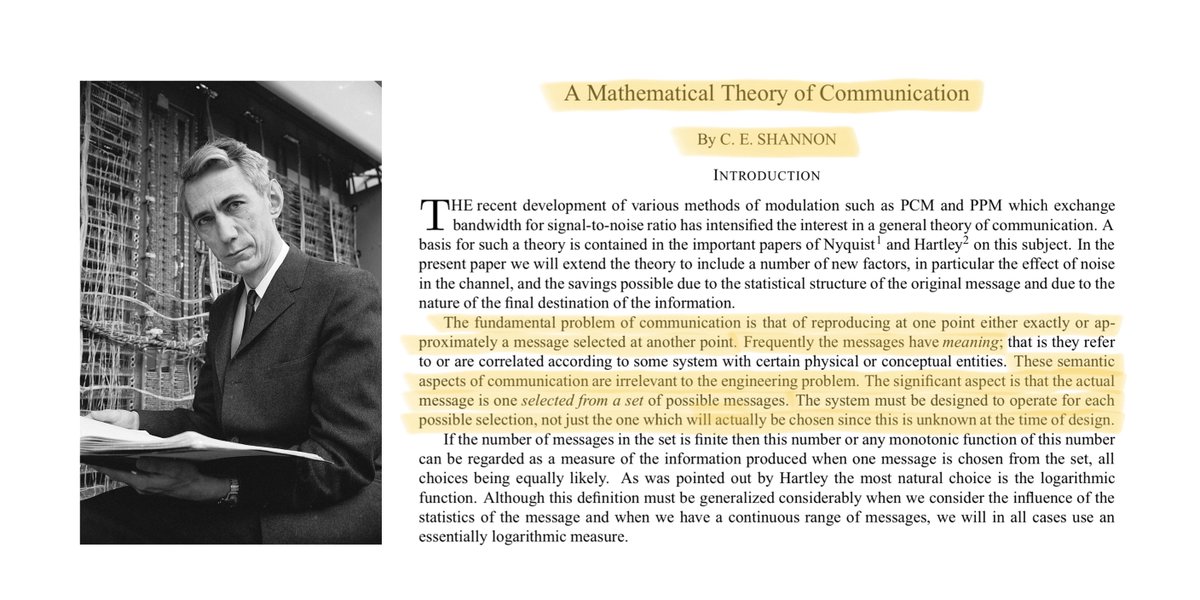
Claude Shannon was the brilliant scientist, engineer, and tinkerer who gave us Information Theory.
Shannon worked out precise mathematical formulas that gave rigorous meaning to everyday words like "information", "noise", and "entropy".
Claude Shannon was the brilliant scientist, engineer, and tinkerer who gave us Information Theory.
Shannon worked out precise mathematical formulas that gave rigorous meaning to everyday words like "information", "noise", and "entropy".
21/
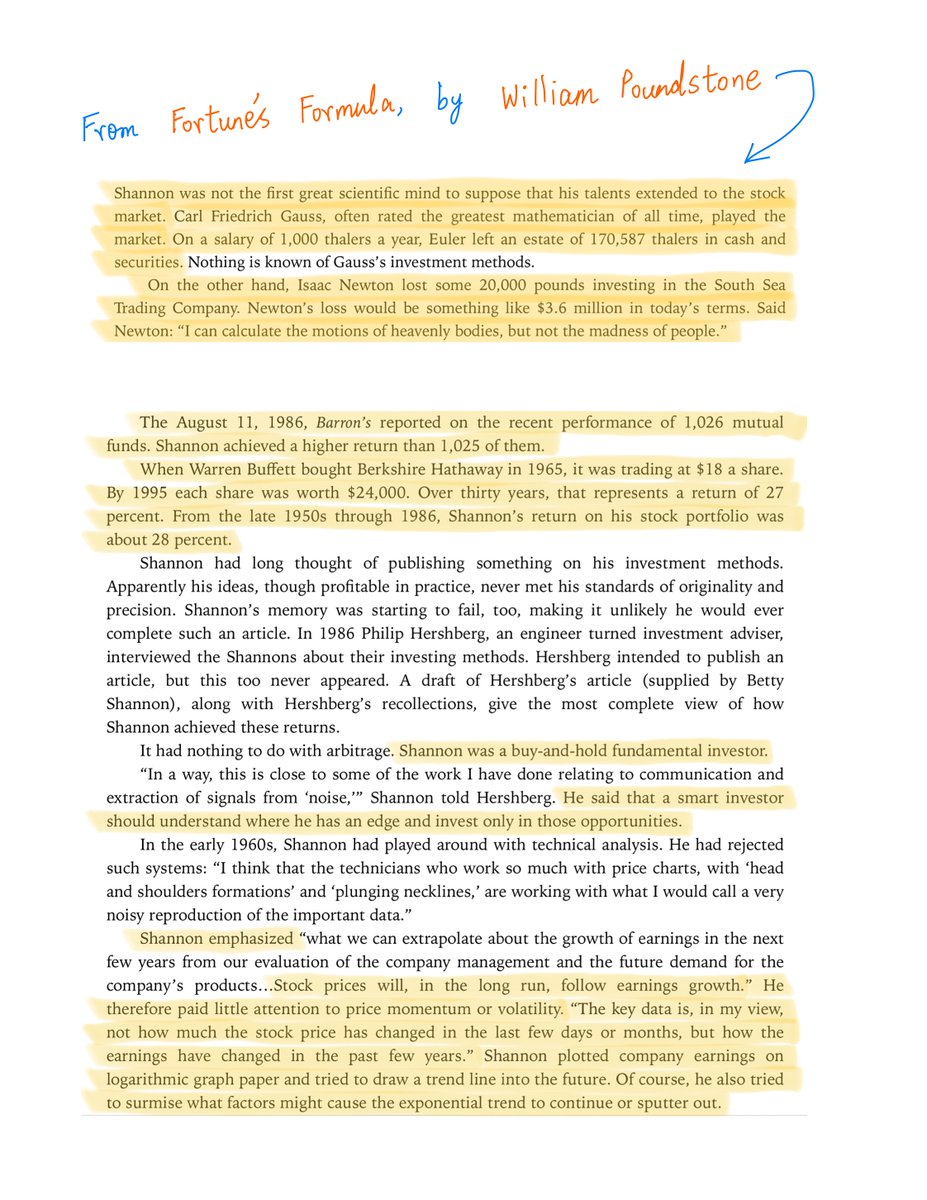
Perhaps it's NOT a coincidence that Shannon was ALSO a phenomenal *investor*.
By some measures, Shannon's portfolio even outperformed Warren Buffett's over a multi-decade time frame!
From the wonderful book Fortune's Formula by @WPoundstone:
Perhaps it's NOT a coincidence that Shannon was ALSO a phenomenal *investor*.
By some measures, Shannon's portfolio even outperformed Warren Buffett's over a multi-decade time frame!
From the wonderful book Fortune's Formula by @WPoundstone:
22/
Beyond probability and information theory, checking stock prices can also affect us *psychologically*.
We let stock prices dictate our mood, feelings, etc.
For example, we tend to feel optimistic when the market is UP and pessimistic when it's DOWN.
Beyond probability and information theory, checking stock prices can also affect us *psychologically*.
We let stock prices dictate our mood, feelings, etc.
For example, we tend to feel optimistic when the market is UP and pessimistic when it's DOWN.
23/
To illustrate, let's say both Alice and Bob have $100K to invest. They both buy $100K worth of ABC stock.
Alice logs in to her brokerage account and checks her portfolio every day.
Bob is more relaxed. He checks his portfolio only about once a quarter.
To illustrate, let's say both Alice and Bob have $100K to invest. They both buy $100K worth of ABC stock.
Alice logs in to her brokerage account and checks her portfolio every day.
Bob is more relaxed. He checks his portfolio only about once a quarter.
24/
Clearly, both Alice and Bob will enjoy the exact same returns. They'll make exactly the same amount of money -- because they have identical portfolios.
But Bob is likely to FEEL much better about his portfolio than Alice.
Clearly, both Alice and Bob will enjoy the exact same returns. They'll make exactly the same amount of money -- because they have identical portfolios.
But Bob is likely to FEEL much better about his portfolio than Alice.
25/
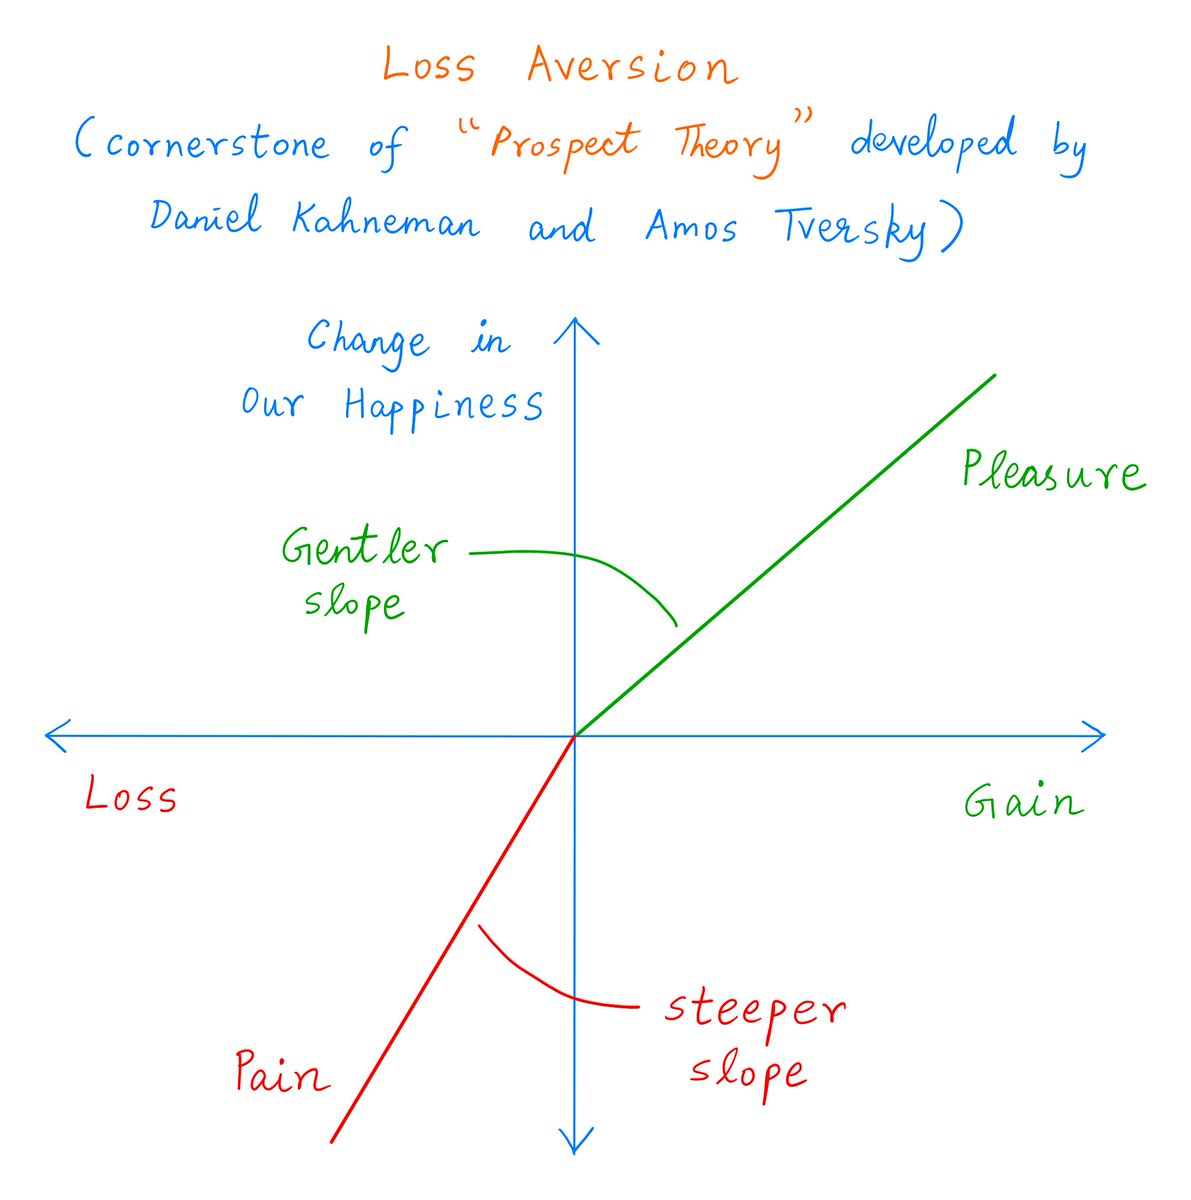
Why? Because the pang of a $1 loss tends to be much worse than the pleasure of an equivalent $1 gain.
This psychological tendency is called "loss aversion".
It was popularized by the Nobel prize winning economist and psychologist, Daniel Kahneman.
Why? Because the pang of a $1 loss tends to be much worse than the pleasure of an equivalent $1 gain.
This psychological tendency is called "loss aversion".
It was popularized by the Nobel prize winning economist and psychologist, Daniel Kahneman.
26/
To see how loss aversion can make Alice so much worse off than Bob, let's do a simulation.
Here's a year in the life of ABC stock -- with 133 UP days and 117 DOWN days randomly distributed.
Starting from $100K, this leaves both Alice and Bob with ~$116K at year end.
To see how loss aversion can make Alice so much worse off than Bob, let's do a simulation.
Here's a year in the life of ABC stock -- with 133 UP days and 117 DOWN days randomly distributed.
Starting from $100K, this leaves both Alice and Bob with ~$116K at year end.

27/
We know Alice checks her portfolio every day.
That is, each day, Alice compares her portfolio's value to what it was the previous day.
Suppose her portfolio shows a gain.
Then, for every $1 of such gain, let's say Alice gets "1 unit of happiness".
We know Alice checks her portfolio every day.
That is, each day, Alice compares her portfolio's value to what it was the previous day.
Suppose her portfolio shows a gain.
Then, for every $1 of such gain, let's say Alice gets "1 unit of happiness".
28/
But here's the catch.
Suppose Alice's portfolio *loses* value compared to the previous day.
Then, for every $1 of such loss, Alice loses TWO units of happiness.
That's loss aversion. Losses sadden us MORE than gains delight us. In this case, 2x more.
But here's the catch.
Suppose Alice's portfolio *loses* value compared to the previous day.
Then, for every $1 of such loss, Alice loses TWO units of happiness.
That's loss aversion. Losses sadden us MORE than gains delight us. In this case, 2x more.
29/
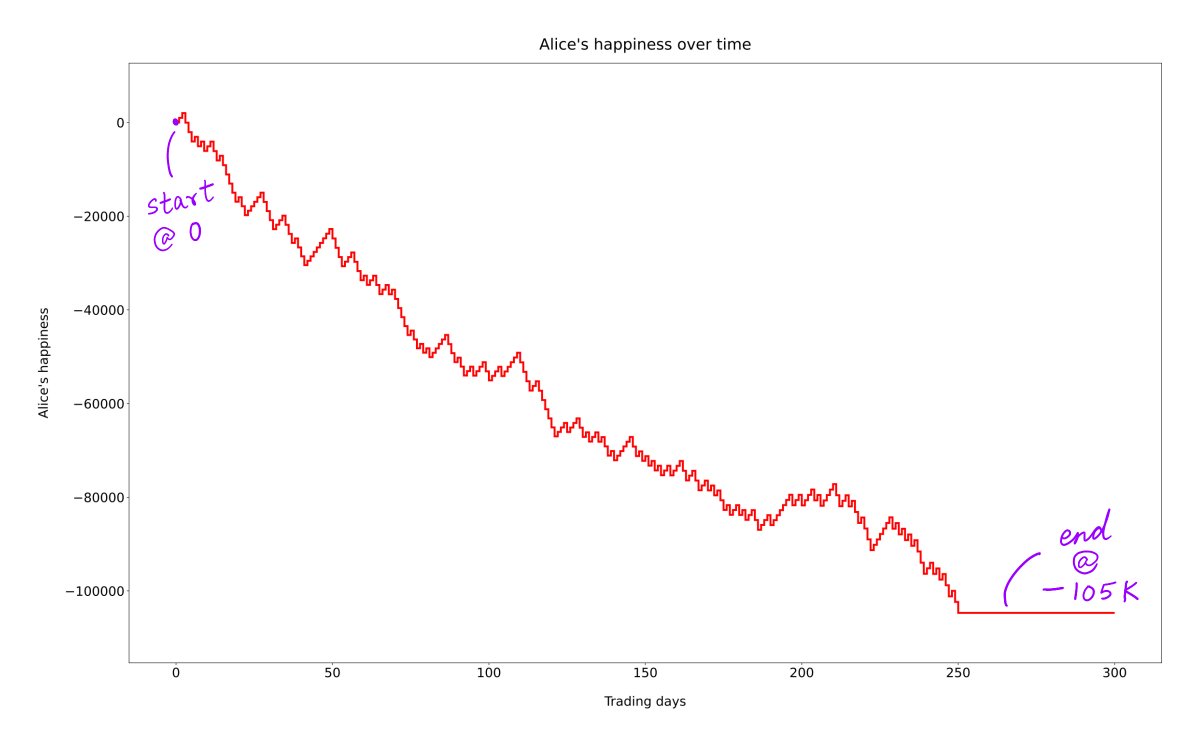
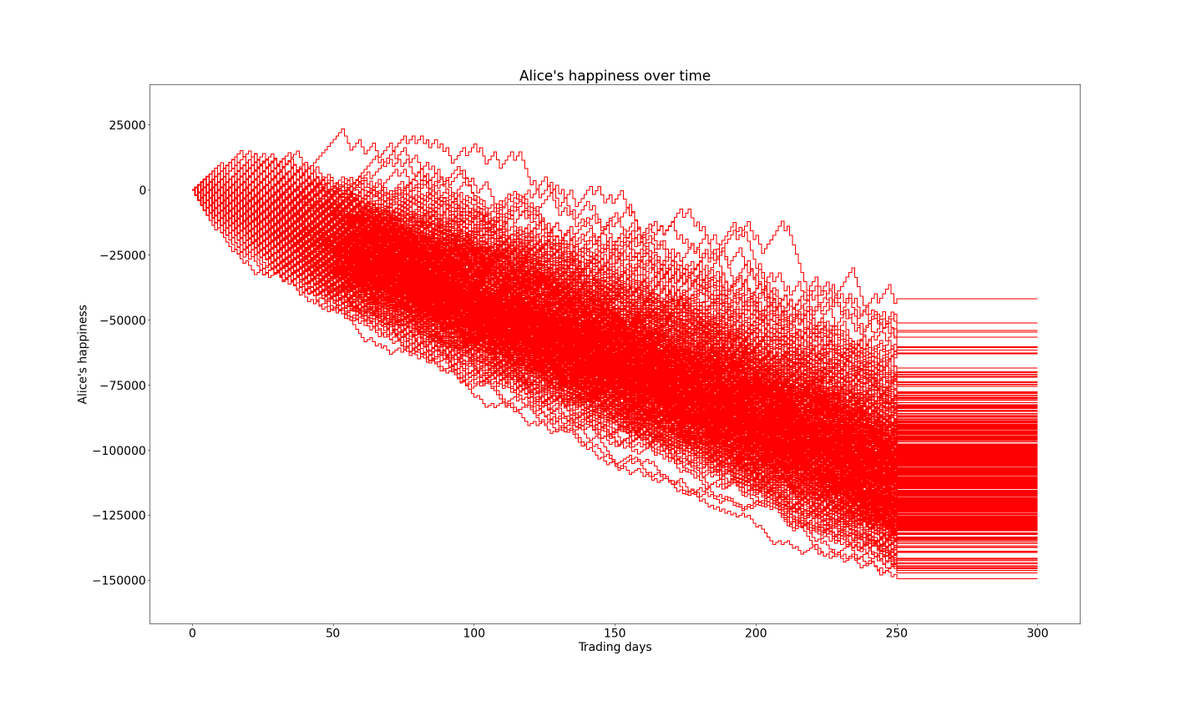
With these assumptions, we can plot Alice's "happiness" over time -- as she experiences these daily emotional jolts.
Here's how Alice fares. It's NOT pretty.
Alice earns a better than 15% return during this year.
And yet, she ends up miserable.
With these assumptions, we can plot Alice's "happiness" over time -- as she experiences these daily emotional jolts.
Here's how Alice fares. It's NOT pretty.
Alice earns a better than 15% return during this year.
And yet, she ends up miserable.
30/
The reason is:
On each day, the odds favor Alice only slightly: 53.2 to 46.8.
So, Alice experiences only a few more UP days than DOWN days.
But each DOWN day *impacts* Alice's happiness severely -- thanks to loss aversion. A few more UP days aren't enough to compensate.
The reason is:
On each day, the odds favor Alice only slightly: 53.2 to 46.8.
So, Alice experiences only a few more UP days than DOWN days.
But each DOWN day *impacts* Alice's happiness severely -- thanks to loss aversion. A few more UP days aren't enough to compensate.
31/
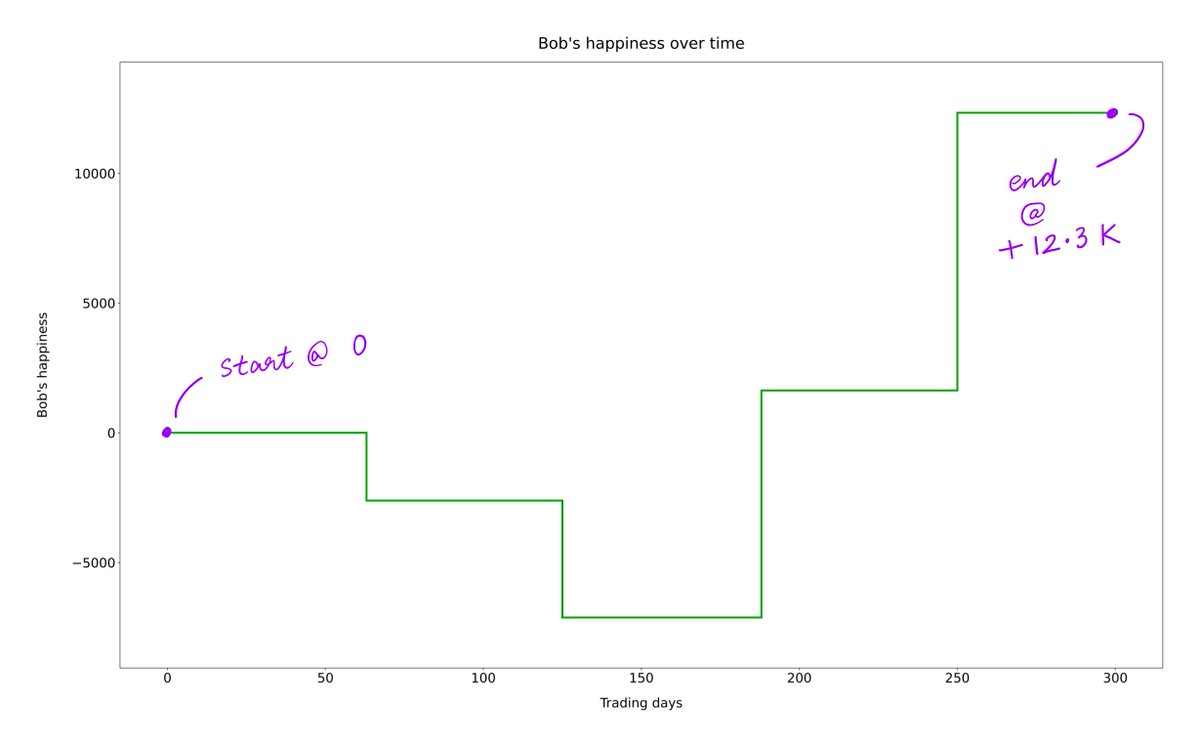
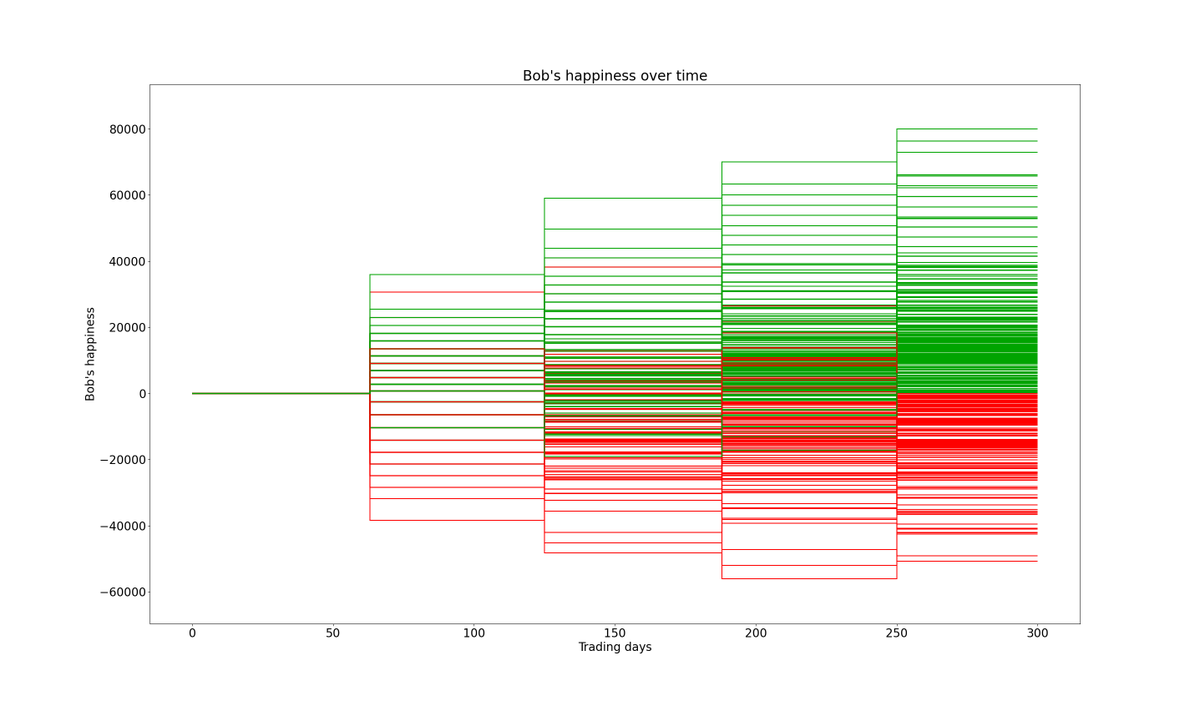
By contrast, Bob only checks his portfolio every quarter.
So, the odds favor him much more: nearly 70/30.
Also, these odds *combine* with the power of compounding. This generally produces larger swings to the upside than the downside -- which is great for Bob's happiness.
By contrast, Bob only checks his portfolio every quarter.
So, the odds favor him much more: nearly 70/30.
Also, these odds *combine* with the power of compounding. This generally produces larger swings to the upside than the downside -- which is great for Bob's happiness.
32/
So, in all cases, Alice and Bob end up with the same amount of *money*.
But Alice is very unlikely to end up *happy*, whereas Bob has a fair shot at it.
Wealth is a function of STATE. Happiness is a function of PATH.
So, in all cases, Alice and Bob end up with the same amount of *money*.
But Alice is very unlikely to end up *happy*, whereas Bob has a fair shot at it.
Wealth is a function of STATE. Happiness is a function of PATH.
33/
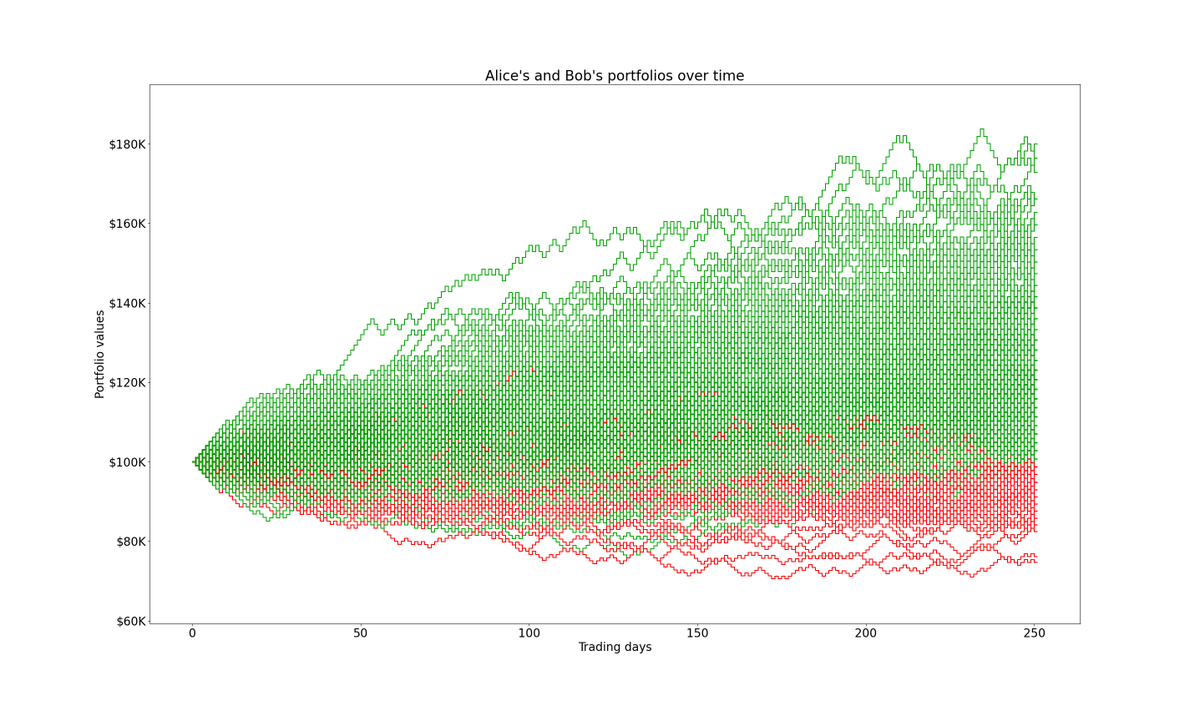
To demonstrate, here are 500 simulations of ABC stock over 1 year.
In most cases, the stock makes MONEY for Alice and Bob.
But it makes them HAPPY less often. That's a function of the PATH taken by the stock, and how often Alice and Bob check up on it.
To demonstrate, here are 500 simulations of ABC stock over 1 year.
In most cases, the stock makes MONEY for Alice and Bob.
But it makes them HAPPY less often. That's a function of the PATH taken by the stock, and how often Alice and Bob check up on it.
34/
So, here's what we should strive for:
- Either we shouldn't check stock prices very often,
- Or, if we do, we shouldn't let day to day swings in our portfolio affect our sense of happiness or well being too much.
So, here's what we should strive for:
- Either we shouldn't check stock prices very often,
- Or, if we do, we shouldn't let day to day swings in our portfolio affect our sense of happiness or well being too much.
35/
Paraphrasing Rudyard Kipling, we should be able to meet with unrealized gains and losses, and treat those two impostors just the same.
These recommendations are hard to follow.
But I believe it's the only way we investors can compound our wealth while retaining our sanity.
Paraphrasing Rudyard Kipling, we should be able to meet with unrealized gains and losses, and treat those two impostors just the same.
These recommendations are hard to follow.
But I believe it's the only way we investors can compound our wealth while retaining our sanity.
36/
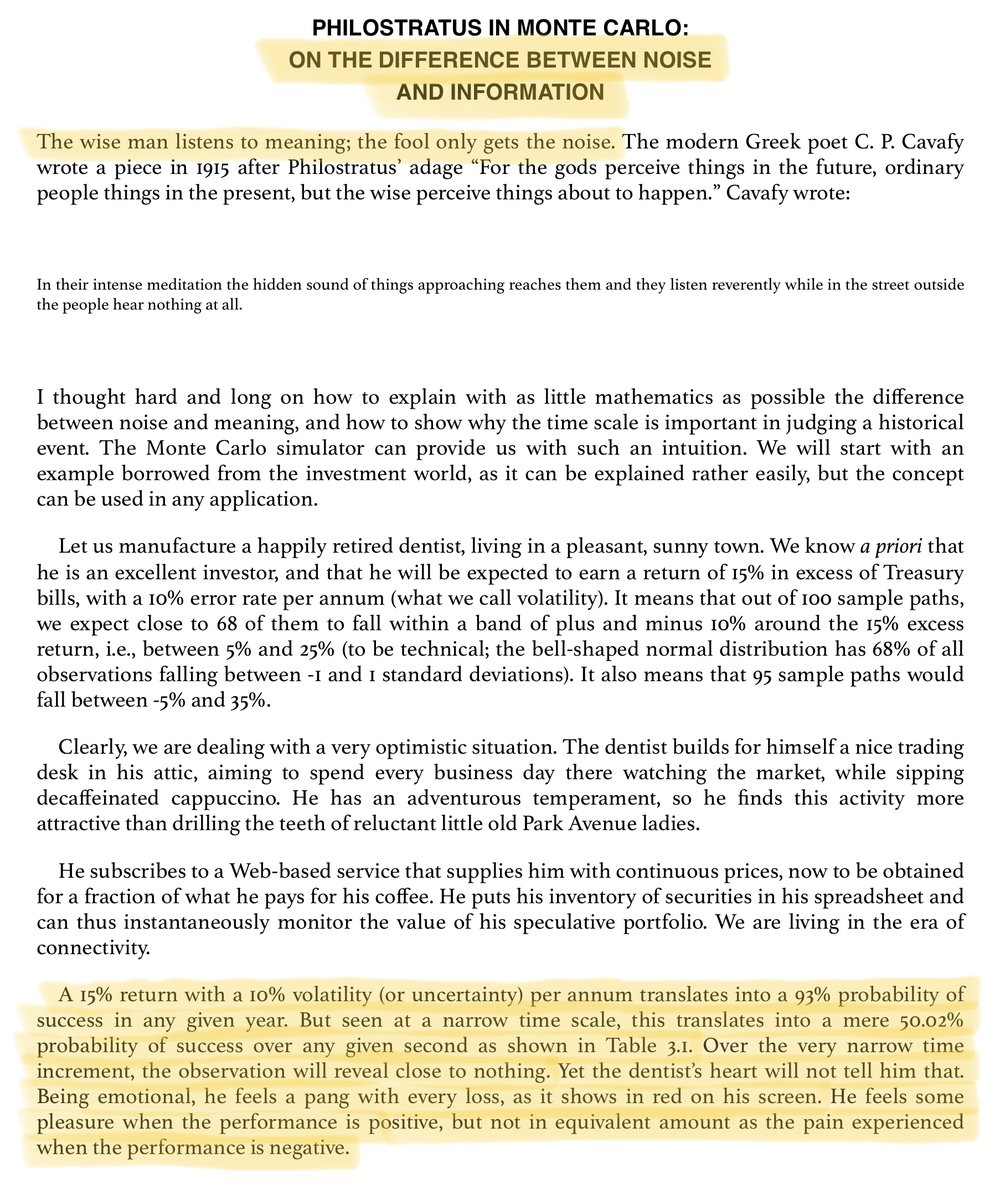
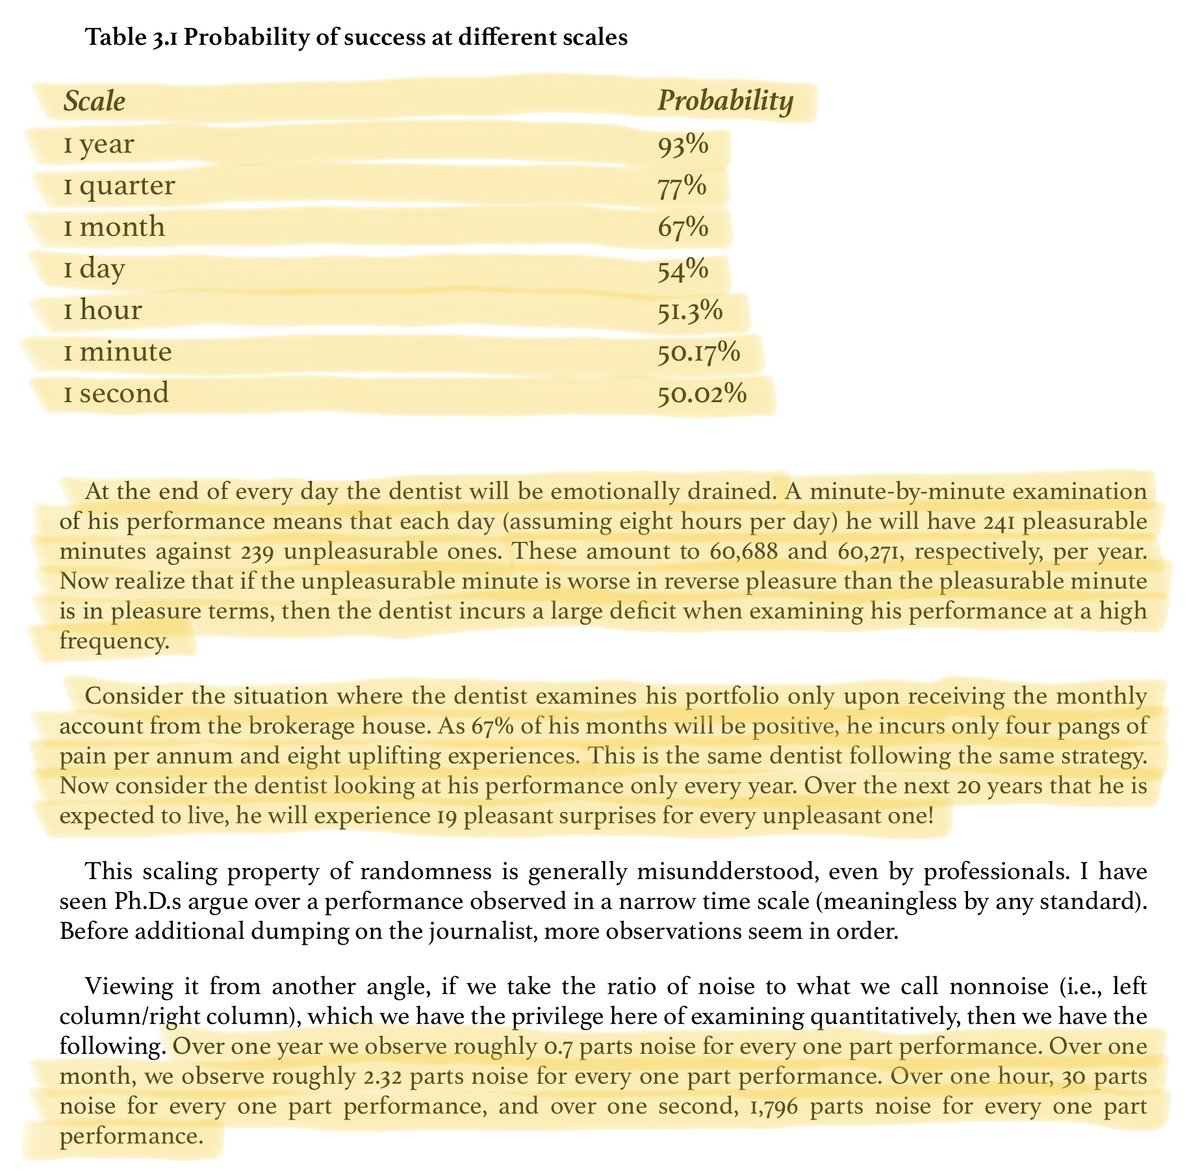
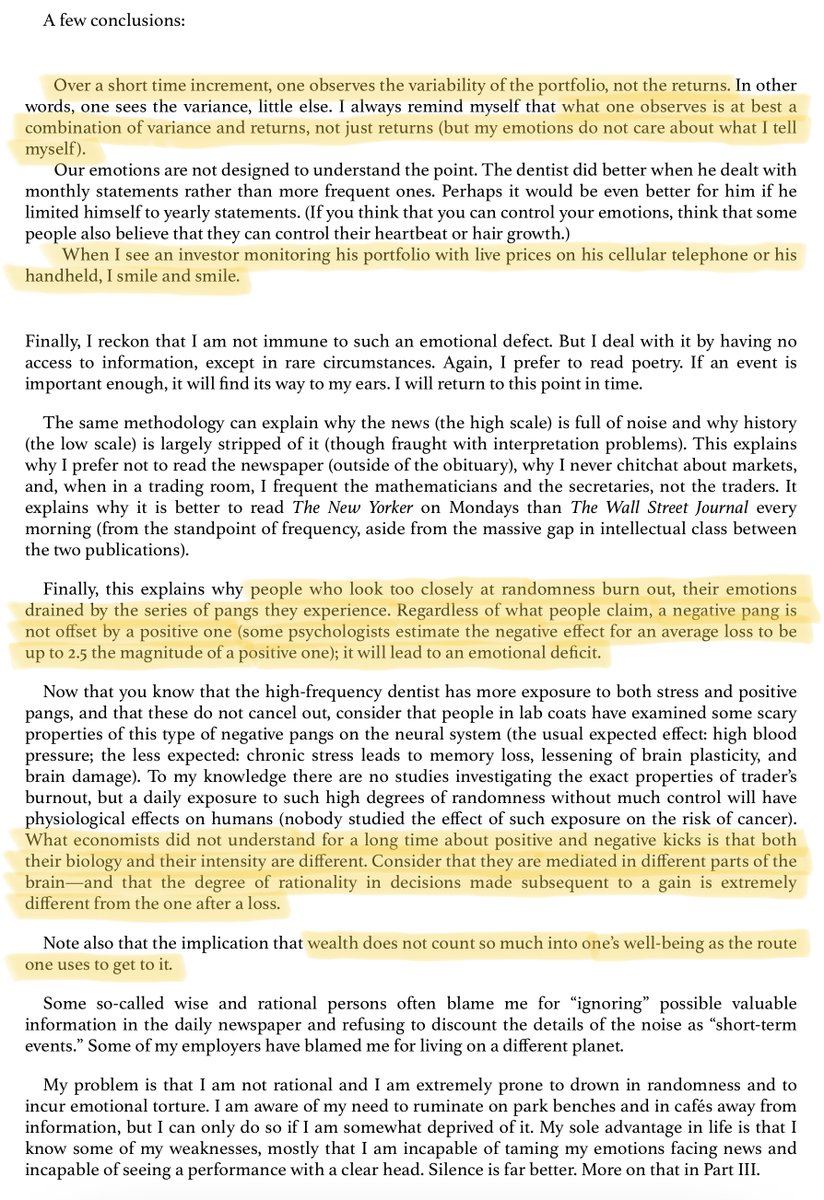
To learn more about the concepts in this thread, I recommend Nassim Taleb's Fooled By Randomness -- a wonderful book about how the principles of probability apply to investing and life in general.
Here's a relevant extract from the book (h/t @nntaleb):
To learn more about the concepts in this thread, I recommend Nassim Taleb's Fooled By Randomness -- a wonderful book about how the principles of probability apply to investing and life in general.
Here's a relevant extract from the book (h/t @nntaleb):
37/
If you want to learn more about Claude Shannon and his many inventions (including Information Theory), I recommend this lovely book -- A Mind At Play -- written by my friend @jimmyasoni.
Link: amazon.com
If you want to learn more about Claude Shannon and his many inventions (including Information Theory), I recommend this lovely book -- A Mind At Play -- written by my friend @jimmyasoni.
Link: amazon.com

38/
If you want a more technical introduction to signals and systems, entropy, and Information Theory, this textbook by Cover and Thomas is excellent:
amazon.com
If you want a more technical introduction to signals and systems, entropy, and Information Theory, this textbook by Cover and Thomas is excellent:
amazon.com

39/
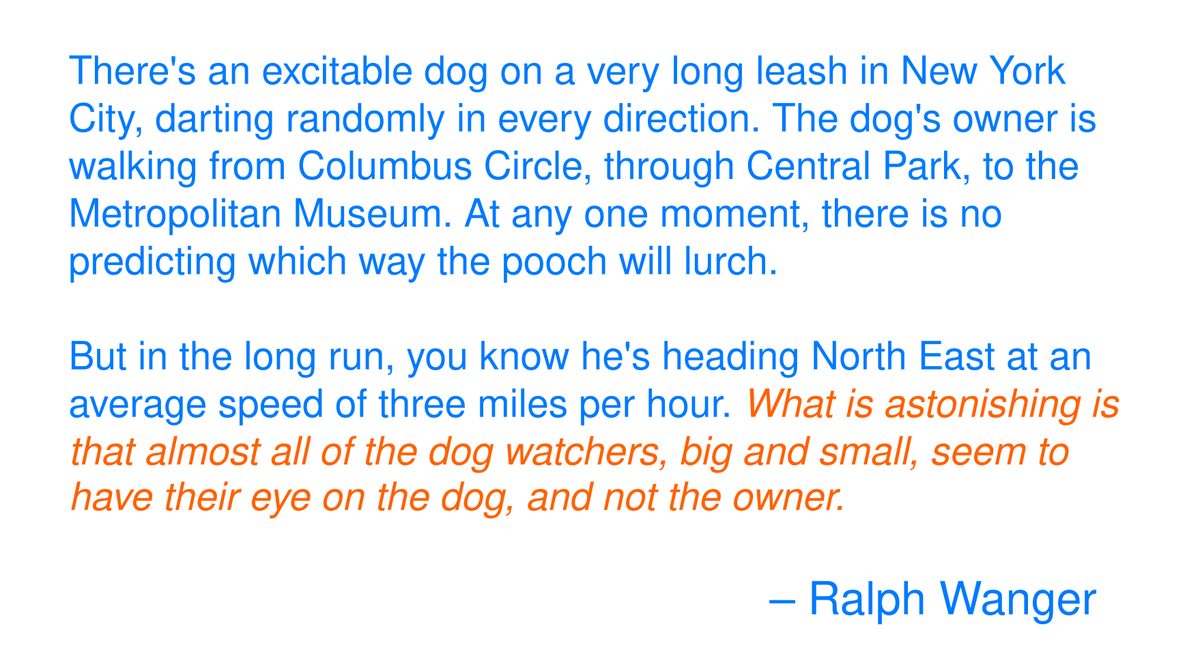
I'd like to leave you with this final quote that beautifully captures why we should focus on business fundamentals (ie, "signals") instead of obsessing about stock prices (ie, "noise"):
I'd like to leave you with this final quote that beautifully captures why we should focus on business fundamentals (ie, "signals") instead of obsessing about stock prices (ie, "noise"):
40/
If you're still with me, thank you very much.
Please stay safe, and enjoy your weekend!
/End
If you're still with me, thank you very much.
Please stay safe, and enjoy your weekend!
/End
Loading suggestions...