

Quants ❤️ statistical arbitrage.
Pairs trading is a great way to get started with algorithmic trading.
Here’s how to build a pairs trading strategy in Python.
Step by step:
Pairs trading is a great way to get started with algorithmic trading.
Here’s how to build a pairs trading strategy in Python.
Step by step:
By replicating this framework, you’ll be able to:
1. Get stock price data
2. Find cointegrated pairs
3. Model the spread
4. Trade the strategy
What is pairs trading anyway?
1. Get stock price data
2. Find cointegrated pairs
3. Model the spread
4. Trade the strategy
What is pairs trading anyway?
Pairs trading is a way of trading an economic relationship between two stocks.
Two companieswith the same supply chain will be impacted by the same economic forces.
Pairs trading tries to model that relationship and make money when the relationship temporarily breaks down.
Two companieswith the same supply chain will be impacted by the same economic forces.
Pairs trading tries to model that relationship and make money when the relationship temporarily breaks down.
Start by importing the libraries. statsmodels is a package used to build statistical models like linear regression and tests for cointegration.
seaborn is a plotting library.
seaborn is a plotting library.

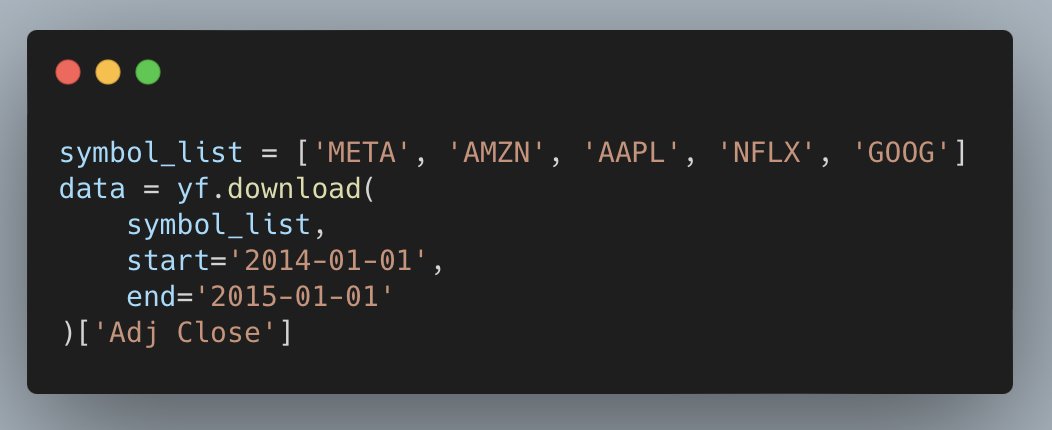
Next get the data.
Picking the pairs to test is the secret behind a good pairs trading strategy.
For this example I just use the FAANG stocks.
Picking the pairs to test is the secret behind a good pairs trading strategy.
For this example I just use the FAANG stocks.
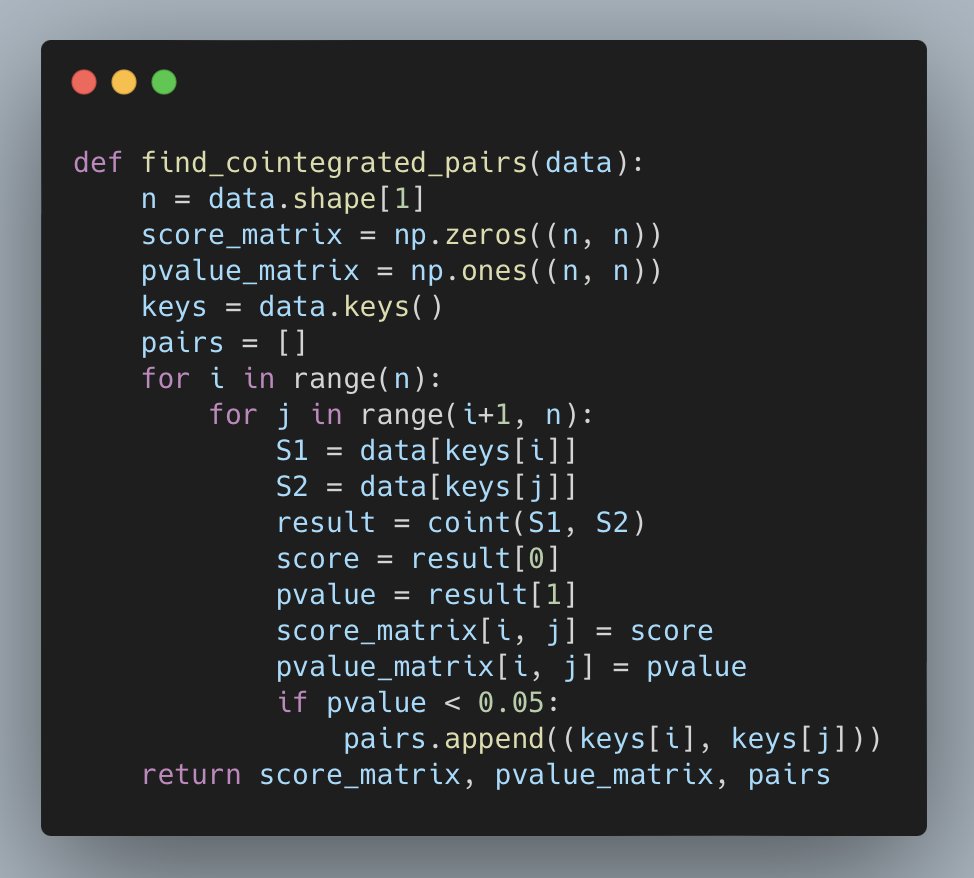
The next step is to loop through the different combinations of pairs to test if they’re co-integrated.
In practice, traders will design buckets of stocks based on economic rationale.
In practice, traders will design buckets of stocks based on economic rationale.
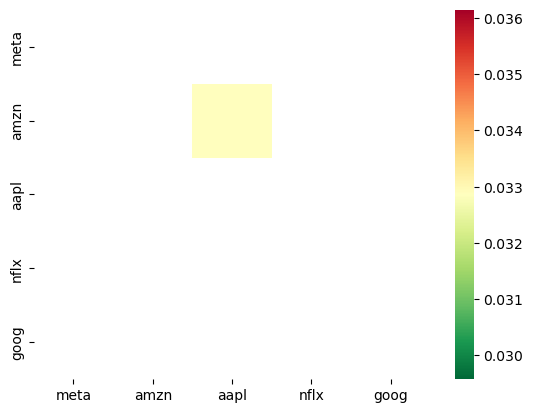
Next, run the function on your data and plot the results.
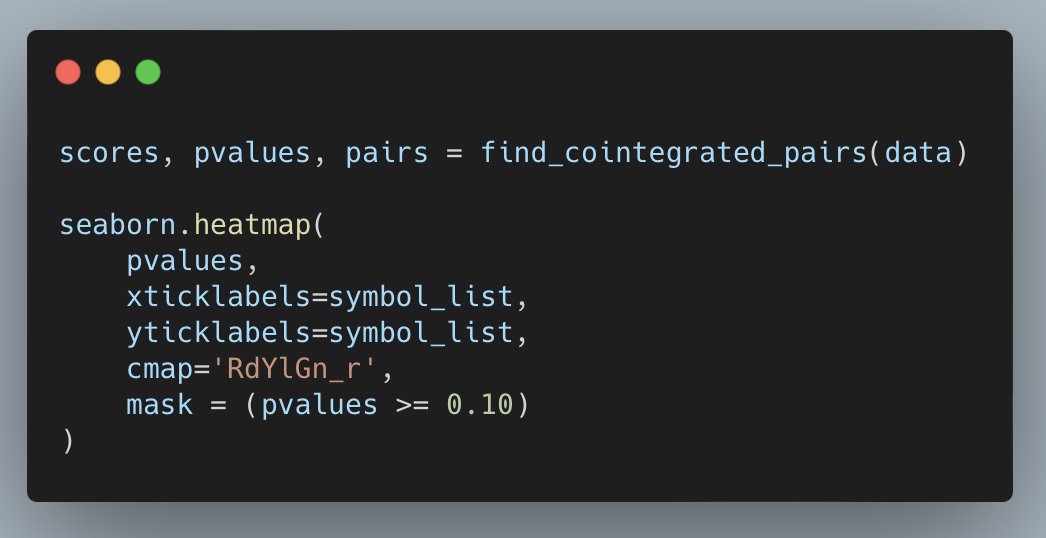
It looks like AMZN and AAPL are co-integrated!
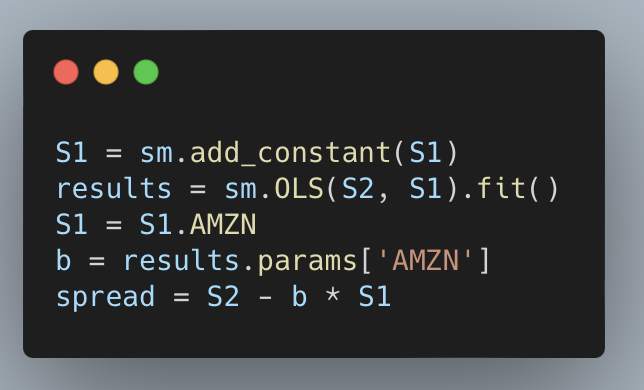
The next step is to run a linear regression using statsmodels and model the spread as a linear combination of AAPL and AMZN.
The next step is to run a linear regression using statsmodels and model the spread as a linear combination of AAPL and AMZN.
b is the beta coefficient from the linear regression, otherwise known as the “hedge ratio.”
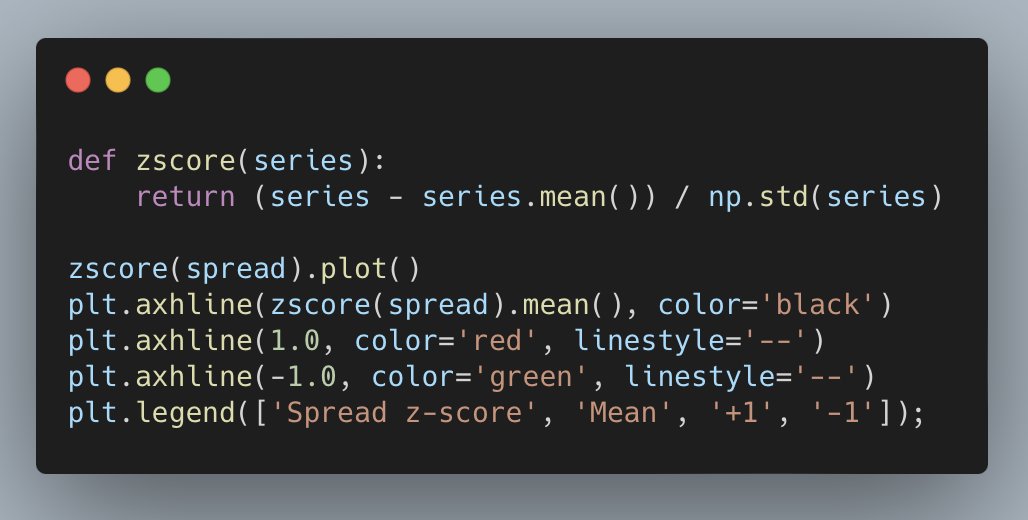
You buy the spread when it gets “too low” and sell the spread when it gets “too high.”
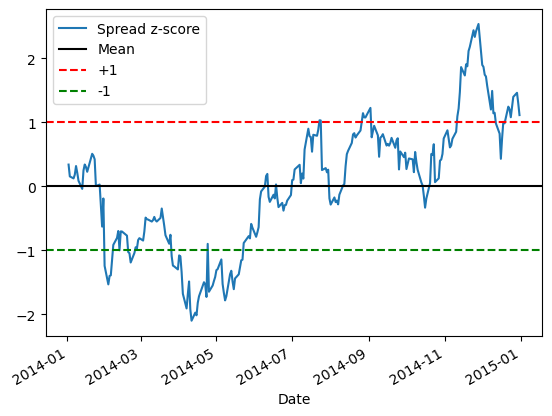
But what is too low and too high? Use the z-score to normalize the spread and use it as the trade signal.
But what is too low and too high? Use the z-score to normalize the spread and use it as the trade signal.
If you buy the pair, you buy AAPL and sell b shares of AMZN. If you’re sell the pair, you sell AAPL and buy b shares of AMZN.
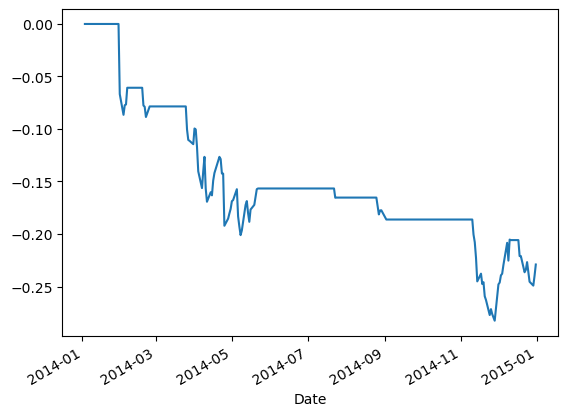
Next, estimate the equity curve of buying and selling the pair.
Create a DataFrame with the signal and the position in the pair.
Populate it with a 1 when the signal is less than or equal to -1 and -1 when the signal is greater than or equal to 1.
Create a DataFrame with the signal and the position in the pair.
Populate it with a 1 when the signal is less than or equal to -1 and -1 when the signal is greater than or equal to 1.

This pair is consistently losing money:
• No linear combination that is stationary and we have a false positive
• No real economic relationship that drives the two stocks
• The relationship broke down during frame you used
Try a different time frame or a different pair.
• No linear combination that is stationary and we have a false positive
• No real economic relationship that drives the two stocks
• The relationship broke down during frame you used
Try a different time frame or a different pair.
Get started with statistical arbitrage by building a pairs trading strategy in Python:
1. Get stock price data
2. Find cointegrated pairs
3. Model the spread
4. Trade the strategy
1. Get stock price data
2. Find cointegrated pairs
3. Model the spread
4. Trade the strategy
That's a wrap!
If you enjoyed this thread:
1. Follow me @pyquantnews for more of these
2. RT the tweet below to share this thread with your audience
If you enjoyed this thread:
1. Follow me @pyquantnews for more of these
2. RT the tweet below to share this thread with your audience
If you like Tweets about trading, you might enjoy my weekly newsletter: The PyQuant Newsletter.
Real Python code for quant finance you can use now.
Join 7,800+ subscribers who are taking action with Python.
pyquantnews.com
Real Python code for quant finance you can use now.
Join 7,800+ subscribers who are taking action with Python.
pyquantnews.com
Loading suggestions...