

How to Trade Trending Markets!
Using Tools Like👇
1- Trendlines
2- Bollinger Band
3- Moving Average
4- ADX
A Master Thread!👇🧵
Using Tools Like👇
1- Trendlines
2- Bollinger Band
3- Moving Average
4- ADX
A Master Thread!👇🧵
(1) Trendlines
A moving market has one-way prices.
The price may sometimes move against trend, but longer time frames signify such are retracements.
Trends are usually noted by “higher highs” and “higher lows” in an uptrend and “lower highs” and “lower lows” in a downtrend.
A moving market has one-way prices.
The price may sometimes move against trend, but longer time frames signify such are retracements.
Trends are usually noted by “higher highs” and “higher lows” in an uptrend and “lower highs” and “lower lows” in a downtrend.

(2) Bollinger Band in Trending Market!
Bollinger Bands include the formula for standard deviation. Don't bother about being a geek and determining what it is.
Here's how we can identify the trend using Bollinger Bands! Prepare for the madness.
Bollinger Bands include the formula for standard deviation. Don't bother about being a geek and determining what it is.
Here's how we can identify the trend using Bollinger Bands! Prepare for the madness.
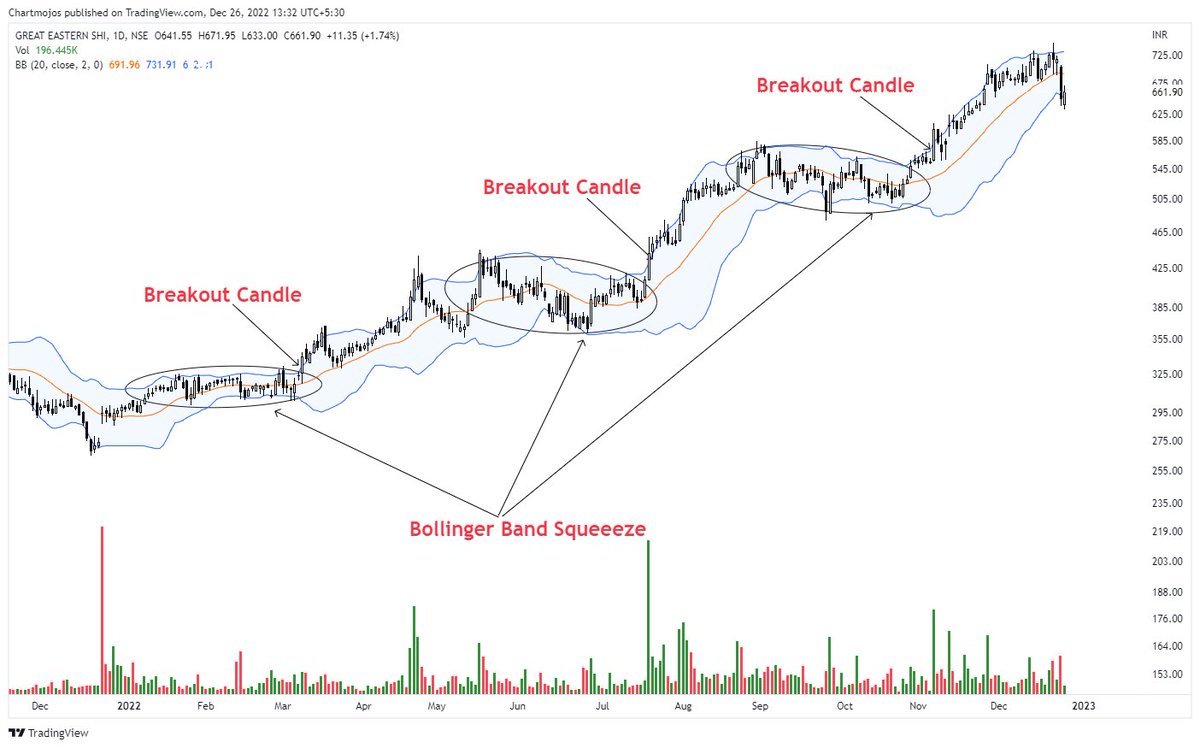
Place Bollinger Bands on your charts!
Look for BB Squeeze and than a breakout form it.
you can look at below mentioned chart, how the price scaled up after breaking from every BB Squeeze.
Look for BB Squeeze and than a breakout form it.
you can look at below mentioned chart, how the price scaled up after breaking from every BB Squeeze.
(3)Moving Average in Trending Market.
If you don't like the ADX (which is mentioned in 4th point), you may alternatively use exponential moving averages.
Look at this!
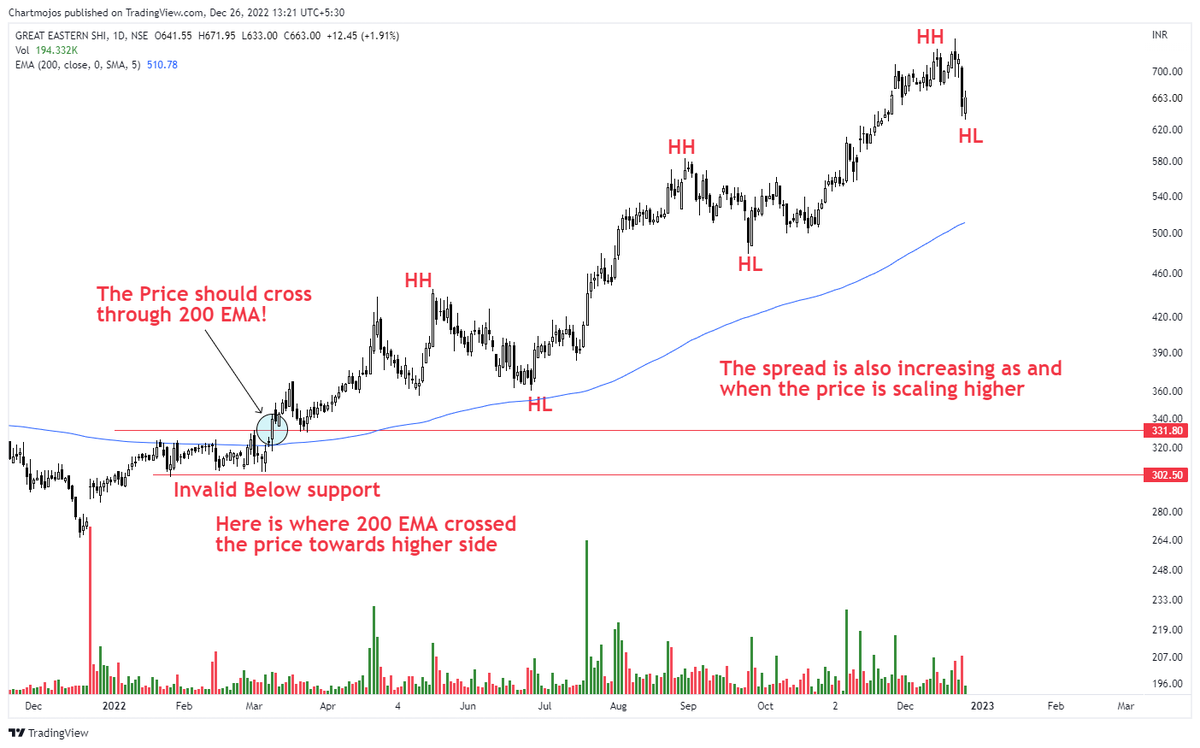
Place 200 EMA on your chart!
Then, wait until the price crosses through 200 EMA and begin to drift higher.
If you don't like the ADX (which is mentioned in 4th point), you may alternatively use exponential moving averages.
Look at this!
Place 200 EMA on your chart!
Then, wait until the price crosses through 200 EMA and begin to drift higher.
(4) ADX in Trending Market
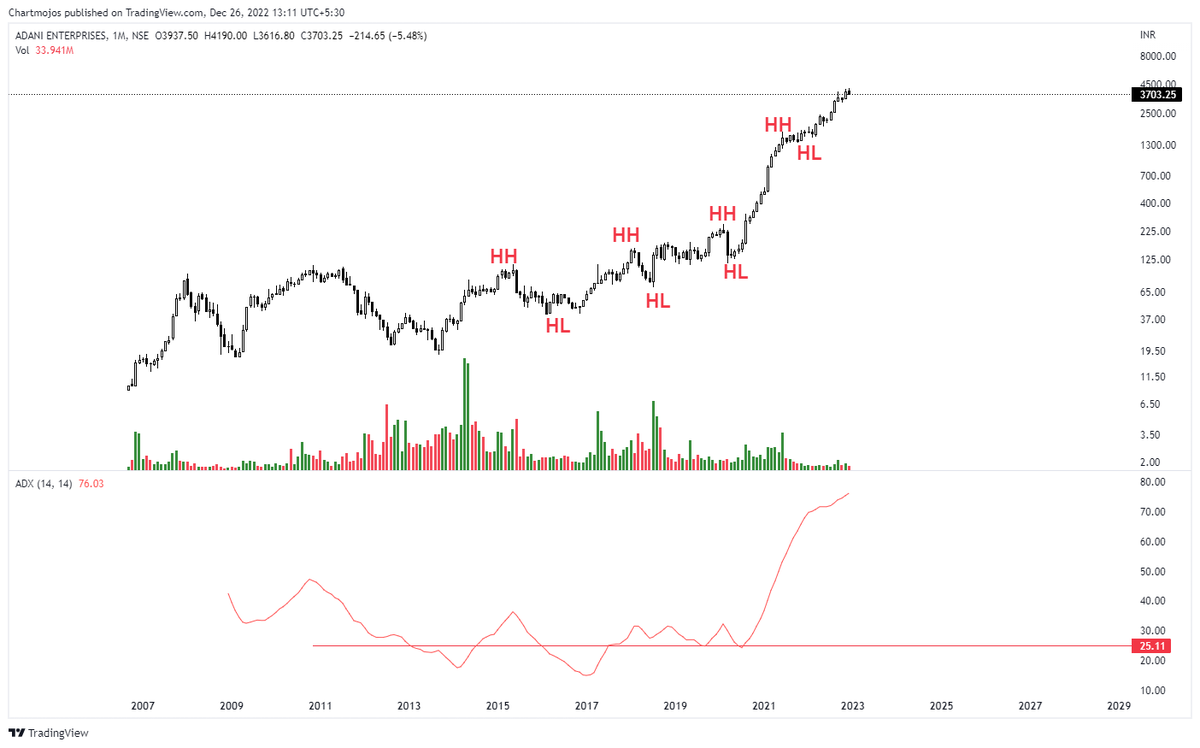
The Average Directional Index, or ADX, is a way to tell if the market is moving in a certain direction.
When the value is more than 25, it is indicative that the price is either about to enter a trend or is currently in a strong trend.
The Average Directional Index, or ADX, is a way to tell if the market is moving in a certain direction.
When the value is more than 25, it is indicative that the price is either about to enter a trend or is currently in a strong trend.
The higher the number is, the stronger the trend.
The ADX, however, is a lagging indicator, therefore it cannot guarantee accurate forecasting.
(You can also try ADX with stocks which are in a strong uptrend).
Example of Adani Ent!
The ADX, however, is a lagging indicator, therefore it cannot guarantee accurate forecasting.
(You can also try ADX with stocks which are in a strong uptrend).
Example of Adani Ent!
if you found this worthwhile and do spread word about it and help us educate more beginners and fellow traders.
Happy Reading!
Happy Reading!
Loading suggestions...