
Economics
Finance
Financial Markets
Market Analysis
Investment
Investments
Economic Analysis
Economic Outlook

22 Charts for 2022
A year in review and a mega thread!🧵plus a link to the entire piece is here (and keep an eye out for our 23 outlook soon!): newedgewealth.com
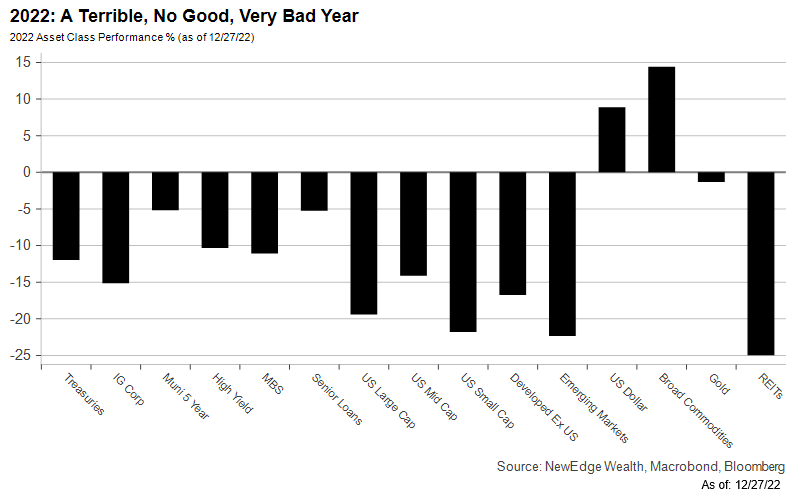
1. A terrible, no good, very bad year:
Nearly all asset classes experienced pronounced weakness in 2022.
A year in review and a mega thread!🧵plus a link to the entire piece is here (and keep an eye out for our 23 outlook soon!): newedgewealth.com
1. A terrible, no good, very bad year:
Nearly all asset classes experienced pronounced weakness in 2022.

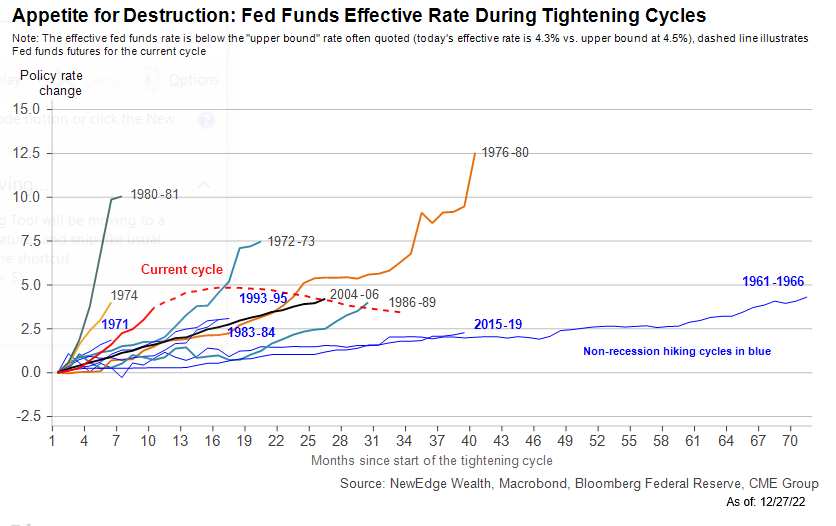
2. Appetite for Destruction:
The most rapid tightening cycle by the Fed since the early 80's.
(Note this chart shows the Effective Fed Funds rate through Nov-22).
The most rapid tightening cycle by the Fed since the early 80's.
(Note this chart shows the Effective Fed Funds rate through Nov-22).
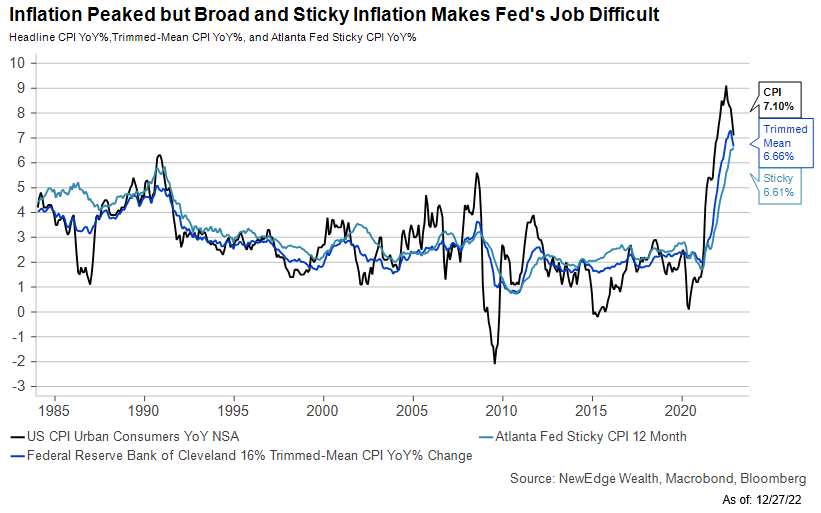
3. Transitioning From Transitory:
Rapid tightening was due to the Fed playing catchup to soaring inflation. Headline inflation peaked in mid-22, while important measures of inflation breadth (trimmed mean) and stickiness remain well above the Fed's 2% target.
Rapid tightening was due to the Fed playing catchup to soaring inflation. Headline inflation peaked in mid-22, while important measures of inflation breadth (trimmed mean) and stickiness remain well above the Fed's 2% target.
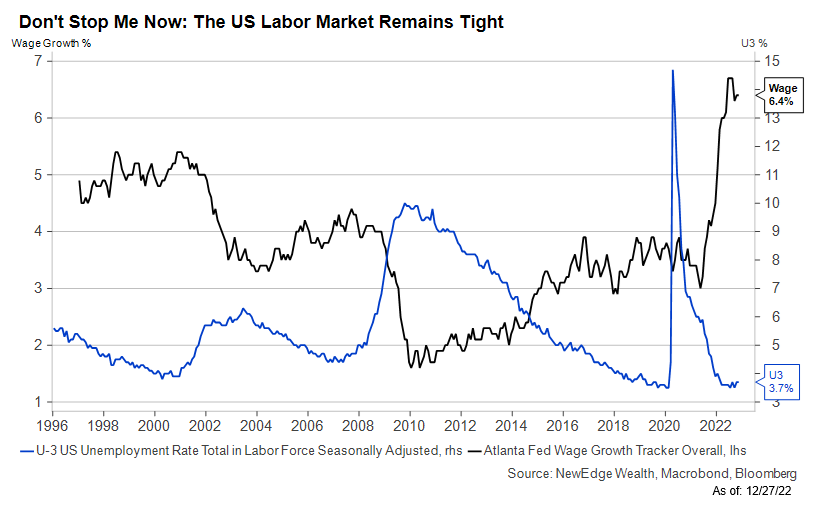
4. Don’t Stop Me Now:
Despite Fed hikes, the US labor market ends 2022 just about as tight as it started. Unemployment is near 50-year lows at 3.7%, wage growth is still running hot at +6.4%, and there are still 1.7 jobs per unemployed worker.
Despite Fed hikes, the US labor market ends 2022 just about as tight as it started. Unemployment is near 50-year lows at 3.7%, wage growth is still running hot at +6.4%, and there are still 1.7 jobs per unemployed worker.
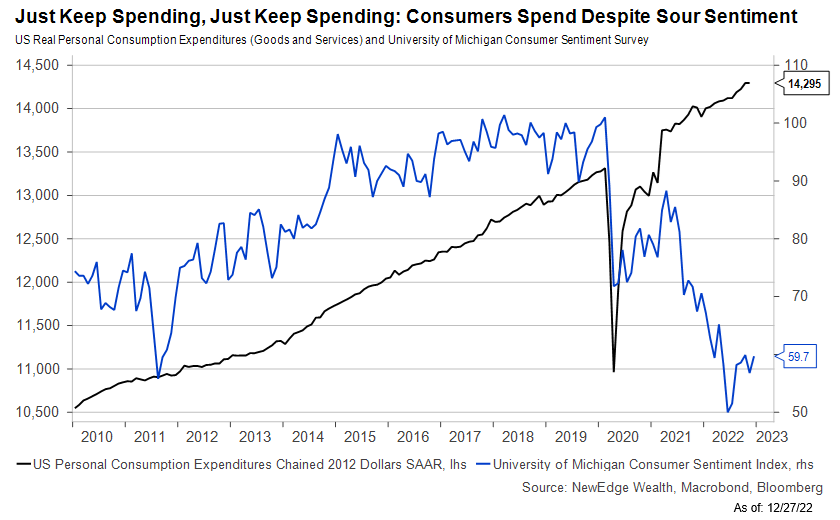
5. Just Keep Spending, Just Keep Spending:
Consumer sentiment was abysmal all throughout 22. Despite feeling awful, consumers continued to spend in 22, supported by the strong jobs market, wage gains, spending down of pandemic savings, and falling energy prices in 2H22.
Consumer sentiment was abysmal all throughout 22. Despite feeling awful, consumers continued to spend in 22, supported by the strong jobs market, wage gains, spending down of pandemic savings, and falling energy prices in 2H22.
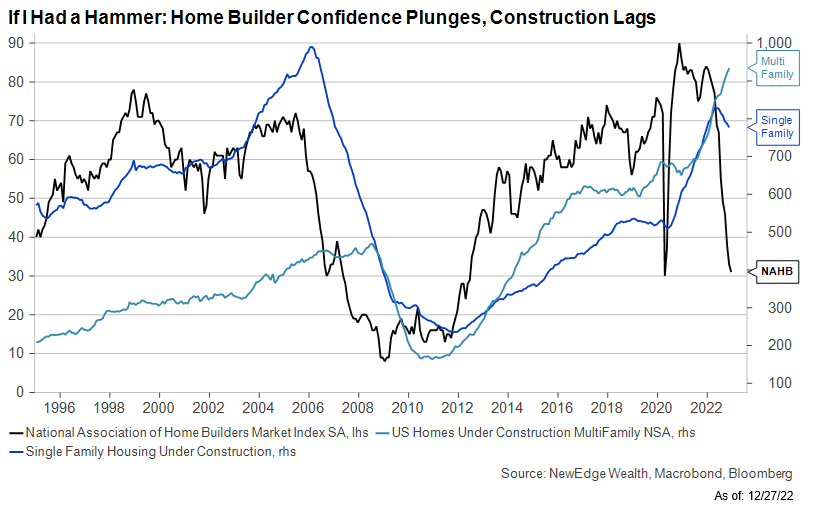
6. If I Had a Hammer:
As mortgage rates soared in 22, and housing activity slowed materially, home builders’ assessment of market conditions plunged, but construction remained firm. This is an example of the time it takes rate hikes to work their way through to the real economy.
As mortgage rates soared in 22, and housing activity slowed materially, home builders’ assessment of market conditions plunged, but construction remained firm. This is an example of the time it takes rate hikes to work their way through to the real economy.
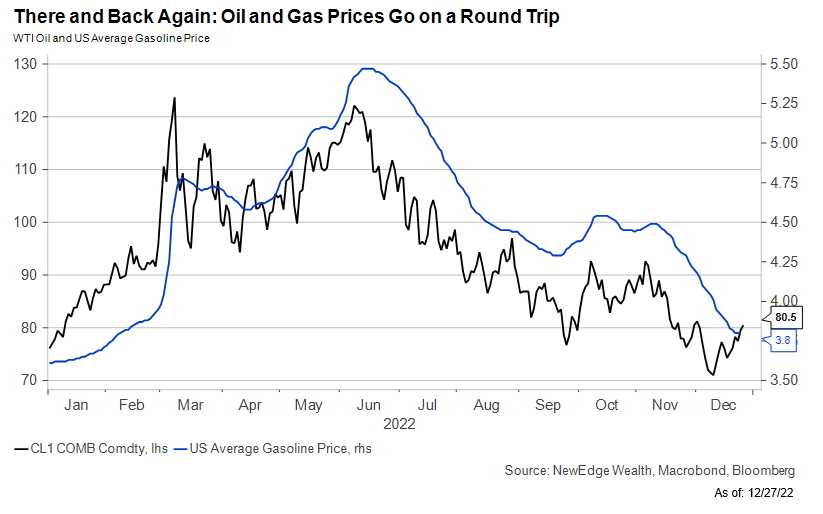
7. There and Back Again:
The first half of 22 saw soaring oil and gas prices, but come summer, these prices peaked and proceeded to roundtrip the majority of the early 22 gains. This contributed to moderating inflation and improved consumer sentiment in the second half of 22
The first half of 22 saw soaring oil and gas prices, but come summer, these prices peaked and proceeded to roundtrip the majority of the early 22 gains. This contributed to moderating inflation and improved consumer sentiment in the second half of 22
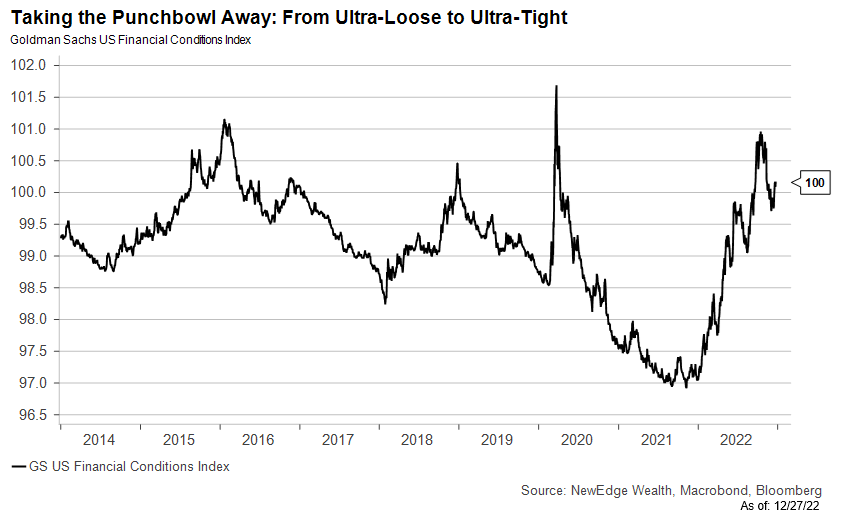
8. Taking the Punchbowl Away:
Financial conditions tightened materially. 22 started with ultra-loose financial conditions (the Fed was still stimulating even as inflation and growth were running hot) and ended with financial conditions near prior peaks of tightness (16, 18, 20).
Financial conditions tightened materially. 22 started with ultra-loose financial conditions (the Fed was still stimulating even as inflation and growth were running hot) and ended with financial conditions near prior peaks of tightness (16, 18, 20).
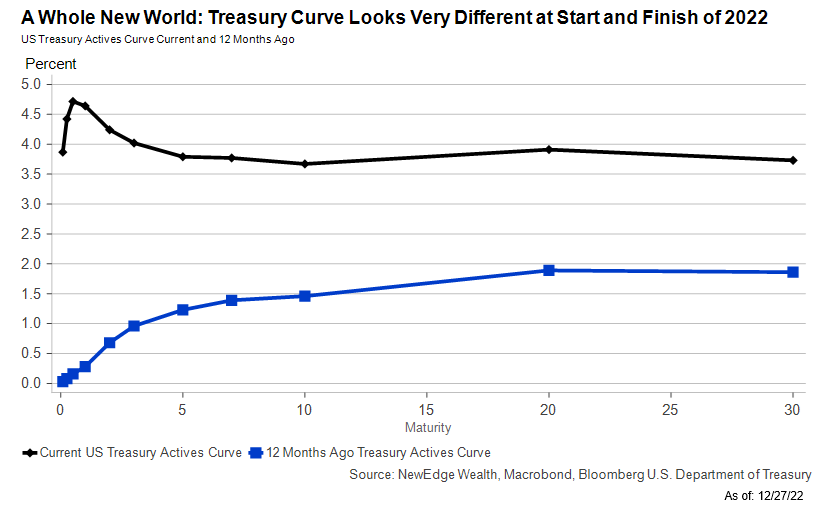
9. A Whole New World:
The Treasury curve shifted materially in 2022. The biggest moves were in the front end of the curve, which is most sensitive to Fed policy. You can almost hear the 2-year, “I’m like a shooting star, I’ve come so far, I can’t go back to where I used to be”
The Treasury curve shifted materially in 2022. The biggest moves were in the front end of the curve, which is most sensitive to Fed policy. You can almost hear the 2-year, “I’m like a shooting star, I’ve come so far, I can’t go back to where I used to be”
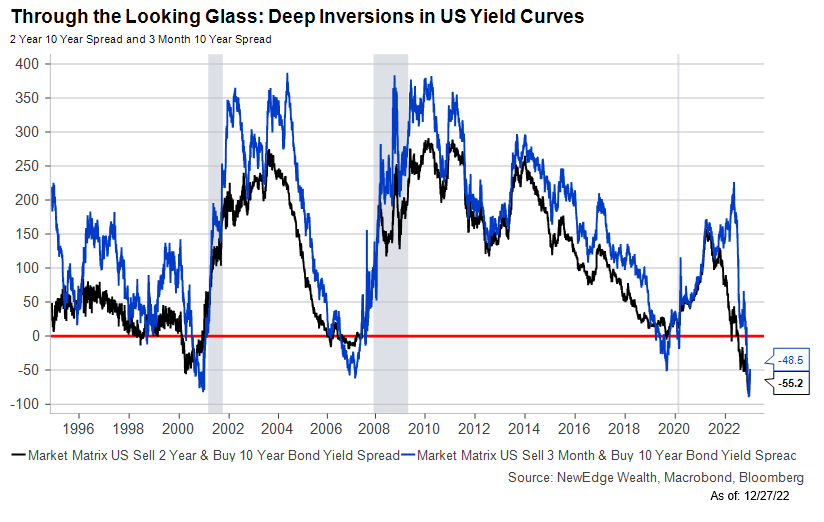
10. Through the Looking Glass:
Exiting 2022, the yield curve is deeply inverted (meaning short yields are higher than long yields), flashing a warning sign of potential economic weakness on the horizon (though it doesn't help with timing of that weakness).
Exiting 2022, the yield curve is deeply inverted (meaning short yields are higher than long yields), flashing a warning sign of potential economic weakness on the horizon (though it doesn't help with timing of that weakness).
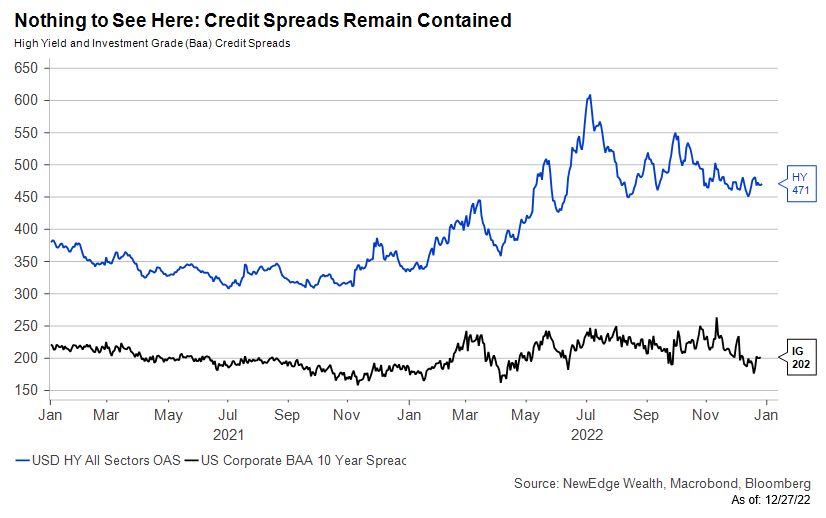
11. Nothing to See Here
Despite the inverted yield curve and widespread fears about an impending recession, credit spreads have remained contained in 22 thanks to limited supply, better corporate credit health, better eco data, and high all-in yields.
Despite the inverted yield curve and widespread fears about an impending recession, credit spreads have remained contained in 22 thanks to limited supply, better corporate credit health, better eco data, and high all-in yields.
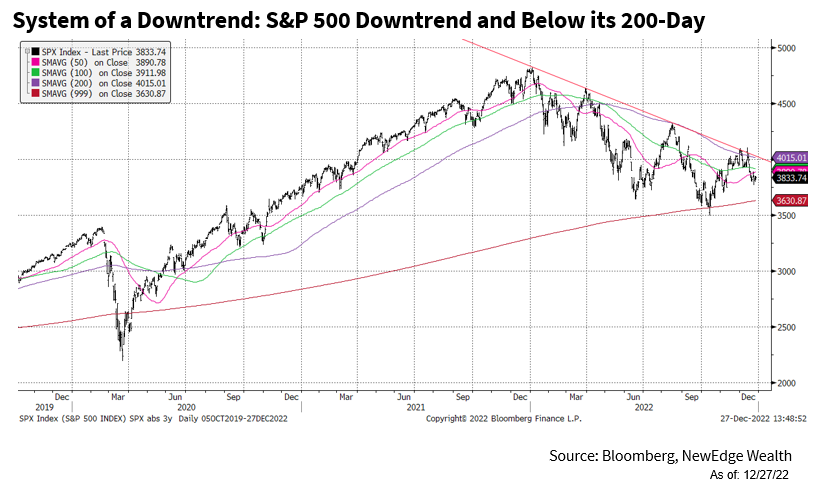
12. System of a Downtrend
US equities swiftly got off to a weak start in 2022, with the S&P 500 forming a distinct downtrend of lower highs and lower lows, with sharp bear market rallies along the way. Note the support that held ~3500 at the 200-week moving average (for now?).
US equities swiftly got off to a weak start in 2022, with the S&P 500 forming a distinct downtrend of lower highs and lower lows, with sharp bear market rallies along the way. Note the support that held ~3500 at the 200-week moving average (for now?).
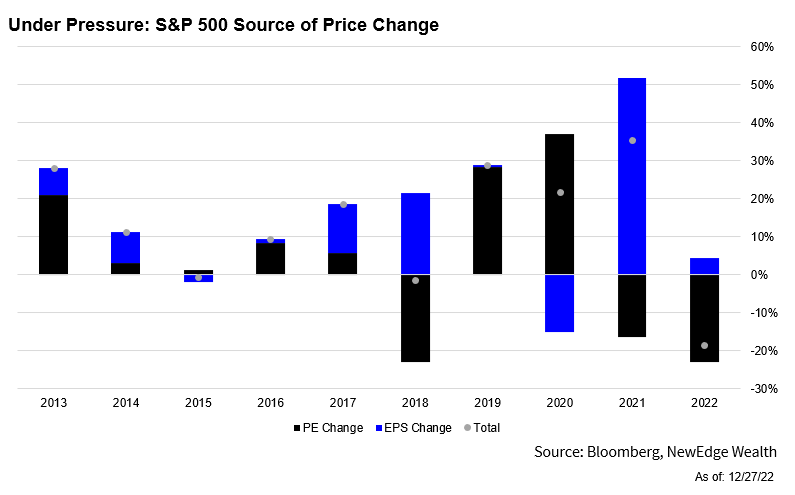
13. Under Pressure
The source of the S&P 500’s downside in 2022 was entirely due to a decline in the index’s PE multiple (valuation multiple compression), as earnings grew slightly in 2022. PEs started 22 high so there was plenty of room to fall as interest rates rose.
The source of the S&P 500’s downside in 2022 was entirely due to a decline in the index’s PE multiple (valuation multiple compression), as earnings grew slightly in 2022. PEs started 22 high so there was plenty of room to fall as interest rates rose.
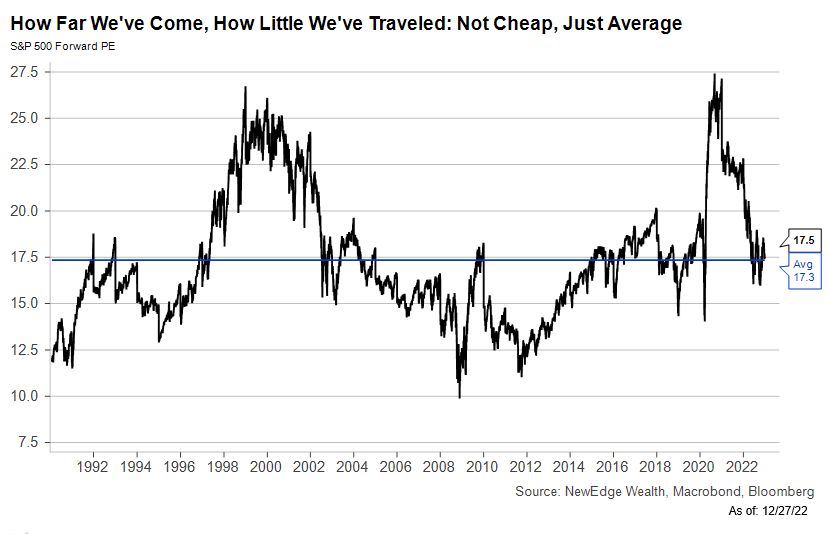
14. How Far We’ve Come, How Little We’ve Traveled:
For as much turmoil as investors experienced in 2022, we’ve made surprisingly little progress toward the S&P becoming “cheap”. Current valuations, though down from the 2020/2021 bubble highs, are now just in line with the average
For as much turmoil as investors experienced in 2022, we’ve made surprisingly little progress toward the S&P becoming “cheap”. Current valuations, though down from the 2020/2021 bubble highs, are now just in line with the average
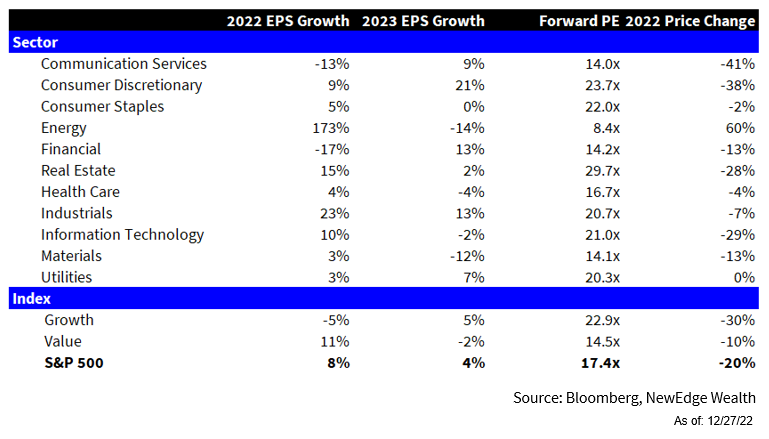
15. If You Ain’t First, You’re Last:
Energy was the one and only sector that delivered a positive price return in 2022, +60% for the year. The dispersion in returns was incredible, with the spread between the best (Energy) and worst (Communication Services) an eye-popping 100%!
Energy was the one and only sector that delivered a positive price return in 2022, +60% for the year. The dispersion in returns was incredible, with the spread between the best (Energy) and worst (Communication Services) an eye-popping 100%!
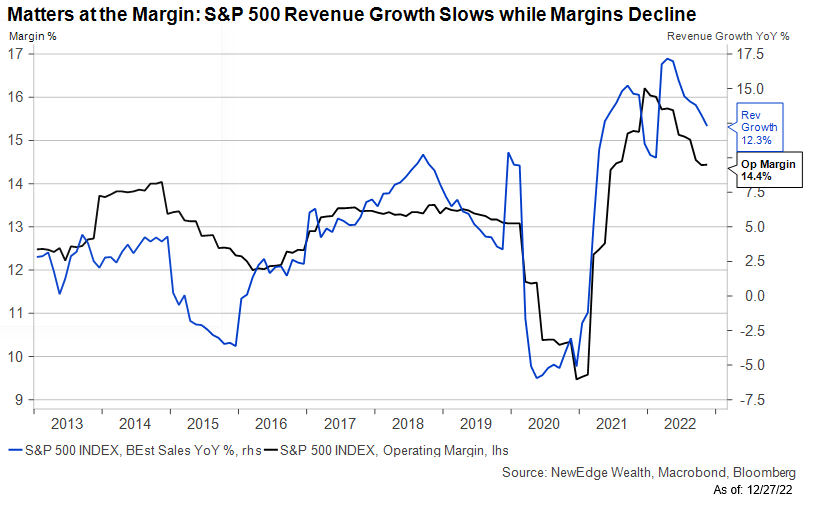
16. Matters at the Margin
22 saw S&P 500 revenues climb to a new all-time high with robust low-teens growth, but margins fell over the course of the year (margins were the source of downside earnings revisions in 2022). Further margin declines are a key risk to 23 EPS.
22 saw S&P 500 revenues climb to a new all-time high with robust low-teens growth, but margins fell over the course of the year (margins were the source of downside earnings revisions in 2022). Further margin declines are a key risk to 23 EPS.
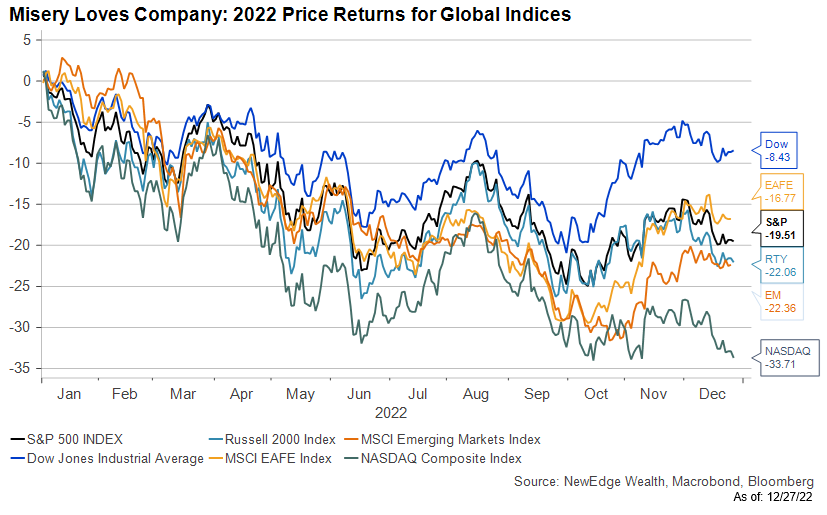
17. Misery Loves Company:
All major global stock indices fell in 2022, with the worst decline experienced by the NASDAQ Composite (had the highest valuation going into 2022), while lower valuation areas like the value-oriented Dow and cheaper int'l dev and EM indices fared better
All major global stock indices fell in 2022, with the worst decline experienced by the NASDAQ Composite (had the highest valuation going into 2022), while lower valuation areas like the value-oriented Dow and cheaper int'l dev and EM indices fared better
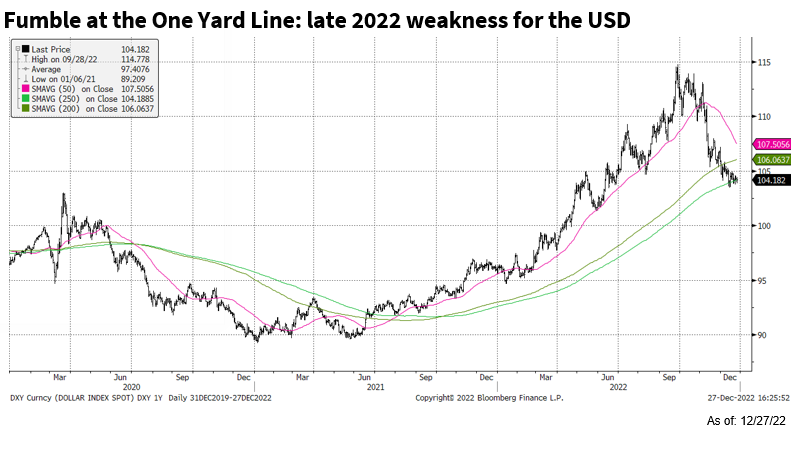
18. Fumble at the One Yard Line
The USD staged a powerful rally throughout 22 until November when the currency experienced a rapid and pronounced sell off (boosting shares of non-US stocks). The USD has found support at its 50-week moving average (shown here as the 250-day).
The USD staged a powerful rally throughout 22 until November when the currency experienced a rapid and pronounced sell off (boosting shares of non-US stocks). The USD has found support at its 50-week moving average (shown here as the 250-day).
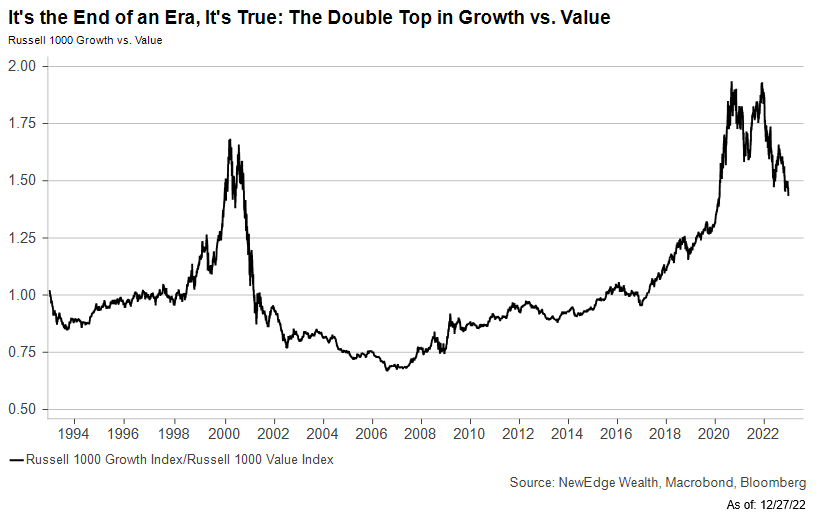
19. It’s the End of an Era, It’s True:
Similar to the underperformance NASDAQ Composite vs. the Dow Jones Industrial Average, Growth significantly underperformed value in 2022 as the COVID growth bubble popped and valuations fell back towards earth.
Similar to the underperformance NASDAQ Composite vs. the Dow Jones Industrial Average, Growth significantly underperformed value in 2022 as the COVID growth bubble popped and valuations fell back towards earth.
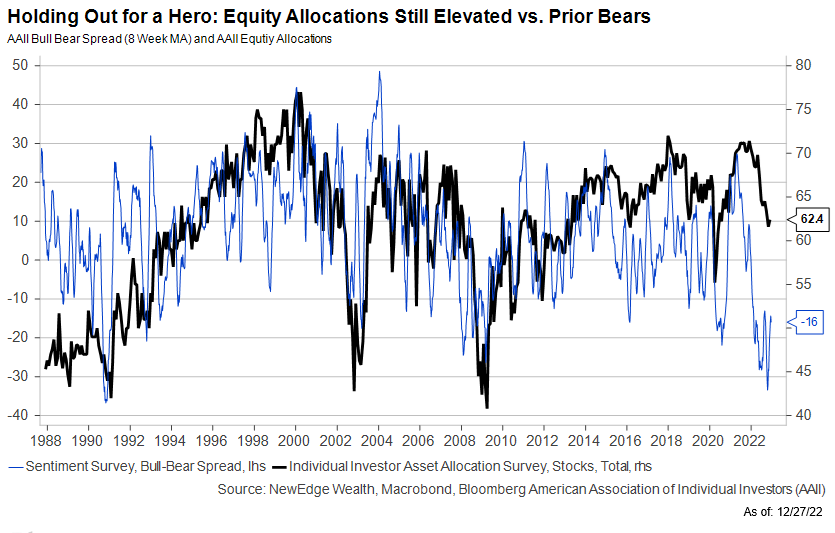
20. Holding Out for a Hero:
Despite terrible investor sentiment, individual investors were slow to reduce holdings in equities. Allocations to equities are off of the highs (down from 70% to 62% ) but remain well above prior major bear market lows (45-50% in 2001 and 2009).
Despite terrible investor sentiment, individual investors were slow to reduce holdings in equities. Allocations to equities are off of the highs (down from 70% to 62% ) but remain well above prior major bear market lows (45-50% in 2001 and 2009).
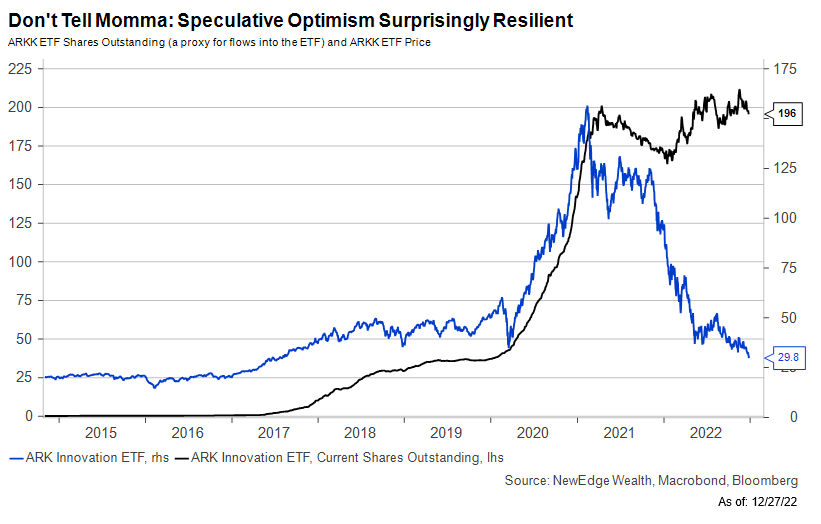
21. Don’t Tell Momma:
ARKK is one of the best proxies 20/21 valuation and speculative excesses. Despite weak performance (-85% from 2021 peak), there are now more shares outstanding in this ETF (a proxy for flows into the fund) than at the peak in 21 (unlike the IPO etf).
ARKK is one of the best proxies 20/21 valuation and speculative excesses. Despite weak performance (-85% from 2021 peak), there are now more shares outstanding in this ETF (a proxy for flows into the fund) than at the peak in 21 (unlike the IPO etf).
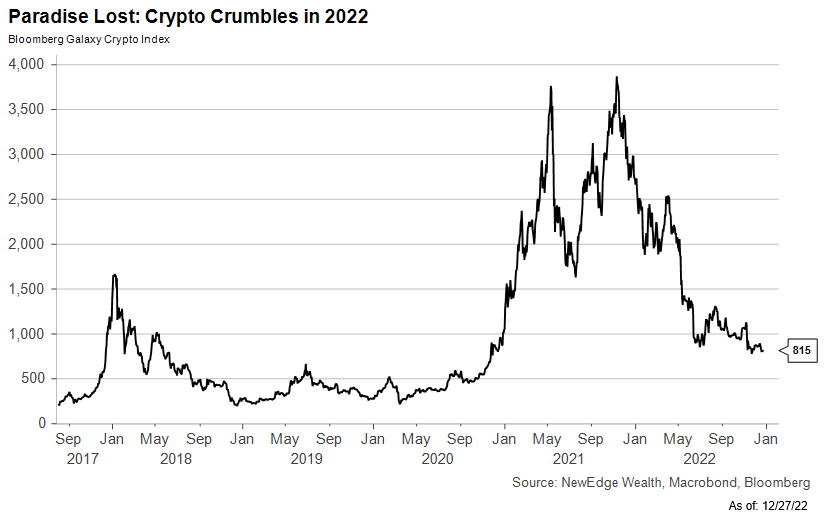
22. Paradise Lost:
Another expression of 20/21 speculative liquidity bubble, and 22s subsequent unwind, is crypto. The past three years in crypto are a harsh reminder that there can be great danger in ascribing narrative to price action.
Another expression of 20/21 speculative liquidity bubble, and 22s subsequent unwind, is crypto. The past three years in crypto are a harsh reminder that there can be great danger in ascribing narrative to price action.
Loading suggestions...