

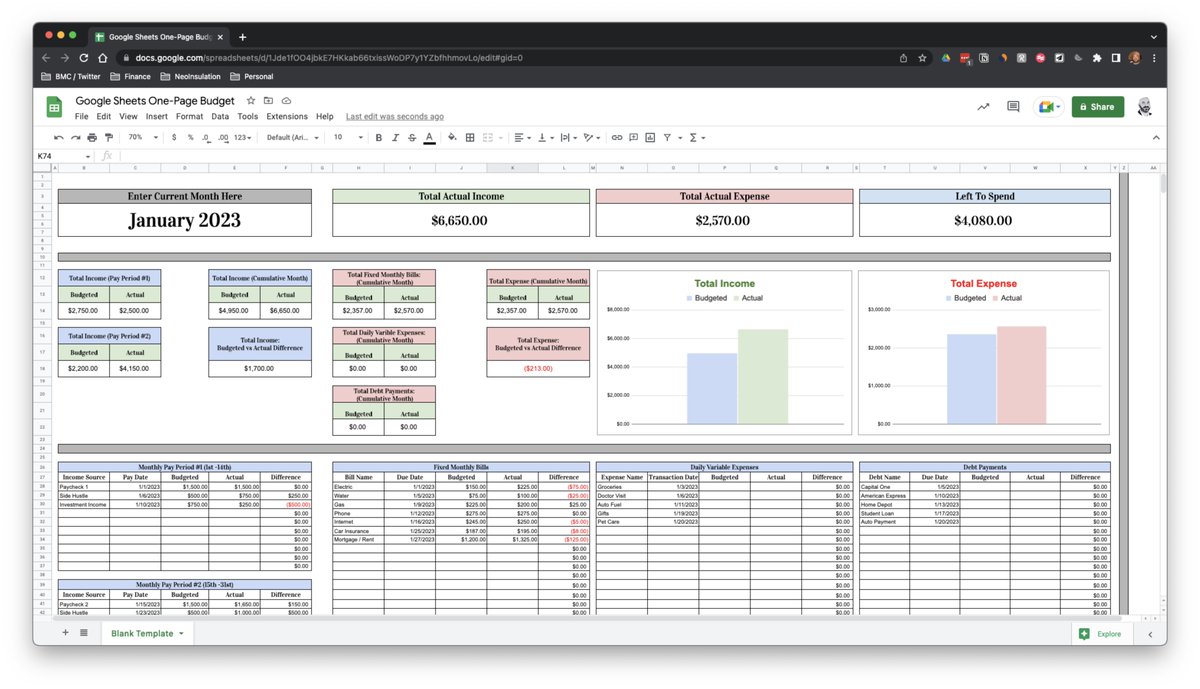
This week I built an easy-to-use "One Page Budget" planner in Google Sheets.
Here's a breakdown of how it works and a template you can use: 📊
Here's a breakdown of how it works and a template you can use: 📊
First off...
Some people want to know how the watch is made, others just want to know what time it is.
If you'd like to jump ahead & grab the template, go to the end of this thread.
You'll find Excel & G-Sheet links there.
Prefer to build it yourself?
Keep reading: 👇🏻
Some people want to know how the watch is made, others just want to know what time it is.
If you'd like to jump ahead & grab the template, go to the end of this thread.
You'll find Excel & G-Sheet links there.
Prefer to build it yourself?
Keep reading: 👇🏻
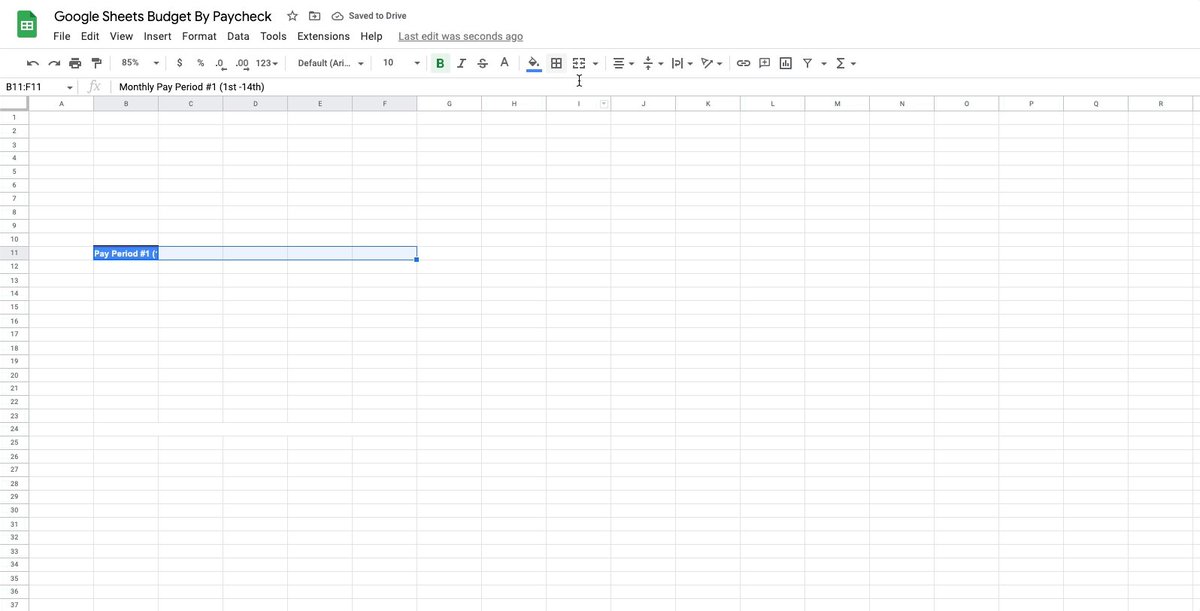
Step 1: Setup
For this template, we're going to assume you get paid every two weeks.
With this assumption, we'll break each month into bi-weekly segments.
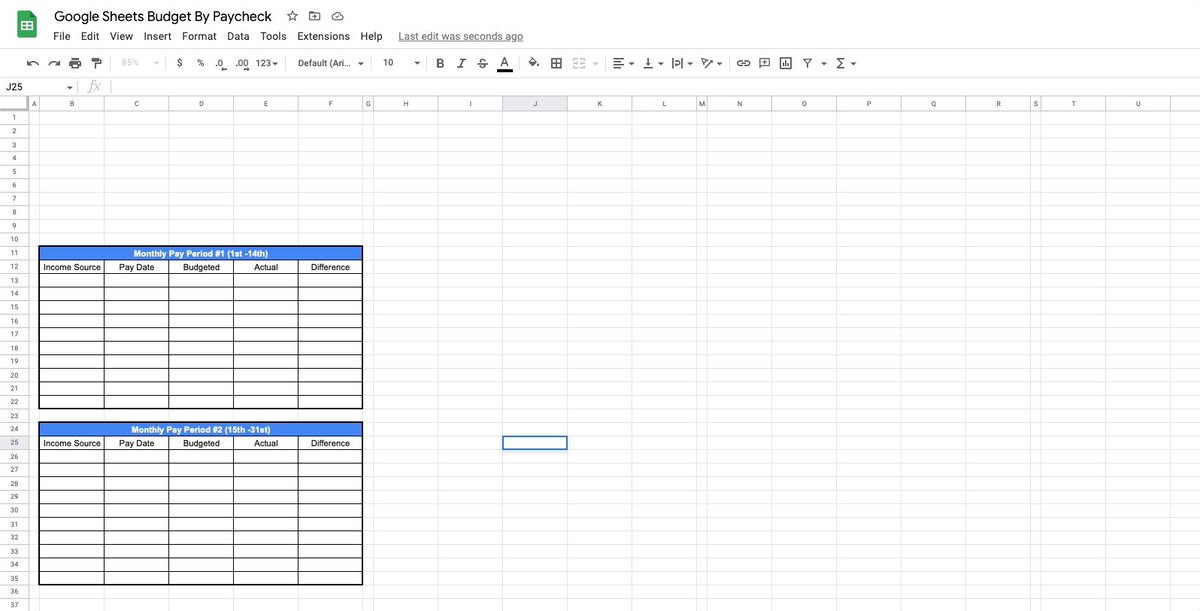
Create two "income" sections & list the following items:
• Income source
• Pay date
• Budgeted
• Actual
• Difference
For this template, we're going to assume you get paid every two weeks.
With this assumption, we'll break each month into bi-weekly segments.
Create two "income" sections & list the following items:
• Income source
• Pay date
• Budgeted
• Actual
• Difference
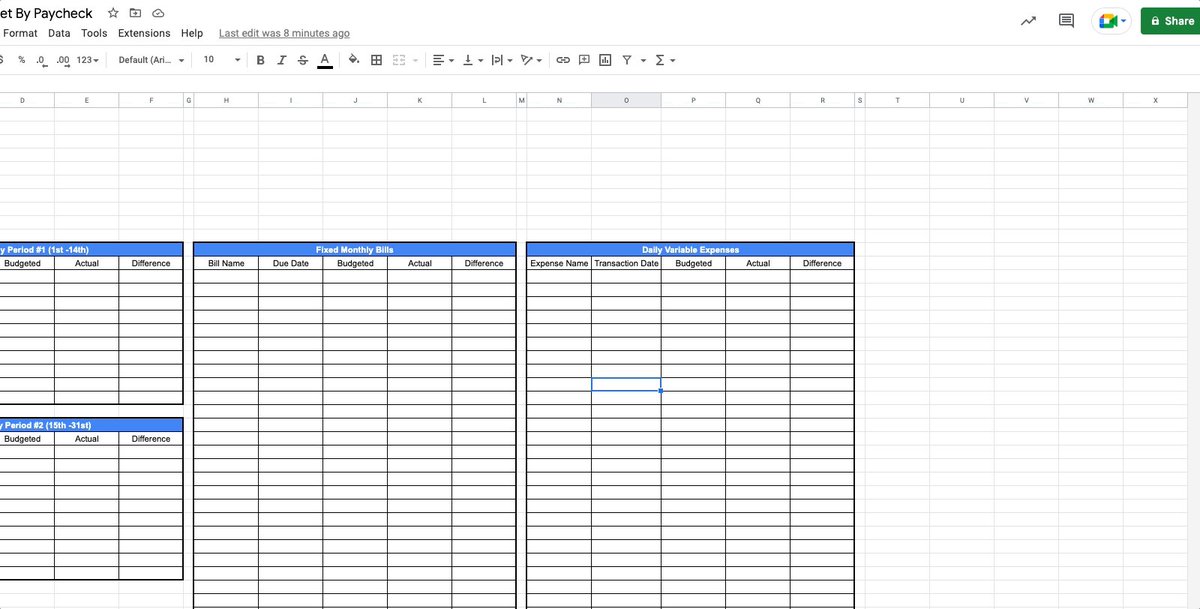
Step 2: Expenses
Most of us have two basic types of expenses:
Those that repeat every month:
• Gas
• Water
• Electric
• Mortgage or Rent, etc.
Or variable daily expenses like:
• Fuel
• Food
• Gifts
• Home repairs
• Dining out, etc.
Make 2 sections to capture these:
Most of us have two basic types of expenses:
Those that repeat every month:
• Gas
• Water
• Electric
• Mortgage or Rent, etc.
Or variable daily expenses like:
• Fuel
• Food
• Gifts
• Home repairs
• Dining out, etc.
Make 2 sections to capture these:
Step 3: Debts
Nobody likes them, but most of us have them...
Next, we'll make a section to capture any debt payments that'll need to be made each month.
List:
• Debt name
• Due Date
• Budget & Actual
• Difference
Shown here:
Nobody likes them, but most of us have them...
Next, we'll make a section to capture any debt payments that'll need to be made each month.
List:
• Debt name
• Due Date
• Budget & Actual
• Difference
Shown here:
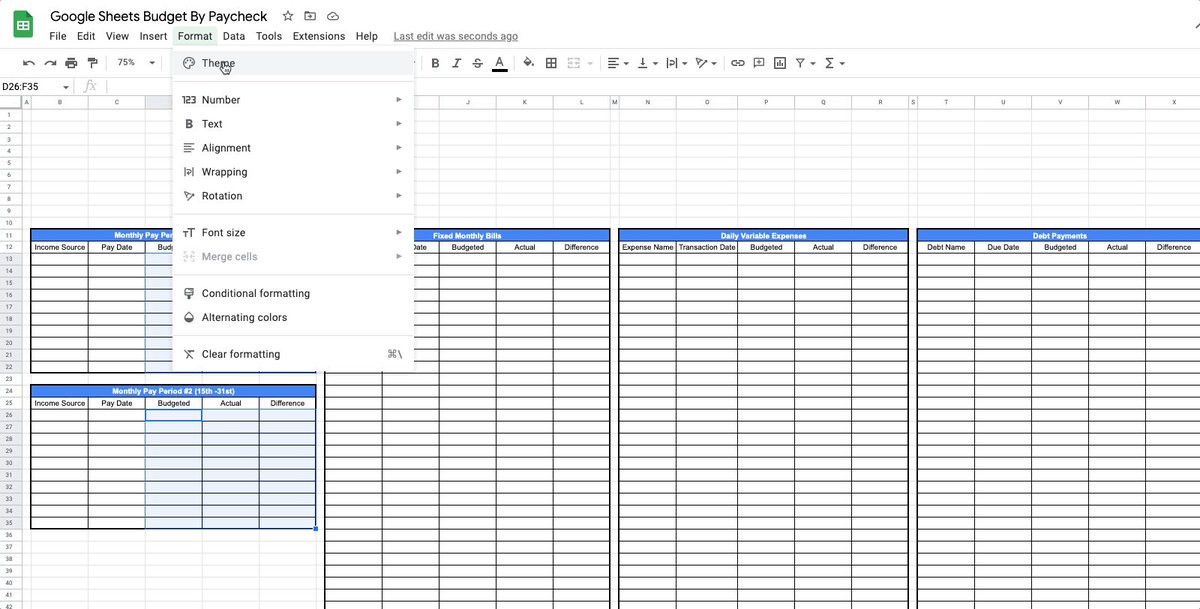
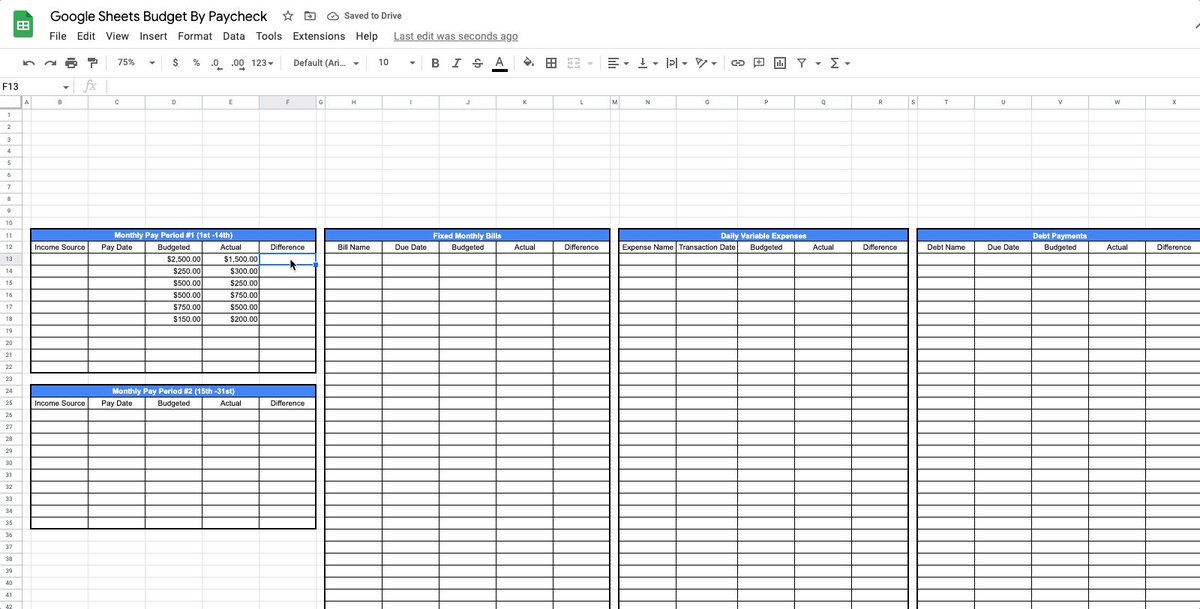
Step 4: Currency Formatting
Alright, we are talking about money here...
Let's format our cells accordingly.
Select each range where a monetary value will be entered and head to:
Format → Number → Currency
Like this:
Alright, we are talking about money here...
Let's format our cells accordingly.
Select each range where a monetary value will be entered and head to:
Format → Number → Currency
Like this:
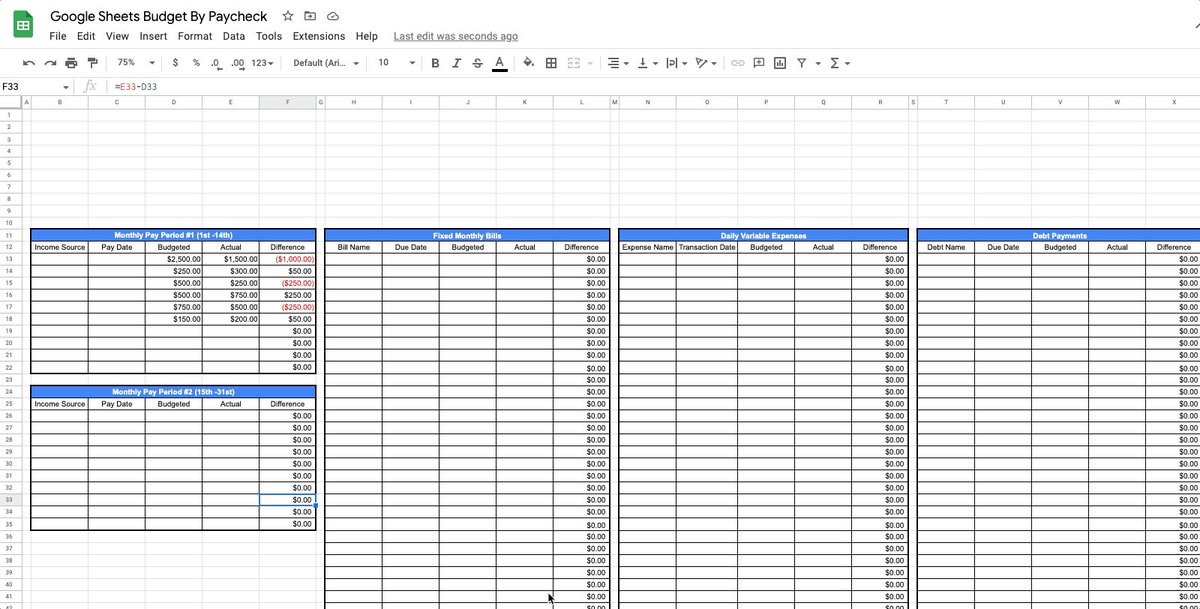
Step 5: Difference Formula & Format
One thing I always like to see inside my budget is a comparison of what I expected to happen (budgeted) vs. what really happened (actual).
To do this, add a formula to your "difference" cells along with custom number formatting.
Example:
One thing I always like to see inside my budget is a comparison of what I expected to happen (budgeted) vs. what really happened (actual).
To do this, add a formula to your "difference" cells along with custom number formatting.
Example:
Step 6: Date Data Validation
Now we'll format our date fields to show pop-up calendars using data validation.
• Select each range
• Data → Data Validation → Date
Do this for each group of cells where a date will need to be added.
Watch here:
Now we'll format our date fields to show pop-up calendars using data validation.
• Select each range
• Data → Data Validation → Date
Do this for each group of cells where a date will need to be added.
Watch here:
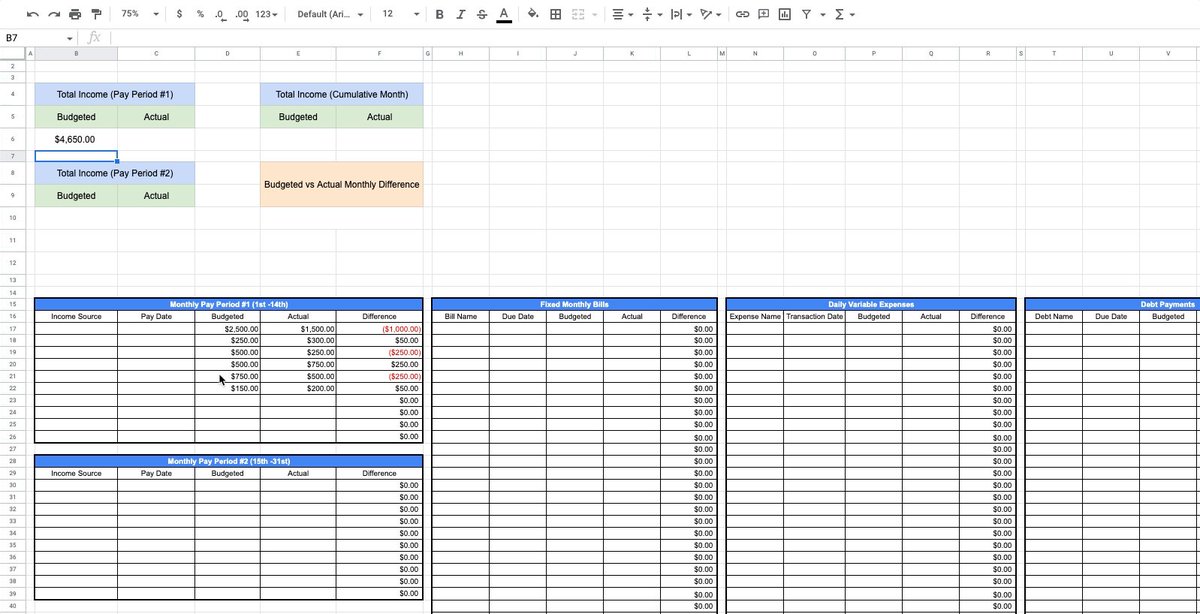
Step 7: Header Totals (Income)
Up next we'll make a few headers to summarize our income:
• Total Income
→ Pay Period 1
→ Pay Period 2
→ Cumulative Monthly
→ Budget vs Actual Difference
Add simple SUM formulas to aggregate totals for each.
Here's how:
Up next we'll make a few headers to summarize our income:
• Total Income
→ Pay Period 1
→ Pay Period 2
→ Cumulative Monthly
→ Budget vs Actual Difference
Add simple SUM formulas to aggregate totals for each.
Here's how:
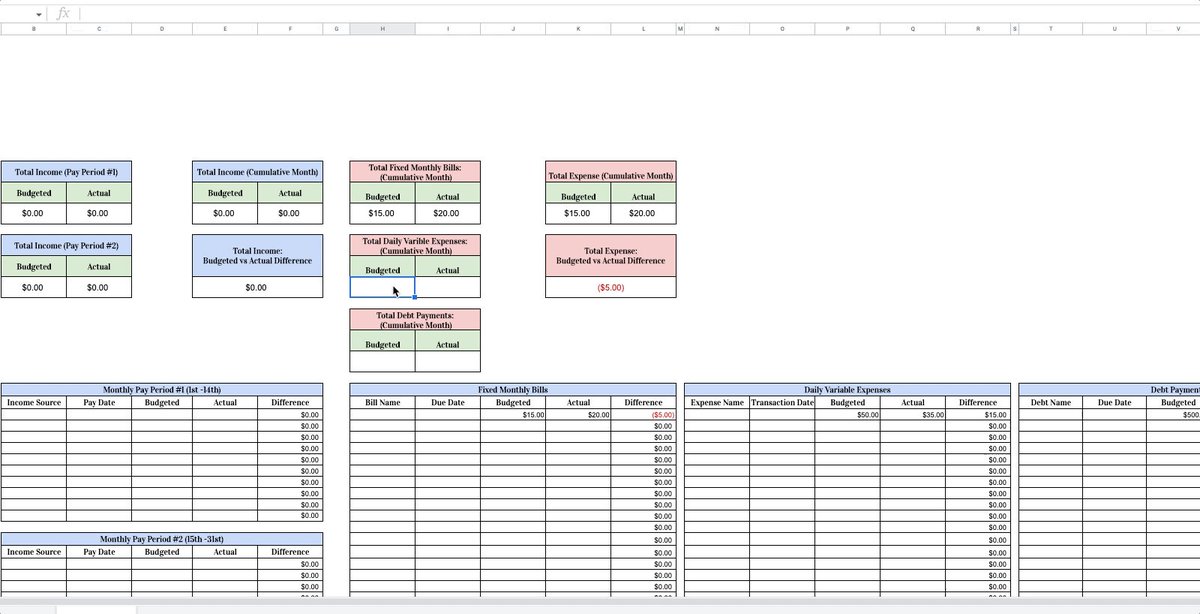
Step 8: Header Totals (Expense)
Now we'll create similar headers for our expense categories:
• Total Fixed Monthly Bills
• Total Daily Variable Expenses
• Total Debt Payments
• Total Month
• Budget vs Actual
Again using simple SUM formulas to aggregate totals for each.
Now we'll create similar headers for our expense categories:
• Total Fixed Monthly Bills
• Total Daily Variable Expenses
• Total Debt Payments
• Total Month
• Budget vs Actual
Again using simple SUM formulas to aggregate totals for each.
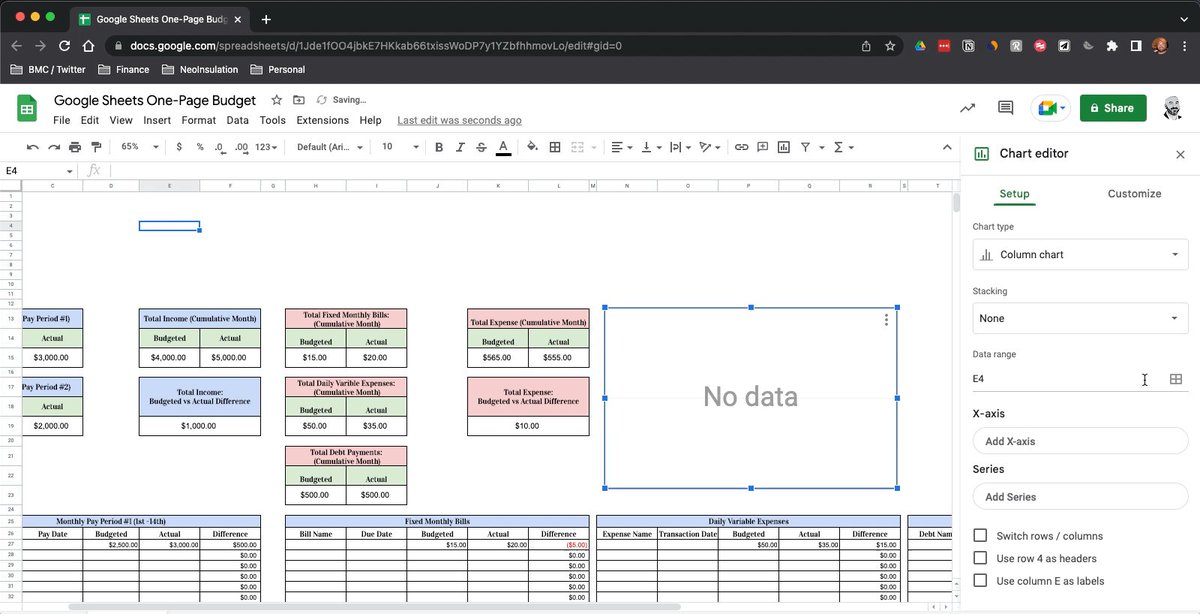
Step 9: Income Graph
In this step, we'll add a simple chart to visualize our Total Income (Budgeted Vs Actual) for the month.
• Insert → Chart → Column
• Data Range → E15:F15
• Chart Title → Total Income
• Update Fill Colors & Data Labels
Like this:
In this step, we'll add a simple chart to visualize our Total Income (Budgeted Vs Actual) for the month.
• Insert → Chart → Column
• Data Range → E15:F15
• Chart Title → Total Income
• Update Fill Colors & Data Labels
Like this:
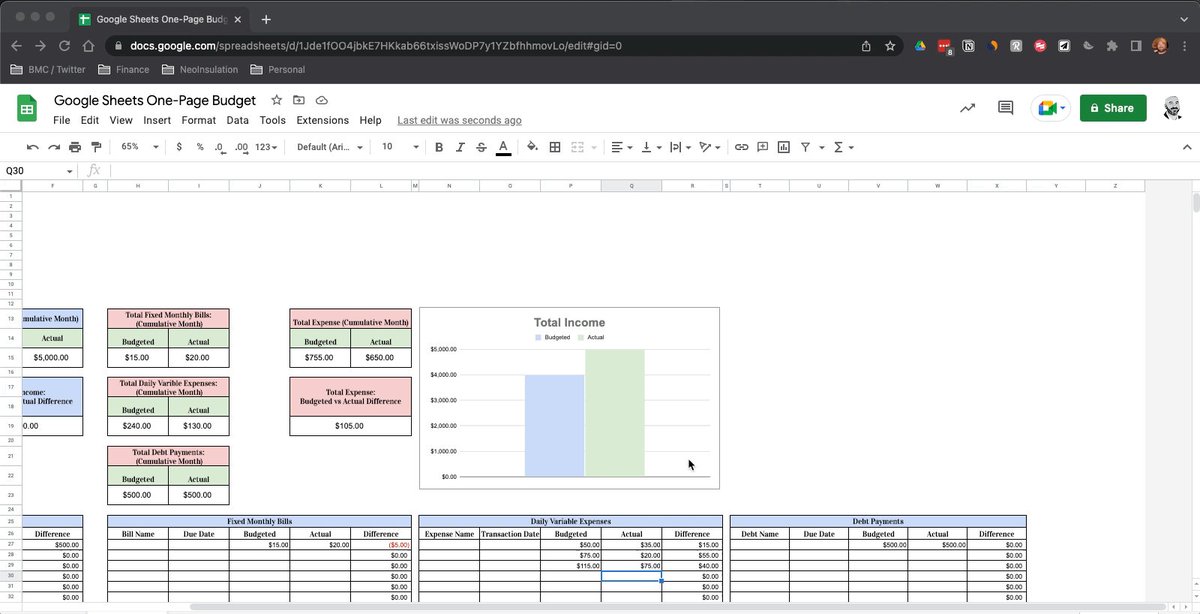
Step 10: Expense Graph
Now let's create a similar graph to show our Budgeted Vs Actual Expenses.
Don't reinvent the wheel here.
• Select your Total Income chart
• Copy Chart → Paste
• Update data range (K15:L15)
• Update chart title
Shown here:
Now let's create a similar graph to show our Budgeted Vs Actual Expenses.
Don't reinvent the wheel here.
• Select your Total Income chart
• Copy Chart → Paste
• Update data range (K15:L15)
• Update chart title
Shown here:
Step 11: Available To Spend
At the end of the day, what matters to most of us is how much money we've been paid Vs how much money we've spent.
We've gotta know what's left!
Add summaries at the top of your sheet to capture this information (based on actuals)
See below:
At the end of the day, what matters to most of us is how much money we've been paid Vs how much money we've spent.
We've gotta know what's left!
Add summaries at the top of your sheet to capture this information (based on actuals)
See below:
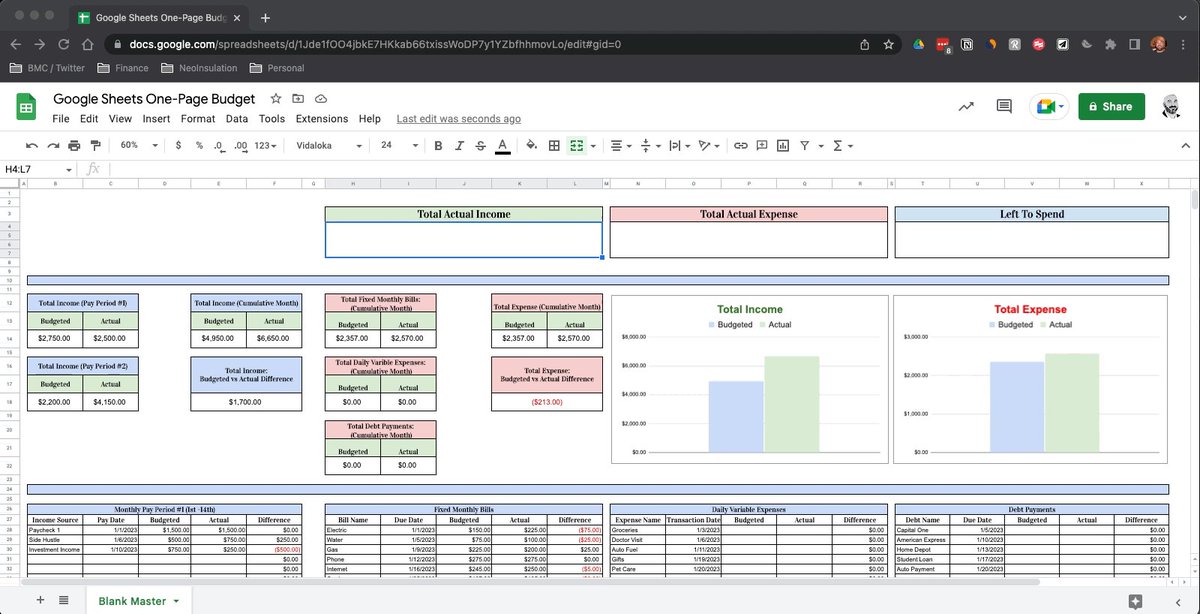
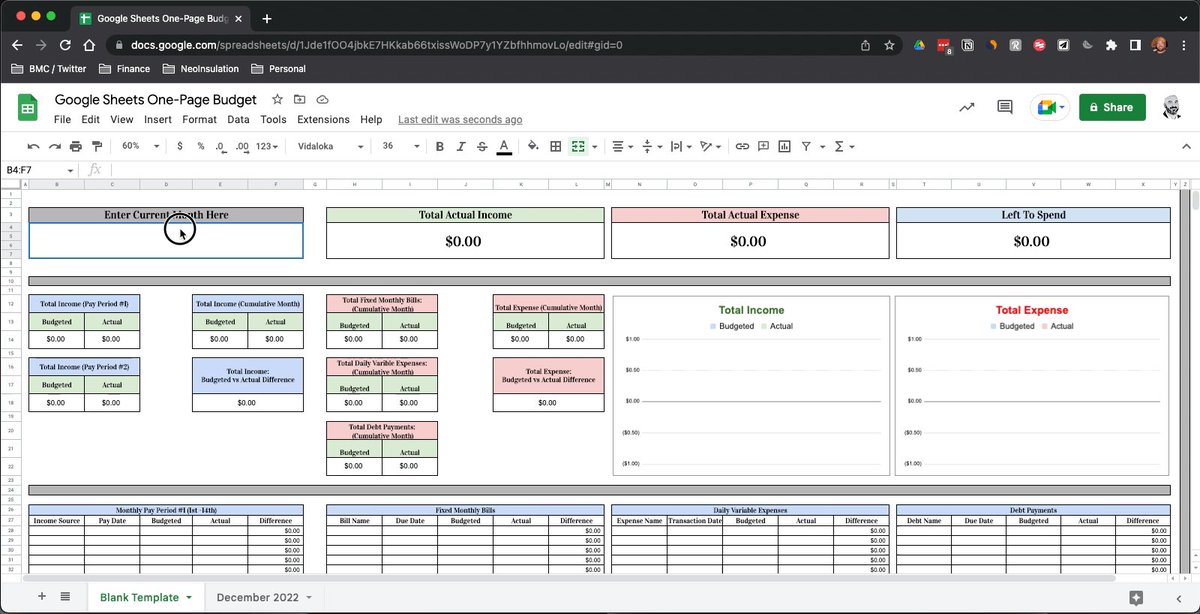
Step 12: Month Name & Blank Template
Last, add one more section to your header where you can enter the current month's name.
After this, your "one-page budget" is complete!
• Name your completed sheet:
→ "blank template"
• Duplicate this sheet each month to start fresh!
Last, add one more section to your header where you can enter the current month's name.
After this, your "one-page budget" is complete!
• Name your completed sheet:
→ "blank template"
• Duplicate this sheet each month to start fresh!
Templates:
I assume it'll take you a few hours to recreate this yourself.
Rather save some time and get to work budgeting?
You can grab the finished product (along with several others) below.
Excel & G-Sheet Options available here:
blakeburge.com
I assume it'll take you a few hours to recreate this yourself.
Rather save some time and get to work budgeting?
You can grab the finished product (along with several others) below.
Excel & G-Sheet Options available here:
blakeburge.com
Rather receive these breakdowns in your inbox so you don't miss one?
Join over 23,500 others and sign up below (it's free)
• Spreadsheet tips
• Template breakdowns
• Time-saving productivity skills & more.
blakeburge.com
Join over 23,500 others and sign up below (it's free)
• Spreadsheet tips
• Template breakdowns
• Time-saving productivity skills & more.
blakeburge.com
Loading suggestions...