

People are shocked when they learn that I picked R over Python.
It’s a true story. 🧵
#rstats #datascience
It’s a true story. 🧵
#rstats #datascience
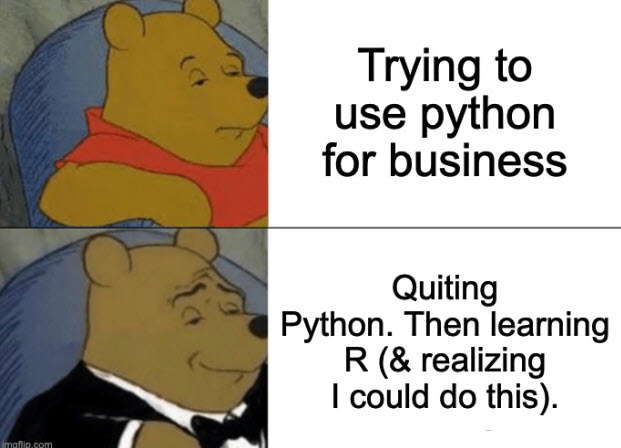
I began learning data science with Python.
This decision actually cost me 3 months and caused me to quit data science for a little bit.
Why?
This decision actually cost me 3 months and caused me to quit data science for a little bit.
Why?
Python was too much like coding.
And I came from a business background.
My main tool was Excel.
Python was unnatural. 🙃
And I came from a business background.
My main tool was Excel.
Python was unnatural. 🙃
A friend of mine recommended trying #R.
I was instantly surprised at how much more intuitive it was for me given my Excel background:
I was instantly surprised at how much more intuitive it was for me given my Excel background:
👉R has #functions just like Excel.
I could quickly summarize my data using:
mean(),
sd(),
sum(),
and friends.
These functions were very similar to:
AVERAGE(),
STDEV(), and
SUM()
from Excel.
I could quickly summarize my data using:
mean(),
sd(),
sum(),
and friends.
These functions were very similar to:
AVERAGE(),
STDEV(), and
SUM()
from Excel.
👉R has #analytics built-in.
I could do correlation and make trendlines with linear regression very easily.
No importing a half-dozen libraries...
Then finding that none of them work together.
R's analytics works out of the box (so powerful when you're just getting started)
I could do correlation and make trendlines with linear regression very easily.
No importing a half-dozen libraries...
Then finding that none of them work together.
R's analytics works out of the box (so powerful when you're just getting started)
👉R had the #tidyverse.
The tidyverse blew my mind.
This toolkit includes data wrangling and visualization libraries that effortlessly worked together.
The tidyverse blew my mind.
This toolkit includes data wrangling and visualization libraries that effortlessly worked together.
👉 R had the pipe: %>%
If you’ve never tried it, the #pipe %>% is this amazing operation that allows you to flow your data transformations from one operation to another.
If you’ve never tried it, the #pipe %>% is this amazing operation that allows you to flow your data transformations from one operation to another.
👉R has easy reporting!
I was able to make a simple PDF report in minutes versus struggling with Jupyter.
To this day I still struggle with Jupyter for making clean reports (I'm convinced it's impossible)
But it's easy with R and #Rmarkdown.
I was able to make a simple PDF report in minutes versus struggling with Jupyter.
To this day I still struggle with Jupyter for making clean reports (I'm convinced it's impossible)
But it's easy with R and #Rmarkdown.
So I ended up picking R and to this day I’m so happy I did.
If you’re like me...
... coming from a business background
... using Excel, Tableau, or PowerBI daily,
...then R will feel like those tools on STEROIDS! (seriously)
... coming from a business background
... using Excel, Tableau, or PowerBI daily,
...then R will feel like those tools on STEROIDS! (seriously)
And if you're reading this and you want more information on how to become a data scientist with R.
Or how to upskill yourself as fast as possible.
Then I'd love to help. ❤️
Or how to upskill yourself as fast as possible.
Then I'd love to help. ❤️
I’ve consolidated my learnings into 10 secrets that I wished I knew going into data science.
These are the 10 most valuable tools I’ve learned over my journey.
And having this blueprint would have cut 4.5 years off my data science journey.
These are the 10 most valuable tools I’ve learned over my journey.
And having this blueprint would have cut 4.5 years off my data science journey.
What's your next step?
Just watch the free training (and take good notes).
Get started here: learn.business-science.io
Just watch the free training (and take good notes).
Get started here: learn.business-science.io
Loading suggestions...