

My beginner/intermediate #Rstats friends often ask me for tips.
➡️Here is the 'dream pipeline' I use for my data analysis, ending with a clean, interactive, online report:
🧵..
➡️Here is the 'dream pipeline' I use for my data analysis, ending with a clean, interactive, online report:
🧵..
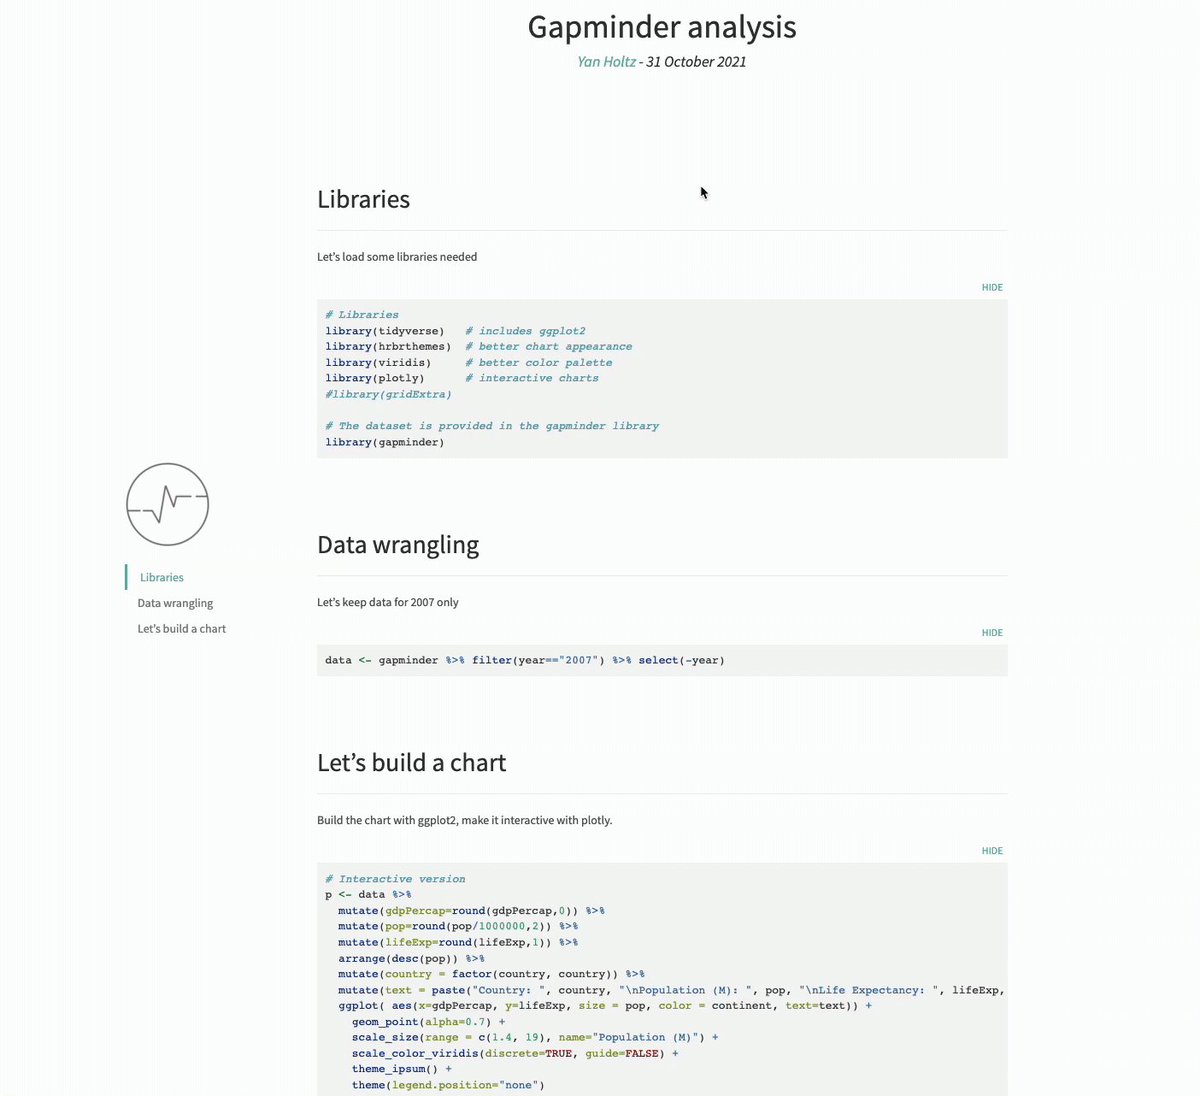
Let's take a famous dataset: relationship between
- GDP per capita,
- population, and
- life expectancy
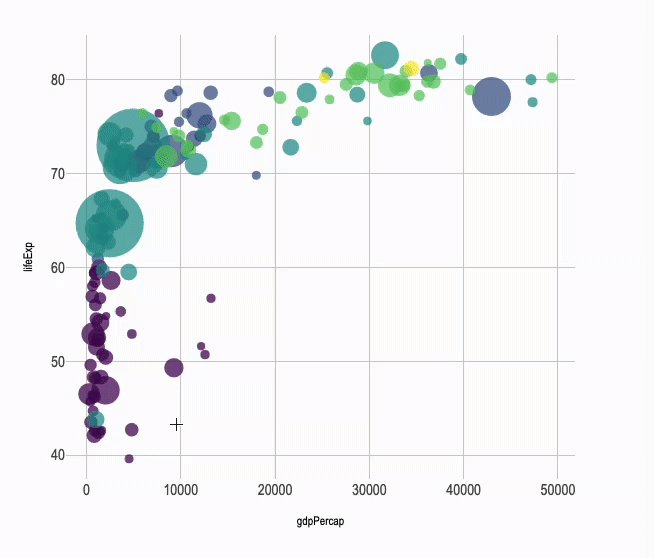
⭐️Tip 1⃣: Use ggplot2 and the tidyverse to get a clean chart easily.
r-graph-gallery.com
- GDP per capita,
- population, and
- life expectancy
⭐️Tip 1⃣: Use ggplot2 and the tidyverse to get a clean chart easily.
r-graph-gallery.com

⭐️Tip 2⃣: make this graph interactive with ONLY 1 additional line of code 😍! I promise, just 1 more.
Thanks to the plotly package and its ggplotly() function.
You now have the details of each circle in a tooltip.
r-graph-gallery.com
Thanks to the plotly package and its ggplotly() function.
You now have the details of each circle in a tooltip.
r-graph-gallery.com

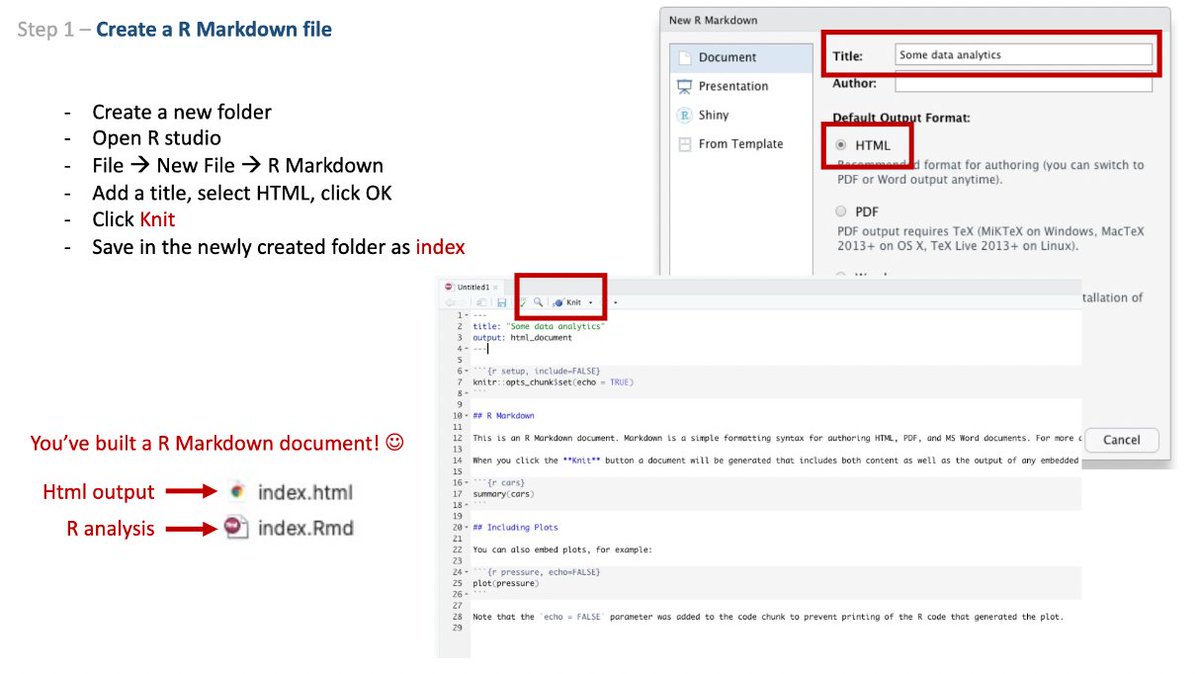
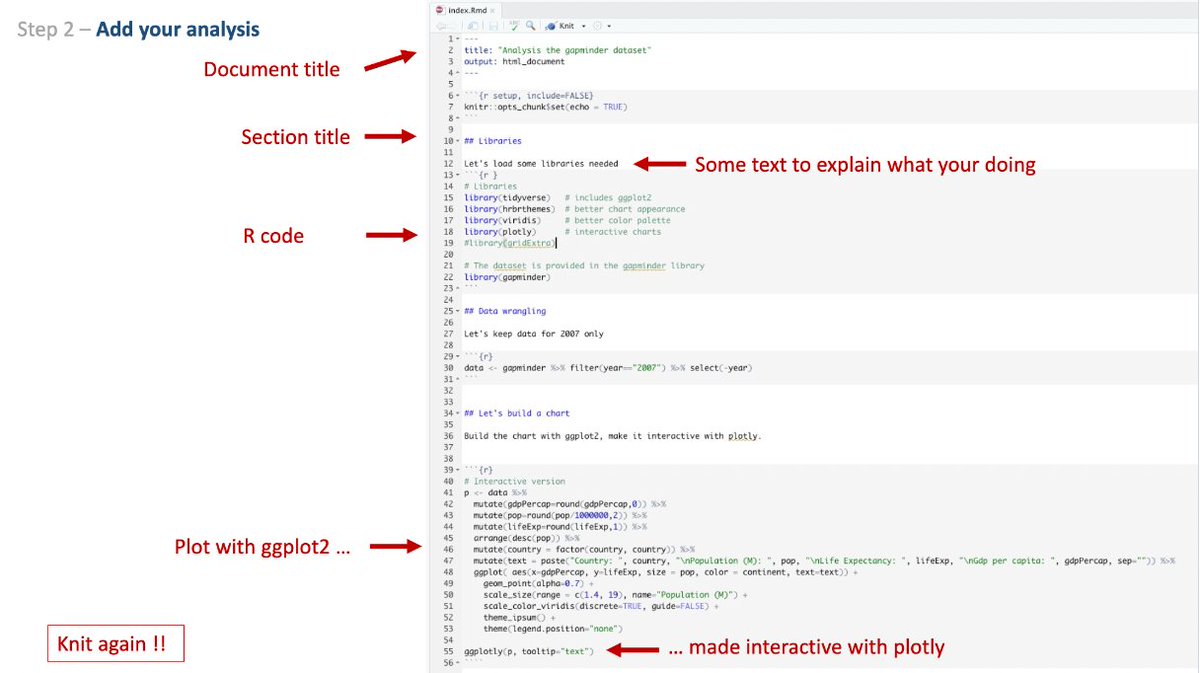
⭐️Tip 3⃣ : R markdown first
Always write your code in a .RMD file from the beginning. Include text to explain the process. And links to relevant info.
You'll loose a few minutes to learn it first. But 100% guarantee it's worth in the long run.
Here is a quick how to:
Always write your code in a .RMD file from the beginning. Include text to explain the process. And links to relevant info.
You'll loose a few minutes to learn it first. But 100% guarantee it's worth in the long run.
Here is a quick how to:
⭐️Tip 4⃣ : Learn how to make the html output pretty:
- some tips and tricks:
holtzy.github.io
- use a template like:
github.com
- some tips and tricks:
holtzy.github.io
- use a template like:
github.com

⭐️Tip 5⃣:
Put all your work on Github. It's a bit like a Dropbox but 1000x better and done for developers.
Spending a few hours learning it will change your workflow for ever. No more fig1.clean.final.real.4 😉
Use a client like:
desktop.github.com
Put all your work on Github. It's a bit like a Dropbox but 1000x better and done for developers.
Spending a few hours learning it will change your workflow for ever. No more fig1.clean.final.real.4 😉
Use a client like:
desktop.github.com

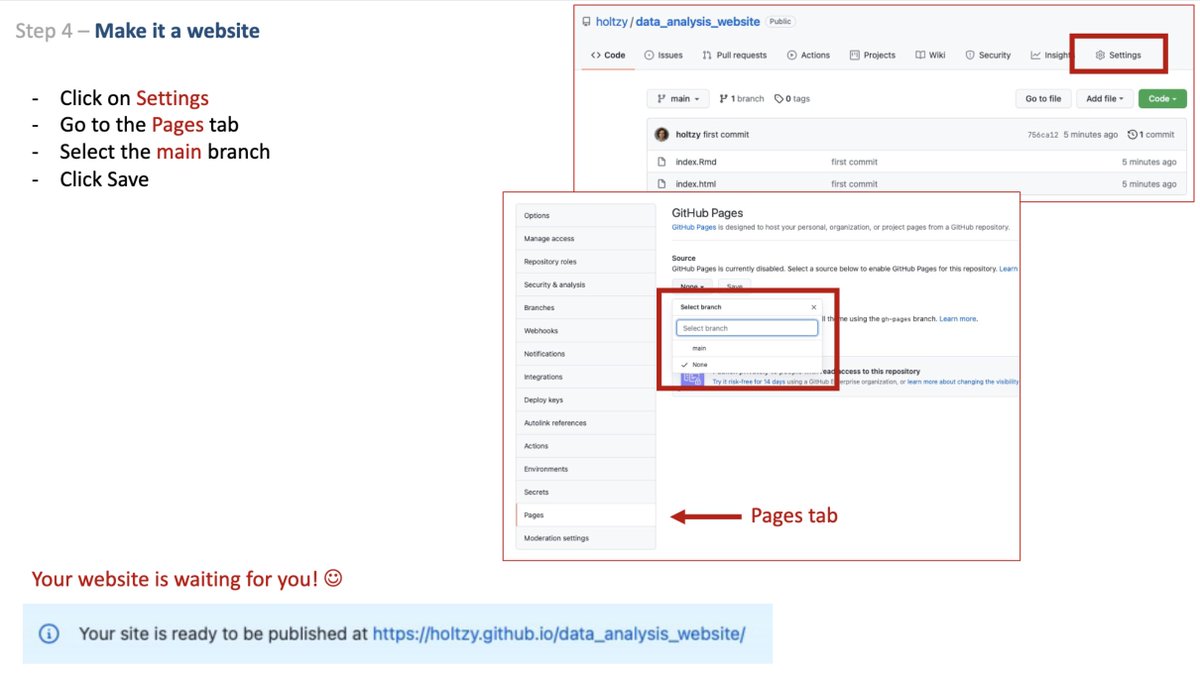
⭐️Tip 6⃣:
Transform your report in a website for free in 5 seconds.
You just need to call your report "index.html" and do this.
Here is an example of the result:
holtzy.github.io
Transform your report in a website for free in 5 seconds.
You just need to call your report "index.html" and do this.
Here is an example of the result:
holtzy.github.io
And that's it!
See the complete explanation here:
github.com
Buenas Tardes and please share any other tips you have in mind!!
👋
See the complete explanation here:
github.com
Buenas Tardes and please share any other tips you have in mind!!
👋

Loading suggestions...