

The ICT Mentorship Core Content Month 4 Summarized:

A. Smart Money Accumulation/Distribution
1. Interest rates are the biggest force that moves the markets
2. Understanding interest rate shifts can assist in trade selection
3. Interest rate triads identify smart money accumulation and distribution
1. Interest rates are the biggest force that moves the markets
2. Understanding interest rate shifts can assist in trade selection
3. Interest rate triads identify smart money accumulation and distribution
B. Interest Rate Triads
1. 30-Year Bond - long-term interest rate
2. 10-Year Note - intermediate-term interest rate
3. 5-Year Note - short-term interest rate
4. Comparing these 3 interest rates unlocks price action
1. 30-Year Bond - long-term interest rate
2. 10-Year Note - intermediate-term interest rate
3. 5-Year Note - short-term interest rate
4. Comparing these 3 interest rates unlocks price action
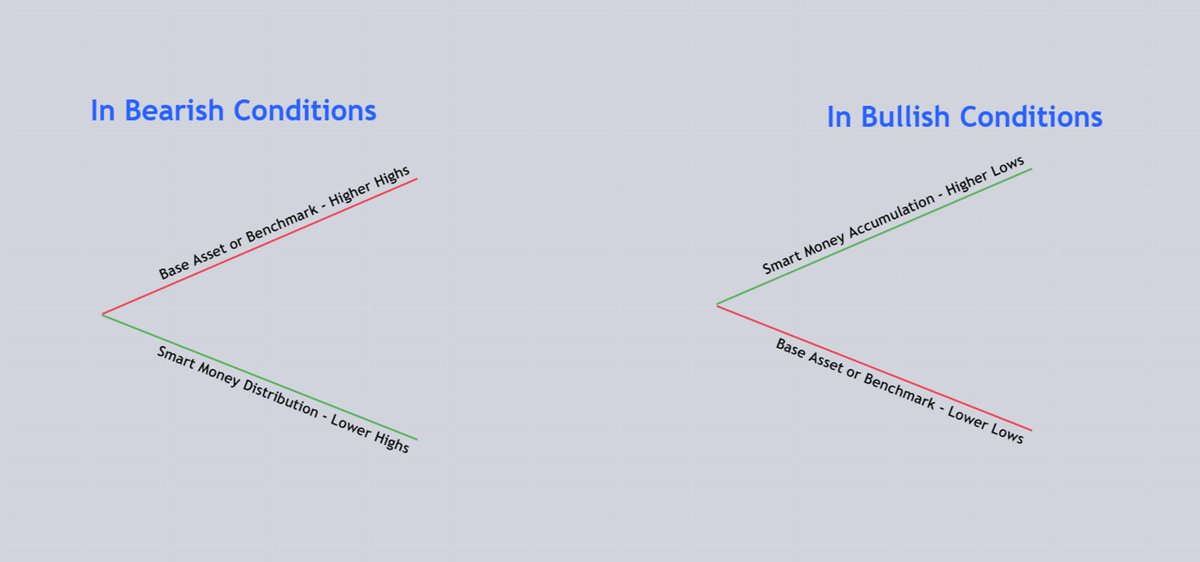
What Smart Money Looks Like In Price
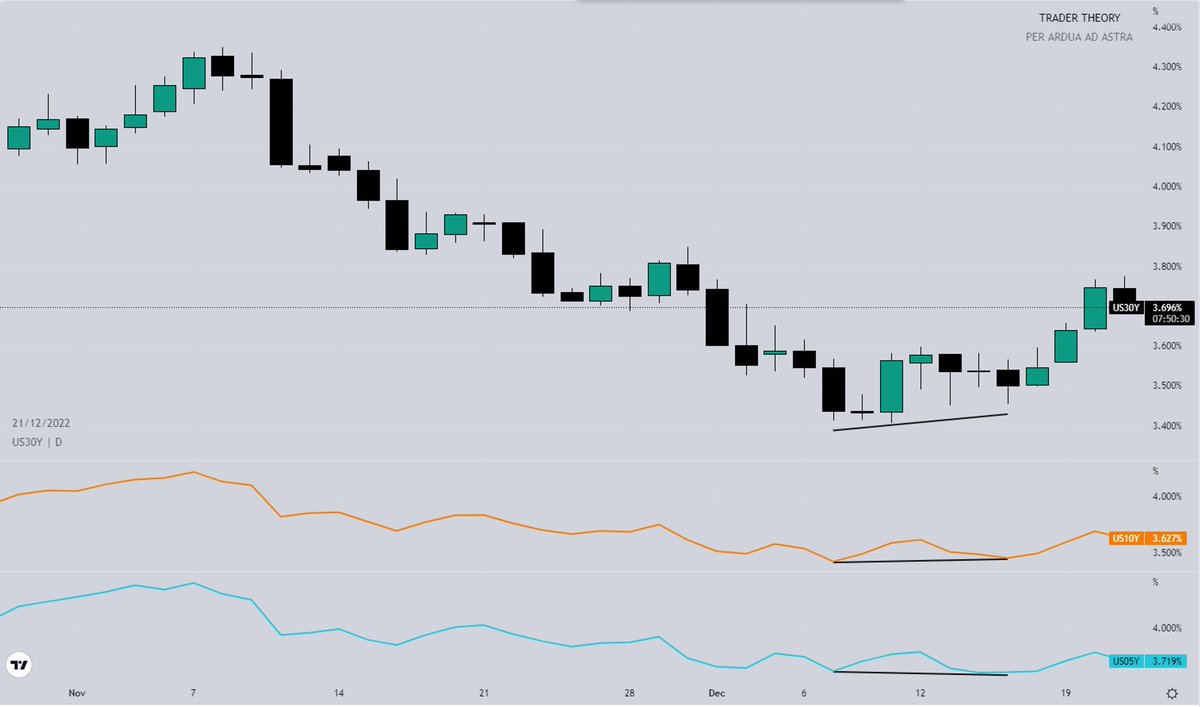
Interest Rate Triad
30 Year T Bond
10 Year Note
5 Year Note
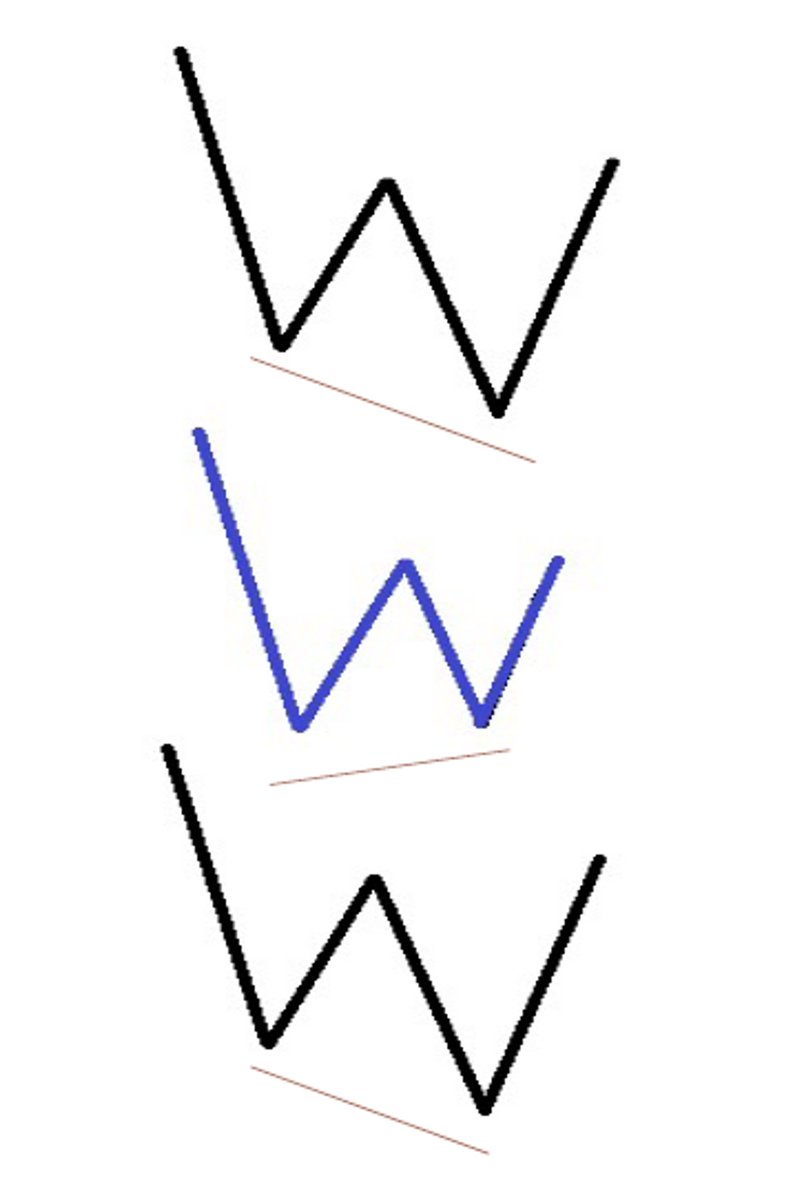
Overlaying these 3 markets will show where accumulation & distribution is taking place in the interest market.
The 3 rates should confirm each higher high or lower low.
30 Year T Bond
10 Year Note
5 Year Note
Overlaying these 3 markets will show where accumulation & distribution is taking place in the interest market.
The 3 rates should confirm each higher high or lower low.
A failure swing will show smart money participation in the markets & validate trade setups.
ICT Action Plan
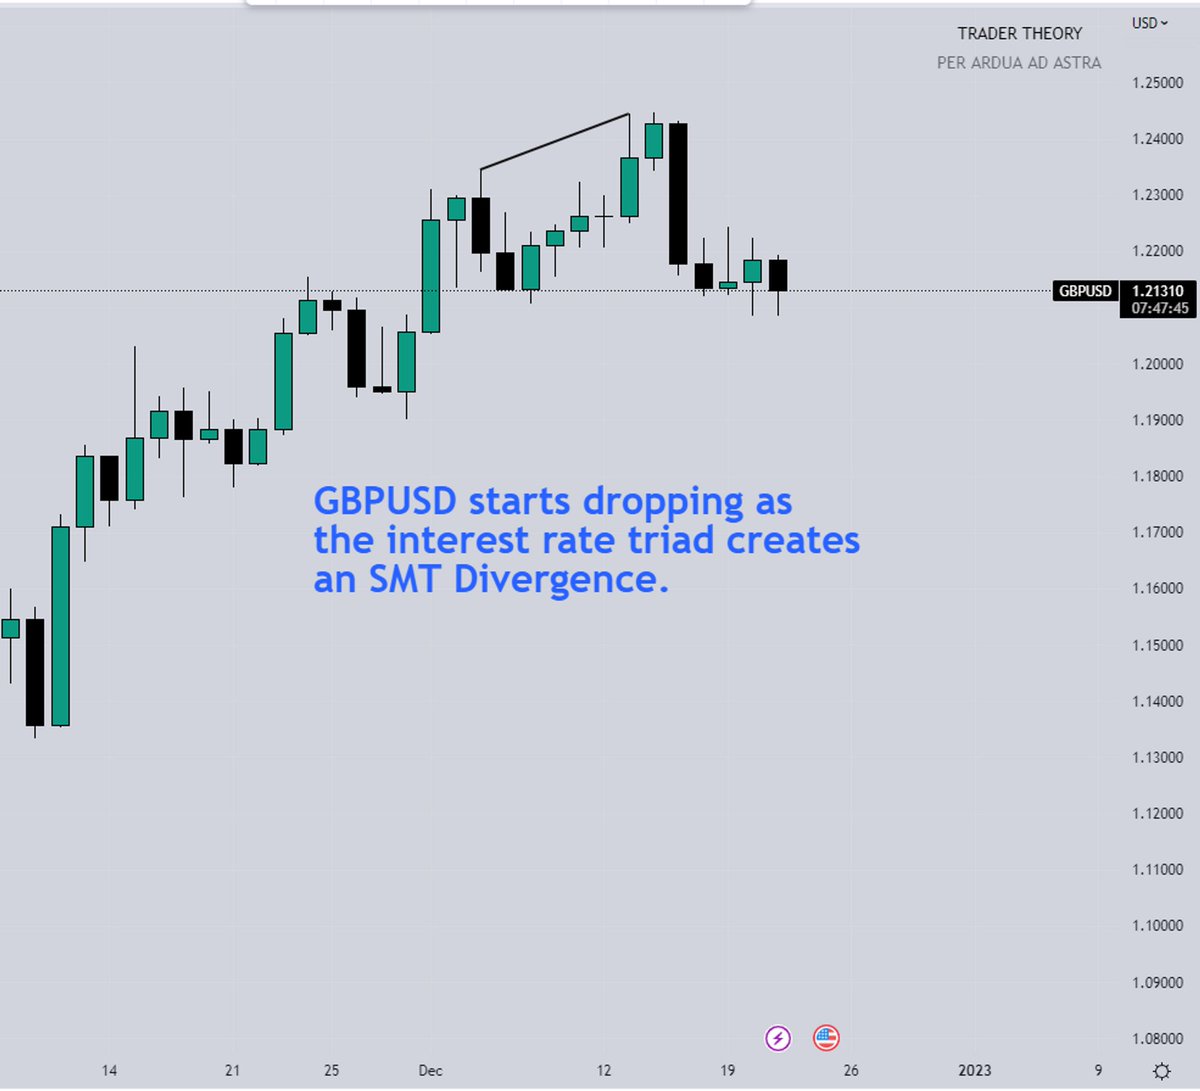
When price trades to a focus point (orderblock, liquidity pool, or fair value gap) refer to the interest rate triad & DXY to confirm smart money is behind your trade idea.
If there is no obvious indication they are moving large funds - pass on the trade idea.
When price trades to a focus point (orderblock, liquidity pool, or fair value gap) refer to the interest rate triad & DXY to confirm smart money is behind your trade idea.
If there is no obvious indication they are moving large funds - pass on the trade idea.
Reinforcing Liquidity Concepts & Price Delivery
A. External Range Liquidity
1. The current trading range will have buy-side liquidity above the range and sell-side liquidity below the range
2. Runs on liquidity seek to pair orders with the pending order liquidity
A. External Range Liquidity
1. The current trading range will have buy-side liquidity above the range and sell-side liquidity below the range
2. Runs on liquidity seek to pair orders with the pending order liquidity
B. Internal Range Liquidity
1. When the current range is likely to remain fair value gaps and liquidity voids will fill in
2. Orderblocks inside the range will be traded off of
3. Market maker models will form inside trading ranges
1. When the current range is likely to remain fair value gaps and liquidity voids will fill in
2. Orderblocks inside the range will be traded off of
3. Market maker models will form inside trading ranges
Orderblock Theory [Selecting & Avoiding]
Bullish Orderblock:
Definition - The lowest candle with a down close that has the most range between the open to close and is near a ‘support’ level.
Bullish Orderblock:
Definition - The lowest candle with a down close that has the most range between the open to close and is near a ‘support’ level.
![Orderblock Theory [Selecting & Avoiding]
Bullish Orderblock:
Definition - The lowest candle wi...](https://pbs.twimg.com/media/Flt6Gc5XwAEDilS.jpg)
![Orderblock Theory [Selecting & Avoiding]
Bullish Orderblock:
Definition - The lowest candle wi...](https://pbs.twimg.com/media/Flt6IAlXgAEQYIy.jpg)
![Orderblock Theory [Selecting & Avoiding]
Bullish Orderblock:
Definition - The lowest candle wi...](https://pbs.twimg.com/media/Flt6Jy1XoAQM38u.jpg)
Liquidity Based Bias
Monthly Weekly & Daily Chart=Bearish
4-hour chart or less will be retracing higher
Anticipate the market to enter a Premium and seek Buy Side Liquidity
Return to -OB or FVG
Giving potential low resistance liquidity run - targeting a recent low
Monthly Weekly & Daily Chart=Bearish
4-hour chart or less will be retracing higher
Anticipate the market to enter a Premium and seek Buy Side Liquidity
Return to -OB or FVG
Giving potential low resistance liquidity run - targeting a recent low
Monthly Weekly & Daily Chart=Bullish
4-hour chart or less will be retracing lower
Anticipate the market to enter a Discount and seek Sell Side Liquidity
Return to +OB or FVG
Giving potential low resistance liquidity run - targeting a recent high
4-hour chart or less will be retracing lower
Anticipate the market to enter a Discount and seek Sell Side Liquidity
Return to +OB or FVG
Giving potential low resistance liquidity run - targeting a recent high
Reinforcing Orderblock Theory [Mitigation Block]
![Reinforcing Orderblock Theory [Mitigation Block] https://t.co/T7pIRJEjyw](https://pbs.twimg.com/media/Flt6RalWYAAlK0x.jpg)
![Reinforcing Orderblock Theory [Mitigation Block] https://t.co/T7pIRJEjyw](https://pbs.twimg.com/media/Flt6TBpWQAAvpoH.jpg)
![Reinforcing Orderblock Theory [Mitigation Block] https://t.co/T7pIRJEjyw](https://pbs.twimg.com/media/Flt6UWPWAAEyhvT.jpg)
![Reinforcing Orderblock Theory [Mitigation Block] https://t.co/T7pIRJEjyw](https://pbs.twimg.com/media/Flt6V67WQAI9keP.jpg)
Reinforcing Orderblock Theory [Bullish & Bearish Breaker Block]
![Reinforcing Orderblock Theory [Bullish & Bearish Breaker Block] https://t.co/o0qFkHTWmN](https://pbs.twimg.com/media/Flt6ZLEXoAASlxV.jpg)
![Reinforcing Orderblock Theory [Bullish & Bearish Breaker Block] https://t.co/o0qFkHTWmN](https://pbs.twimg.com/media/Flt6a4KXwAAaZh2.jpg)
![Reinforcing Orderblock Theory [Bullish & Bearish Breaker Block] https://t.co/o0qFkHTWmN](https://pbs.twimg.com/media/Flt6cnzWIAIjC7V.jpg)
Reinforcing Orderblock Theory [Bearish & Bullish Rejection Block]
![Reinforcing Orderblock Theory [Bearish & Bullish Rejection Block] https://t.co/83gSpp5PUN](https://pbs.twimg.com/media/Flt6gIAX0AAiYOR.jpg)
![Reinforcing Orderblock Theory [Bearish & Bullish Rejection Block] https://t.co/83gSpp5PUN](https://pbs.twimg.com/media/Flt6hxBWIAkIlOv.jpg)
Reinforcing Orderblock Theory [Bullish & Bearish Vacuum Block]
![Reinforcing Orderblock Theory [Bullish & Bearish Vacuum Block] https://t.co/YwspvGqX6l](https://pbs.twimg.com/media/Flt6lYCXkAAO-I4.jpg)
Reinforcing Liquidity Voids [When To Anticipate Ranges To Fill In]
![Reinforcing Liquidity Voids [When To Anticipate Ranges To Fill In] https://t.co/MBq0o4AnwB](https://pbs.twimg.com/media/Flt6obpXwAAzLCT.jpg)
![Reinforcing Liquidity Voids [When To Anticipate Ranges To Fill In] https://t.co/MBq0o4AnwB](https://pbs.twimg.com/media/Flt6qIkWAAA26QE.jpg)
Reinforcing Fair Value Gaps [Trading Inside The Range]
![Reinforcing Fair Value Gaps [Trading Inside The Range] https://t.co/GAOUeffPoy](https://pbs.twimg.com/media/Flt6tLGXoAAUyyr.jpg)
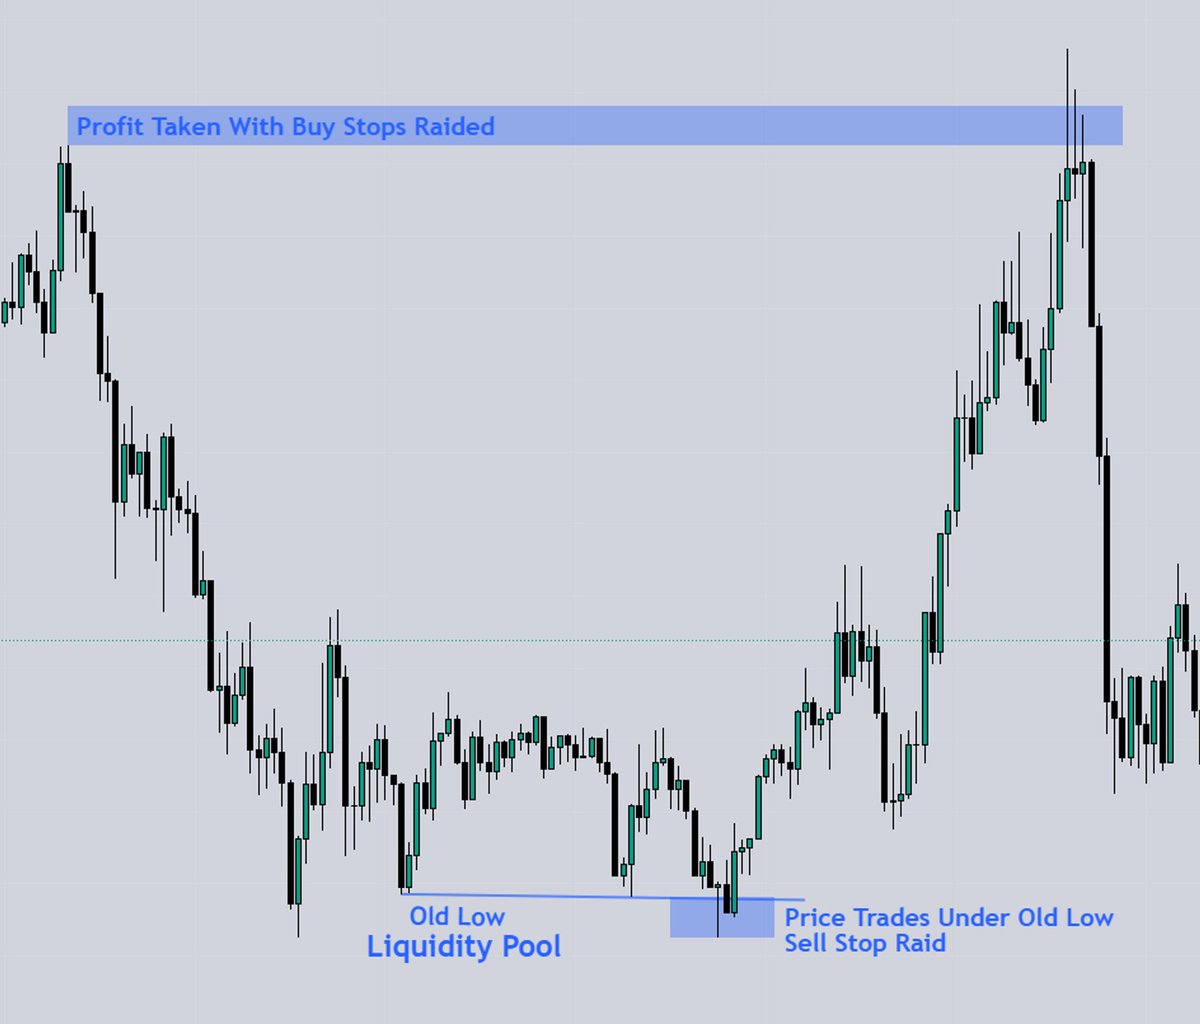
Reinforcing Liquidity Pools [When To Anticipate Raids]
Liquidity is the “open interest” of buyers and sellers in the market and can be further defined by those entities at or near specific price levels.
Liquidity is the “open interest” of buyers and sellers in the market and can be further defined by those entities at or near specific price levels.
![Reinforcing Liquidity Pools [When To Anticipate Raids]
Liquidity is the “open interest” of buyers a...](https://pbs.twimg.com/media/Flt6w6WXEAI5uck.jpg)
Run On Liquidity Pools
A low that is under the current market will typically have trailed sell stops under it on long trades.
Or sell stops for traders who wish to trade a breakout lower in the price for a short position.
A low that is under the current market will typically have trailed sell stops under it on long trades.
Or sell stops for traders who wish to trade a breakout lower in the price for a short position.
Credit:
Original creator @I_Am_The_ICT
This module on ICT’s YouTube youtube.com
Graphics instagram.com
Original creator @I_Am_The_ICT
This module on ICT’s YouTube youtube.com
Graphics instagram.com
If you appreciate my work sign up with my partnered broker Hero FX!
✅ Forex, indices, stocks, AND crypto to trade
✅ Choose from raw spreads or zero commission
✅ MetaTrader 4/5
Sign up now and enjoy a 50% bonus on your deposit to trade with 👇
login.herofx.co
✅ Forex, indices, stocks, AND crypto to trade
✅ Choose from raw spreads or zero commission
✅ MetaTrader 4/5
Sign up now and enjoy a 50% bonus on your deposit to trade with 👇
login.herofx.co
The ICT mentorship is still the greatest course/mentorship I’ve EVER taken in my 8-year self-improvement journey.
If you liked this thread consider following me @Trader_Theory
- More ICT mentorship module summaries
- Educational content
- Trading psychology
- And much more
If you liked this thread consider following me @Trader_Theory
- More ICT mentorship module summaries
- Educational content
- Trading psychology
- And much more
Loading suggestions...