

Today's census map shows the most common housing tenure in each local authority in England and Wales 🏡

I'm working on my spelling of mortgage, probably due to the shock of seeing how many households own without a mortgage!
most common by area is of course a very first-past-the-posty representation of things but I'm interested in the pattern precisely because of this - will fix typo later, perhaps I should do by constituency too
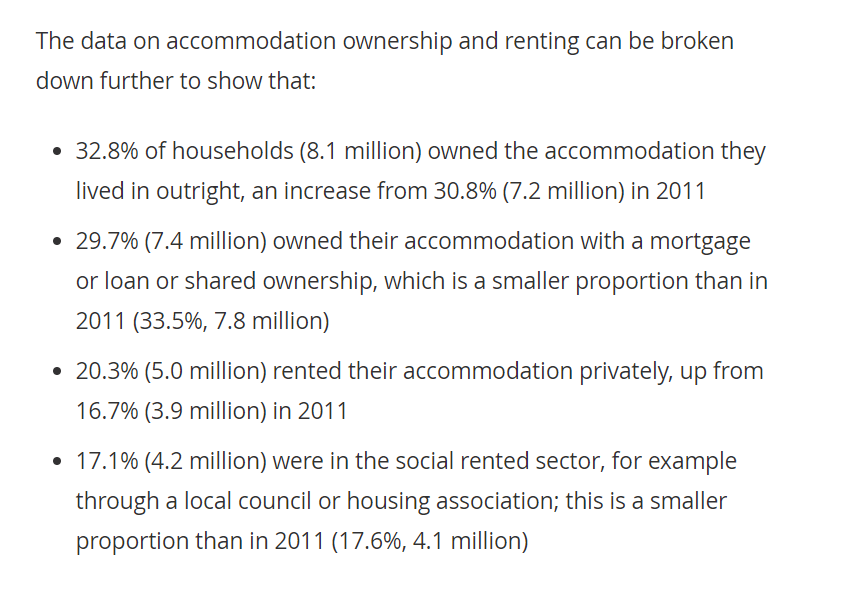
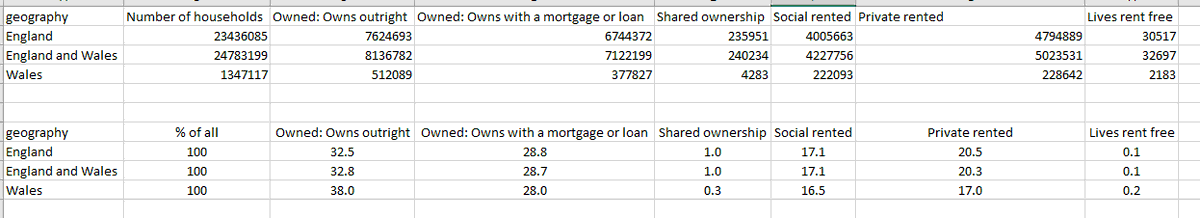
here's the England and Wales tenure breakdown by %, e.g.
- about a third of all households in England and Wales own without a mortgage and it's the most common tenure across more than 200 local authorities
- about a fifth of households rent privately
- varies by area of course
- about a third of all households in England and Wales own without a mortgage and it's the most common tenure across more than 200 local authorities
- about a fifth of households rent privately
- varies by area of course
fixed 'mortgate' typo, and also:
- I put note on the map in an attempt to avoid any misunderstanding, doesn't always work
- it purposely shows modal category because that's what I wanted to know
- some folk say the Census data is just wrong
- own outright is 33% in E&W overall
- I put note on the map in an attempt to avoid any misunderstanding, doesn't always work
- it purposely shows modal category because that's what I wanted to know
- some folk say the Census data is just wrong
- own outright is 33% in E&W overall

data came out yesterday and you can find it here, dataset TS054 is the one to look for - available for many different geographies (e.g. OA, LSOA, local authority, etc)
nomisweb.co.uk
nomisweb.co.uk
personally, I didn't quite expect 'owns outright' would be the plurality in so many areas but that's what the Census 2021 data tells us (in 2001 it was 29% owns outright across E&W) - but of course pluralities are important in lots of ways and therefore quite interesting to me
the other particularly interesting thing I noticed from the local authority tenure data was the shared ownership %
- highest was in Milton Keynes, at 6.1%
followed by
- Tower Hamlets at 2.6%
- Hackney at 2.5%
- South Cambridgeshire at 2.5%
- Newham at 2.4%
- highest was in Milton Keynes, at 6.1%
followed by
- Tower Hamlets at 2.6%
- Hackney at 2.5%
- South Cambridgeshire at 2.5%
- Newham at 2.4%
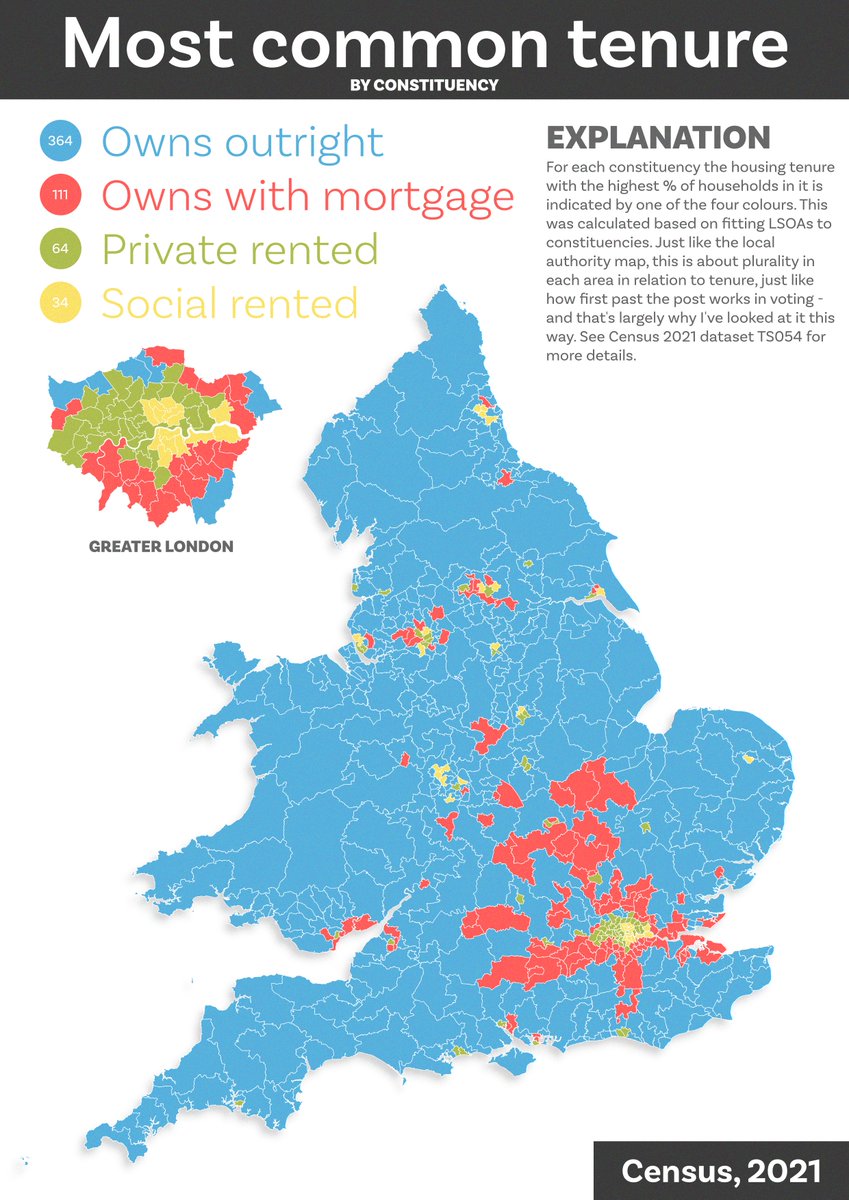
same plurality-by-area approach to looking at housing tenure, but this time using constituency boundaries instead of local authorities (I did this using the new LSOA tenure data) - i.e. a FPTP view of the data for areas in which FPTP is used
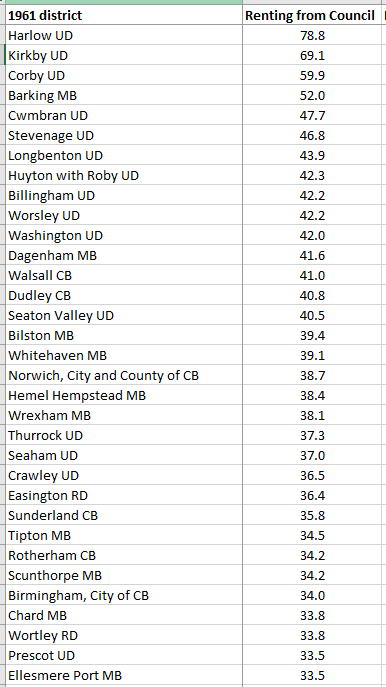
you can get the 1961 Census data on Nomis these days too and although the tenure breakdown is a bit different it's still pretty interesting e.g. the 'Renting from Council' category
nomisweb.co.uk
nomisweb.co.uk
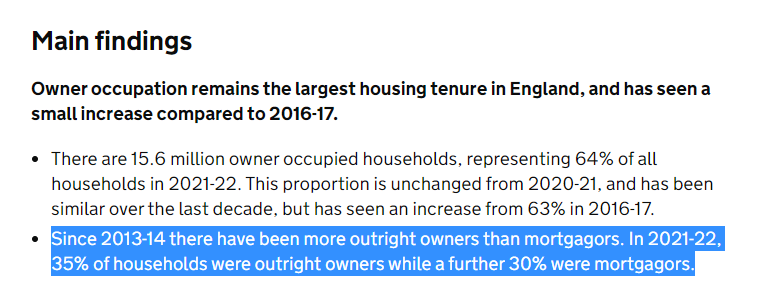
non-Census data too: the English Housing Survey 2021 to 2022 (released 15 Dec 2022) notes that since 2013-14 there have been more outright owners than mortgagors - with 64% of all households being owner occupied in England
gov.uk
gov.uk
Loading suggestions...