

The most successful use the ROIC (return on invested capital) metric.
•Terry smith
•Charlie munger
•Li Lu
•Guy Spier
These super investors all out a big focus on the metric, but what does it represent?
•Terry smith
•Charlie munger
•Li Lu
•Guy Spier
These super investors all out a big focus on the metric, but what does it represent?
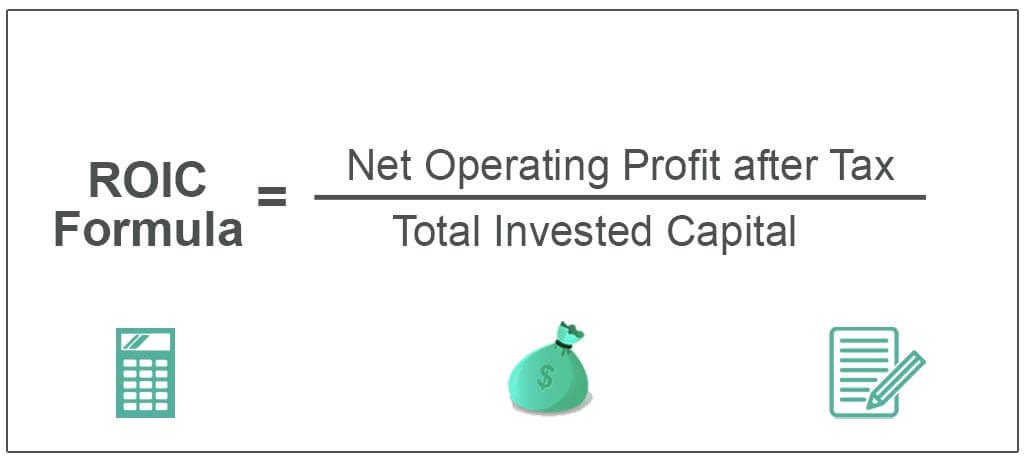
The ROIC shows you how well a company is at investing it’s own cash.
Basically company XYZ makes $200mil
->
invests it back into the company for growth
->
makes 20% on the investment(ROIC 20%)
->
makes $240mil
->
invests it again
->
makes $288mil
Basically company XYZ makes $200mil
->
invests it back into the company for growth
->
makes 20% on the investment(ROIC 20%)
->
makes $240mil
->
invests it again
->
makes $288mil
At the end of the day, if you invest into a business for the long term, a well run company should be competent in the way it allocated cash for growth.
Compounding does the rest over time.
Your returns over the long term mirror growth +- share basis(dilution or buybacks).
Compounding does the rest over time.
Your returns over the long term mirror growth +- share basis(dilution or buybacks).
The question now is do I have data to prove the point?
For that I will use the study made by Jake McRobie.
He created a study from 1961 to 2016 (55.5y or 666 months) categorizing stocks into 10 grade of ROIC (low to high).
For that I will use the study made by Jake McRobie.
He created a study from 1961 to 2016 (55.5y or 666 months) categorizing stocks into 10 grade of ROIC (low to high).
The study is clear in its findings.
The lowest group would have returned an average of 1.134%/month. This equates to $1 growing into $488.
The SP500 would have turned $1 into $624.5.
The higher ROIC returned 1.663%/month which would have turned $1 into $15,214.
The lowest group would have returned an average of 1.134%/month. This equates to $1 growing into $488.
The SP500 would have turned $1 into $624.5.
The higher ROIC returned 1.663%/month which would have turned $1 into $15,214.
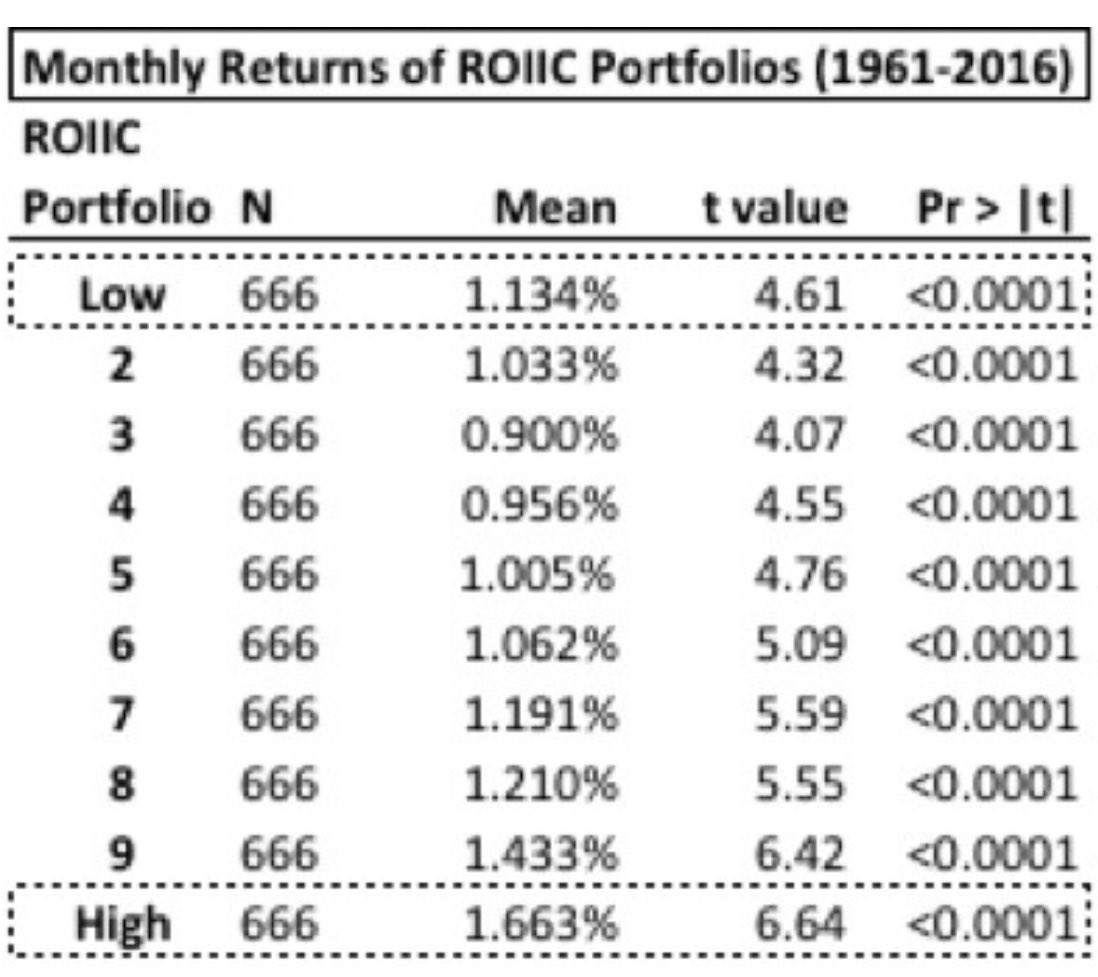
The returns using the high ROIC beats the SP500 by a factor of 24x.
Most financial ratios like the PE ratio show a relative numbers which have no meaning given the growth and margins of each companies are different.
The ROIC however shows the compounding ability of a company.
Most financial ratios like the PE ratio show a relative numbers which have no meaning given the growth and margins of each companies are different.
The ROIC however shows the compounding ability of a company.
Loading suggestions...